pleabnicrop
Soapbox

Cannabis, Soil Science and Sustainability

By Drew Plebani
5 Comments
pleabnicrop

The average commercial cannabis cultivator seems to be following the modern agricultural paradigm. That model is based on questionable and, one might say, ineffective soil systems management.

In the high-yield cannabis world, amidst decades of prohibition, following the lead of the modern agricultural model has resulted in the adoption of cultural practices that go something like this: Use and destroy the soil, then dispose of it once it is rendered lifeless and useless due to repeated heavy applications of chemical fertilizers, pesticides, and other poisons.
commercialcultivator
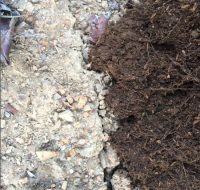
(Left) unimproved site soil next to (right) improved site soil. Notice the root mass developing on the right

Certainly conventional agricultural food production and the soil management systems underpinning them are faltering, evidenced by soil systems deteriorating many times faster than they are being improved. This qualifies as a failure in my book.

What will be the fate of profit margins, sustainability and medicine in the cannabis industry if we continue to follow blindly in the footsteps of chemical agriculture? Perhaps it is time to turn over a new leaf.

A little context for the discussion: scientists say the Earth has lost a third of arable land in the past 40 years, and some say soil erosion is the number one challenge facing the world today. Why? How?

Well…world agricultural production accounts for about three-quarters of the soil erosion worldwide. This steep decline in arable soil is occurring during a time when the world’s demand for food is rapidly increasing. It is estimated that the world will need to grow 50% more food by 2050, and it is important to note that, the total volume of food necessary, remains relative to the nutrient density of the food.

Time for a radical solution, and cannabis can lead the way.

Currently, cannabis is the most profitable crop per land area and very likely the most resource-consumptive crop grown (due to the current legal and regulatory climate and thus limited supply vs. demand).

As the cannabis industry continues to grow, now more than ever we have the opportunity, and I believe the responsibility, to cultivate in ecologically mindful ways, improve the end product and it’s positive impacts, increase both short-term and long-term profits, decrease or eliminate waste and lower the carbon footprint of cannabis cultivation operations.

commercialcultivator
A cover crop under trellis’ with cannabis plants

Most importantly, we have the opportunity to fund, implement and lead the way in research and development of sustainable, medical, phytonutrient-dense crop production methodologies.

Only by implementing more rigorous scientific methods to cannabis cultivation can we hope to provide truly meaningful improvements in and contributions to the fields of agriculture, science, medicine and human health.

While dumpsters of potting soil continue to roll off to the landfill, complex health and human science and the cultivators truly engaged in science will continue to provide meaningful data regarding plant compounds and what factors influence the best outcome for the desired end product.
commercialcultivator
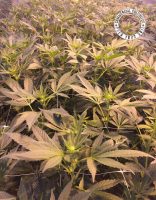
The same crop pictured above, now two weeks into flowering, using cover crops

I am willing to bet that what is best will not be coming from the business models employing antiquated, wasteful and destructive cultivation strategies, and that in due time these models will fade into distant memories.

This is the first in a series of articles, in which we will explore topics related to the pursuit of high yield, phytonutrient-dense “high brix” cannabis production.

The next article will provide a historical and geologic context to the cannabis plant, as viewed from the scope of soil biology and the progression of ecosystems and soil types, and how maximized genetic expression, through maximized soil and plant health influence the production of high quality cannabis.

amandarigdon
The Practical Chemist

Calibration Part II – Evaluating Your Curves

By Amanda Rigdon
No Comments
amandarigdon

Despite the title, this article is not about weight loss – it is about generating valid analytical data for quantitative analyses. In the last installment of The Practical Chemist, I introduced instrument calibration and covered a few ways we can calibrate our instruments. Just because we have run several standards across a range of concentrations and plotted a curve using the resulting data, it does not mean our curve accurately represents our instrument’s response across that concentration range. In order to be able to claim that our calibration curve accurately represents our instrument response, we have to take a look at a couple of quality indicators for our curve data:

  1. correlation coefficient (r) or coefficient of determination (r2)
  2. back-calculated accuracy (reported as % error)

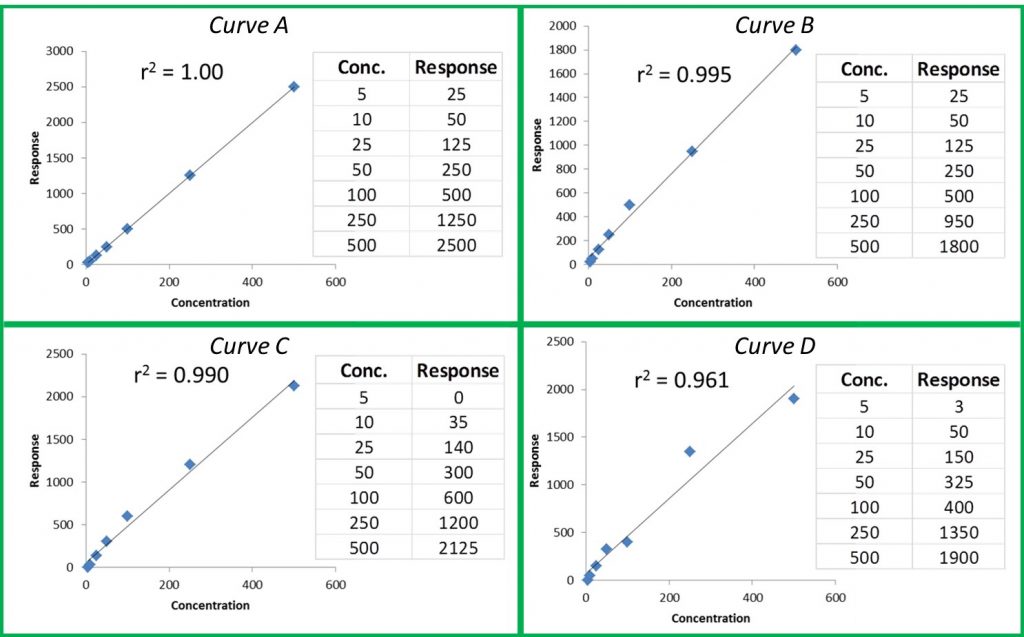
The r or r2 values that accompany our calibration curve are measurements of how closely our curve matches the data we have generated. The closer the values are to 1.00, the more accurately our curve represents our detector response. Generally, r values ≥0.995 and r2 values ≥ 0.990 are considered ‘good’. Figure 1 shows a few representative curves, their associated data, and r2 values (concentration and response units are arbitrary).

Figure 1: Representative Curves and r2 values

Let’s take a closer look at these curves:

Curve A: This represents a case where the curve perfectly matches the instrument data, meaning our calculated unknown values will be accurate across the entire calibration range.

Curve B: The r2 value is good and visually the curve matches most of the data points pretty well. However, if we look at our two highest calibration points, we can see that they do not match the trend for the rest of the data; the response values should be closer to 1250 and 2500. The fact that they are much lower than they should be could indicate that we are starting to overload our detector at higher calibration levels; we are putting more mass of analyte into the detector than it can reliably detect. This is a common problem when dealing with concentrated samples, so it can occur especially for potency analyses.

Curve C: We can see that although our r2 value is still okay, we are not detecting analytes as we should at the low end of our curve. In fact, at our lowest calibration level, the instrument is not detecting anything at all (0 response at the lowest point). This is a common problem with residual solvent and pesticide analyses where detection levels for some compounds like benzene are very low.

Curve D: It is a perfect example of our curve not representing our instrument response at all. A curve like this indicates a possible problem with the instrument or sample preparation.

So even if our curve looks good, we could be generating inaccurate results for some samples. This brings us to another measure of curve fitness: back-calculated accuracy (expressed as % error). This is an easy way to determine how accurate your results will be without performing a single additional run.

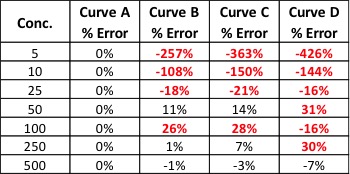
Back-calculated accuracy simply plugs the area values we obtained from our calibrators back into the calibration curve to see how well our curve will calculate these values in relation to the known value. We can do this by reprocessing our calibrators as unknowns or by hand. As an example, let’s back-calculate the concentration of our 500 level calibrator from Curve B. The formula for that curve is: y = 3.543x + 52.805. If we plug 1800 in for y and solve for x, we end up with a calculated concentration of 493. To calculate the error of our calculated value versus the true value, we can use the equation: % Error = [(calculated value – true value)/true value] * 100. This gives us a % error of -1.4%. Acceptable % error values are usually ±15 – 20% depending on analysis type. Let’s see what the % error values are for the curves shown in Figure 1.

practical chemist table 1
Table 1: % Error for Back-Calculated Values for Curves A – D

Our % error values have told us what our r2 values could not. We knew Curve D was unacceptable, but now we can see that Curves B and C will yield inaccurate results for all but the highest levels of analyte – even though the results were skewed at opposite ends of the curves.

There are many more details regarding generating calibration curves and measuring their quality that I did not have room to mention here. Hopefully, these two articles have given you some tools to use in your lab to quickly and easily improve the quality of your data. If you would like to learn more about this topic or have any questions, please don’t hesitate to contact me at amanda.rigdon@restek.com.

teganheadshot
Quality From Canada

Secure Software Monitoring — Two Keys to Success

By Tegan Adams
No Comments
teganheadshot

We have two key software platforms at our laboratory that help us stay compliant with our standard operating procedures. Saif Al-Dujaili, quality manager at Eurofins-Experchem, oversees quality assurance in our laboratory. As we like to say, you are safe with Saif.

A Customized Sample Tracking System

Sample-tracking software consists of four main modules:

Tracking samples in our facility: When a sample is booked by our tracking system, a unique identification number is generated by the system and printed on a sticker, which is placed on the sample. When a sample is booked, department heads then have the ability to assign work orders to the analysts through the tracking system.

When testing is complete, results are entered by the analyst into the tracking system and reviewed by the quality assurance (QA) department. QA reviewers are responsible for approving results entered in the system before they are sent to the client. A certificate of analysis is then generated and e-mailed to the client for their review.

Controlling stability studies conducted in our facility: Stability studies are scheduled and controlled on different samples pulled for analysis. Within our facility’s sample-tracking system we have different chamber names with different conditions where products can be placed. Which chamber we place samples in depends on protocols and requests from our client. The software used also generates a unique study number for each stability study that occurs. The stability schedule that includes each study is reviewed every week by the stability coordinator to schedule what samples need to be pulled for testing.

Controlling methods used for tests: Methods are entered into the tracking system after department heads have reviewed them and it is approved by QA. The tracking system generates a unique ID number for each method as well as each sample. The method can now be tracked in our laboratory’s system. Within the software you can enter the name of the method, client name and effective date and any revisions applied to the method.

Controlling inventory of columns and electrodes: Sample tracking also helps us with our purchasing patterns to make sure we have supplies for our client’s testing needs. Every time that columns and electrodes are received, they are entered into our tracking system for inventory purposes.

REES Environmental Monitoring Software

REES is used to monitor the environmental conditions of our testing facility. Key inputs measured include temperature, humidity, differential pressure and elimination or intensity of light. REES is linked to the QA department’s computers. An audible alarm is sounded as well as e-mails sent to QA personnel to notify them if anything is out of specification. REES also phones related personnel’s cell phones to notify them of any alarms. No alarms are missed, even if they occur after working hours. Having a 24-hour environmental monitoring system in place helps Eurofins-Experchem ensure integrity in operations of stability, microbiological and other environmental conditions essential for accuracy in testing results.

Marijuana Matters

Let’s Talk CBD

By David C. Kotler, Esq.
2 Comments

Let’s talk about cannabidiol, CBD, a non-psychoactive component of cannabis. Let’s not talk about CBD from the whole plant. This is a conversation about the proliferation of hemp-based CBD marketed everywhere from gas stations to specialty health and wellness stores. Heck, “its legal in all 50 states”, right?

On the Federal Level, pursuant to Title 21 USC 802 Section (16) The term “marijuana” means all parts of the plant cannabis sativa L., whether growing or not; the seeds thereof; the resin extracted from any part of such plant; and every compound, manufacture, salt, derivative, mixture, or preparation of such plant, its seeds or resin. The term does not include the mature stalks of such plant, fiber produced from such stalks, oil or cake made from the seeds of such plant, any other compound, manufacture, salt, derivative, mixture, or preparation of such mature stalks (except the resin extracted therefrom), fiber, oil, or cake, or the sterilized seed of such plant which is incapable of germination.

Proponents of the position that hemp-derived CBD is legal point to the lack of a specific definition under the above description (often asserting that their oil is not processed from the flower) and the Ninth Circuit’s opinion in Hemp Indus. Ass’n v DEA, 333 F.3d 1082 (9th Cir. 2003). They buttress their belief by citing the DEA’s clarification of hemp in the Federal Register released in October 2001 and the 2013 Farm Bills’ adoption of the following definition of industrial hemp (adopted from plant scientists research in the 70’s: “The term ‘industrial hemp’ means the plant, cannabis sativa L. and any part of such plant, whether growing or not, with a delta-9 tetrahydrocannabinol H. R. 2642—265 concentration of not more than 0.3 percent on a dry weight basis.” Much of the foregoing has been extended to even support opinions that hemp-derived CBD from domestic sources under the 2013 Farm Bill is legal for distribution nationwide.

Opponents of the hemp-derived CBD is legal argument (putting aside the issues with imported hemp and contaminants, etc.) point to the exception in the definition of “marijuana” i.e. to actually get a workable form of CBD from hemp, the preparation of the stalk puts you into the resin category which is excepted from the terms that are specifically not included in “marijuana.” In regard to HIA v. DEA cited above, opponents posit that the court decision, never mentions CBD, and the HIA maintain that this ruling did not legalize CBD.

In February 2015 and again in February 2016 the FDA issued warning letters to CBD companies. The overall context of the letters dealt with mislabeling and improper claims in addition to the most recent round of letters addressing CBD products’ exclusion from the dietary supplement definition under the FD&C act and how that is affected by CBD’s consideration as a new drug in one or more new drug applications. What has not been addressed or asserted by the FDA is the legal status of CBD under the Controlled Substances Act.

Although I have seen many commentators and attorneys opine on the legality as the case may be of hemp-derived CBD and its ability to be shipped to and sold in all 50 states (often with a caveat that readers should consult them for further advice), I have never seen the issue addressed from a practitioner that deals with the United States Patent and Trademark Office. I am not that practitioner. However, I do represent a company that has recently made application. I, not being a trademark attorney, but being sensitive to the federal government’s position collectively on CBD, found the examiner’s questions in her Office Action Letter surrounding CBD to be quite interesting. They were as follows:

  1. Do applicant’s identified goods contain marijuana, marijuana based preparations, or marijuana extracts or derivatives, synthetic marijuana, or any other illegal controlled substances?
  2. If the applicant’s goods contain Cannabidiol (CBD), is this derived from marijuana or from industrial hemp?
  3. Are the applicant’s goods lawful pursuant to the Controlled Substances Act?

I searched for another application and Office Action Letter from 2016 for another CBD product (both were vaporizer products rather than the lotions, balms, etc. that have been the subject of other applications). The questions to that applicant mirrored those above.

What I take from the questions that trademark examiners are asking is that perhaps the debate raging in academic and legal circles is for naught. It looks like at least the USPTO has resigned itself to there being a difference between cannabis or whole plant and hemp-based CBD in terms of definition and proscription under the federal controlled substances act.

So we have come full circle in my question, ‘Is it legal in all fifty states?’ If you answer yes to that question then please provide me the definition of marijuana/cannabis from the Controlled Substance Act from each of the fifty states individually and a copy of the documentation from a source showing how the industrial hemp was grown and processed and verifiable lab reports of the particular product’s contents.

The Practical Chemist

Calibration – The Foundation of Quality Data

By Amanda Rigdon
1 Comment

This column is devoted to helping cannabis analytical labs generate valid data right now with a relatively small amount of additional work. The topic for this article is instrument calibration – truly the foundation of all quality data. Calibration is the basis for all measurement, and it is absolutely necessary for quantitative cannabis analyses including potency, residual solvents, terpenes, and pesticides.

Just like a simple alarm clock, all analytical instruments – no matter how high-tech – will not function properly unless they are calibrated. When we set our alarm clock to 6AM, that alarm clock will sound reproducibly every 24 hours when it reads 6AM, but unless we set the correct current time on the clock based on some known reference, we can’t be sure when exactly the alarm will sound. Analytical instruments are the same. Unless we calibrate the instrument’s signal (the response) from the detector to a known amount of reference material, the instrument will not generate an accurate or valid result.

Without calibration, our result may be reproducible – just like in our alarm clock example – but the result will have no meaning unless the result is calibrated against a known reference. Every instrument that makes a quantitative measurement must be calibrated in order for that measurement to be valid. Luckily, the principle for calibration of chromatographic instruments is the same regardless of detector or technique (GC or LC).

Before we get into the details, I would like to introduce one key concept:

Every calibration curve for chromatographic analyses is expressed in terms of response and concentration. For every detector the relationship between analyte (e.g. a compound we’re analyzing) concentration and response is expressible mathematically – often a linear relationship.

Now that we’ve introduced the key concept behind calibration, let’s talk about the two most common and applicable calibration options.

Single Point Calibration

This is the simplest calibration option. Essentially, we run one known reference concentration (the calibrator) and calculate our sample concentrations based on this single point. Using this method, our curve is defined by two points: our single reference point, and zero. That gives us a nice, straight line defining the relationship between our instrument response and our analyte concentration all the way from zero to infinity. If only things were this easy. There are two fatal flaws of single point calibrations:

  1. We assume a linear detector response across all possible concentrations
  2. We assume at any concentration greater than zero, our response will be greater than zero

Assumption #1 is never true, and assumption #2 is rarely true. Generally, single point calibration curves are used to conduct pass/fail tests where there is a maximum limit for analytes (i.e. residual solvents or pesticide screening). Usually, quantitative values are not reported based on single point calibrations. Instead, reports are generated in relation to our calibrator, which is prepared at a known concentration relating to a regulatory limit, or the instrument’s LOD. Using this calibration method, we can accurately report that the sample contains less than or greater than the regulatory limit of an analyte, but we cannot report exactly how much of the analyte is present. So how can we extend the accuracy range of a calibration curve in order to report quantitative values? The answer to this question brings us to the other common type of calibration curve.

Multi-Point Calibration:

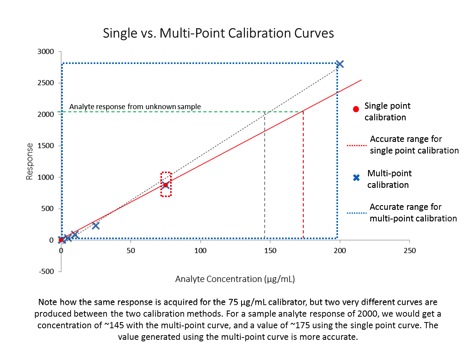
A multi-point calibration curve is the most common type used for quantitative analyses (e.g. analyses where we report a number). This type of curve contains several calibrators (at least 3) prepared over a range of concentrations. This gives us a calibration curve (sometimes a line) defined by several known references, which more accurately expresses the response/concentration relationship of our detector for that analyte. When preparing a multi-point calibration curve, we must be sure to bracket the expected concentration range of our analytes of interest, because once our sample response values move outside the calibration range, the results calculated from the curve are not generally considered quantitative.

The figure below illustrates both kinds of calibration curves, as well as their usable accuracy range:

Calibration Figure 1

This article provides an overview of the two most commonly used types of calibration curves, and discusses how they can be appropriately used to report data. There are two other important topics that were not covered in this article concerning calibration curves: 1) how can we tell whether or not our calibration curve is ‘good’ and 2) calibrations aren’t permanent – instruments must be periodically re-calibrated. In my next article, I’ll cover these two topics to round out our general discussion of calibration – the basis for all measurement. If you have any questions about this article or would like further details on the topic presented here, please feel free to contact me at amanda.rigdon@restek.com.

plantsjacques
Biros' Blog

Ongoing Pesticide Recalls a Sign of Industry Maturity

By Aaron G. Biros
No Comments
plantsjacques

Regulators in Colorado last week announced another massive recall of cannabis found to contain banned pesticides. 92 batches of cannabis plants, with roughly a dozen plants in each batch, were recalled for using the product, Guardian, on the plants. The culprit was an ingredient in the product called avermectin, a pesticide listed as a ‘bad actor’ by the Pesticide Action Network.

The recall follows dozens of others in Colorado this year, all because tests found pesticides present in cannabis samples. When news spreads of cannabis recalls due to concerns of pesticide contamination, it paints a picture of worrisome problems rampant in the cannabis industry. Alarmists say continued recalls could have disastrous consequences like stalling legalization initiatives or slowing growth in new markets.

In the food industry, recalls are a part of routine business. The FDA created the Reportable Food Registry (RFR) as a way to prevent the shipment of contaminated food products into the supply. In 2015, Chipotle Mexican Grill made news when it sickened dozens with an E.coli outbreak and issued extensive recalls as a result. After that happened, the company reevaluated its practices and improved their food safety program to prevent future outbreaks.

When a recall occurs, it should prompt a surge in inquiries, responses and audits that need to be addressed and reviewed carefully. Ample proactive planning including HACCP, comprehensive risk analysis and validation studies or documents help prevent recalls from occurring in the first place. When recalls do happen, reactive measures should occur immediately with a strategy in place to deal with all of the regulatory compliance, quality, safety and branding ramifications.

When a recall occurs in the food industry, it generally means that there was a foodborne illness outbreak, followed by a reactive measure. That reactive measure, the recall itself, is what prevents foodborne illness outbreaks from growing or becoming an epidemic. Recalls in the food industry show that regulators are concerned about contamination and taking action to safeguard public health. In other words, when a recall occurs, it means that someone is watching.

I think recalls in the cannabis industry are a sign of the marketplace growing up. Recalls can be seen as a good thing, a sign of proper safety measures in place to prevent further contamination. Reporting recalls or failures means that professionals are beginning to pay attention to the safety and quality of processes in place at cannabis production facilities. Looking at the long-term sustainability of the cannabis industry, keeping quality and safety at top of mind will help businesses self-legitimize. Those not striving for the safest practices and the best quality will lose their ability to compete as the market continues to grow. Recalls can tarnish a company’s brand, but they also indicate that the industry has reached a point of legitimacy. Cannabis is now out of the closet and under a microscope.

Consumerguide
Soapbox

A New Tool to Make Cannabis Evaluation Easy

By Matthew Huron
3 Comments
Consumerguide

All cannabis is not created equal.

Just as industry experts have developed a set of tools to assess artisan experiences with wine, craft beer and diamonds, our team of cannabis cultivators at Good Chemistry Nurseries- who hold decades of experience backed by extensive education in horticulture and botany- have developed a new consumer guide to evaluate the essential aspects of cannabis called STATS (Sight, Touch, Aroma, Taste, Sensation). We hope the newly developed guide will begin an industry-wide dialogue about consumer education and provide fundamental knowledge on how to evaluate the quality of a cannabis flower.

STATSGuide
A view of the materials for consumers

STATS was created in response to our customers’ growing desire to differentiate between high quality and low quality flower. Two years ago, a consumer may have walked into a dispensary, and may have been thrilled just to be able to buy legal and safe cannabis. Fast forward two years, and now they’re asking, “How do I recognize quality cannabis?” By introducing STATS as a consumer awareness campaign, we are hoping to meet the needs of consumers to understand the complexities of the cannabis flower, as well as opening up the industry to a more conservative market that might be overwhelmed and intimidated by the cannabis culture.

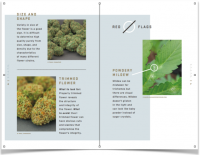
STATS, which is available at no cost at statsguide.org and at Good Chemistry dispensary locations, is designed as an interactive booklet that breaks down the complexities and characteristics of quality cannabis through the five main categories; sight, touch, aroma, taste and sensation. The short, easy-to-read tool also comes with a concise glossary, which includes definitions of cannabis-related words, and expressions that might not be palpable to a novice consumer. Here is an overview of the STATS tool to evaluate quality cannabis:

Consumerguide
The STATS take away guide book for consumers

Sight: Seeing the flower can sometimes be the only evaluation option before purchase. It is important to know the visual cues for remarkable cannabis. STATS help consumers evaluate qualities including: trichome content, color, structure, size and trim.

Touch: Touching the flower can help with evaluating the cure, or the controlled drying process used to achieve proper moisture content post-harvest. STATS define how the bud should feel.

Aroma: Distinctions can be made between high and poor quality cannabis aroma. Because each flower strain can have a unique scent, STATS reviews what scents should be expected, and what smells can denote poor quality.

Taste: Different flowers strains will have unique flavor profiles. Similar to wine tasting, experience is necessary, STATS helps consumers learn to distinguish between different flavors among the flower strains.

goodchemistryteam
The development team of STATS

Sensation: The first sensation that comes from cannabis is the sensation of lift, or of being high. Varying experience levels may affect how people feel with each strain and the amount of time people feel lifted. We have identified the key categories of sensations that come from different strains including amplify, relax, relieve, and sleep.

Now, there is an easy and free tool to provide novice and aficionado cannabis users new insight and understanding into the purchase they’re about to make. Good Chemistry Nurseries developed STATS in conjunction with our Colorado-based master cultivators Duncan Cameron, Scott Toland, Heath Byington and Stephen Spinosa. Our development team came to this idea with a strong desire to address consumers’ interest in learning more about how to assess high quality cannabis.

TeganAdams_Eurofinsexperchem
Quality From Canada

Following a Cannabis Sample Through the Lab: 9 Important Steps

By Tegan Adams
No Comments
TeganAdams_Eurofinsexperchem

Anytime a cannabis sample enters a laboratory, the sample is received, handled, weighed, identified and traced throughout the testing and disposal process. Laboratories working with cannabis must have quality systems in place to ensure every action taken to test the cannabis sample is documented and in compliance with good manufacturing practices. Eurofins-Experchem’s sample receipt and handling SOPs includes the following key elements.

  1. Purpose: The purpose of the SOP is outlined to make sure it’s outcome is understood
  2. Scope: The Scope of the SOP explains what events the SOP is intended to avoid and which events the SOP is intended to encourage
  3. Responsibilities: All positions that the SOP affects are outlined
  4. Initial Receipt of the Sample: Samples are submitted to Eurofins Experchem Laboratories with a Sample Information Form. In Canada, cannabis is regulated as a controlled substance. Controlled substances come with a special shipping document and must be weighed upon receipt to the lab to make sure the weight is the same as the client has indicated. Cannabis samples received are inspected to ensure no tampering or damage has occurred to the sample before it is tested. Any temperature and/or storage requirements are noted and followed. If any conditions are not understood the client is contacted for clarification immediately. Pending the sample’s conditions are met, the sample is placed into the laboratory.
  5. Procedure: Eurofins Experchem uses its own sample tracking software to track a sample across the lab. A unique project number and date of entry is given to the sample.  Client name, product name, condition of sample, test(s) performed, ID or lot number and size of samples are all recorded. A sticker is attached to the sample to clarify.
  6. Rush Samples: Rush samples are stamped “RUSH” in red and are placed in a priority sequence. The sample is placed in the safe until required for testing. If the product is not cannabis, the sample is placed on a shelf corresponding with the actual day of the month it was received and entered into sample tracking. If the sample requires cold temperatures it is placed in a refrigerated area and monitored in a similar way.
  7. Discrepancies: Any discrepancies in information found on the sample that may differentiate from what the client requests will be communicated to the client upon finding.
  8. Controlled Documents: Stickers, original lab specification sheets, sample submission forms, and SOP training evaluation questionnaires.
  9. Results: As soon as testing is completed, lab results are approved by quality assurance reviewers. A Certificate of Analysis (COA) is electronically and automatically sent through the sample tracking system to the client’s email.
Wellness Watch

Strain-Specific Labeling Edibles

By Dr. Emily Earlenbaugh, PhD.
No Comments

As the marketplace for cannabis products continues to evolve, we are seeing more and more strain-specific edible products hitting the shelves. Still, the majority of products remain strain-ambiguous, simply mentioning that the products contain cannabis and perhaps whether they are indica or sativa blends. While there are compelling reasons to go strain-specific, there are also serious challenges to doing it well.

The most compelling argument for strain-specific edibles is that your patients are more likely to get what they want (and thus more likely to come back for more). Many strain sensitive patients avoid almost all edibles because of a few bad experiences. Without knowing what strain you are consuming, you are left to gamble with your experience. Rather than take the risk, many patients choose to make edibles at home.

When talking to patients, I hear countless stories of bad experiences, along with the desire for more strain-specific edibles. Of course, creating strain-specific products is harder than it sounds. For one thing, it is difficult to source a consistent supply of large amounts of a single strain. This requires either an incredibly well run cultivation operation in-house, or strong, stable relationships with growers that are willing to grow a particular strain consistently.

In addition, labeling becomes more complex when you are strain-specific. Instead of one product, with one package and one label, you need to have individual labels for each strain. If you are using multiple strains, you need multiple labels. For small edibles manufacturers, things can get complicated. They usually need to source cannabis strains from the local market and may not be able to get a lot of consistency. This means plenty of small batches of single strains, rather than a consistent supply of a few set strains, and requires smaller batches of packaging, raising the cost of your inputs. So for many, the solution is to make one label and shift the strains depending on what’s in stock without notifying the consumer. Another method is to blend whatever strains you can find into one type of mixed strain product. While this offers an easy method for producers, it can have negative effects on the patient.

Those continually shifting blends of hybrid, indica or sativa edible products typically contain cannabis trim from many different strains. As we know, strains produce a large variety of effects, from sedative to energizing, relaxing to panic inducing. Mixing many carefully designed strains together can create all kinds of strange effects. It can be akin to mixing medications; it is hard to say what the result of the mix of chemicals will be. This can leave strain-sensitive patients feeling like each edible experience is a roll of the dice, wondering, “Will this help me or hurt me?” A number of patients have told me they gave up on edibles all together.

For those looking to use strain-specific labeling, but feeling held back by issues with sourcing and packaging consistency, try making one product package (that is strain ambiguous) with space for a strain specific sticker. Printing stickers on demand will cost less, then you can label the strains you currently have access to. Giving your patients access to strain information allows them to make an informed choice about what they are taking. Consumer education can draw in a customer base that is already primed to like your product and increases the chances that they will ultimately become satisfied, repeat customers.

Aaron_headshot
Soapbox

Bridging the Gap: Doctors, Education and Compliance

By Aaron G. Biros
No Comments
Aaron_headshot

Doctors are still very hesitant to recommend cannabis in medical treatment of their patients. A key aspect missing from the medical cannabis industry is participation from physicians and the medical community. Cannabis’ Schedule I drug status blocks medical research and leaves a stigma in the medical community. Doctors are concerned with the implications of recommending cannabis, the possibility of losing their license to practice and most lack any formal education in prescribing cannabis. The DEA’s recent announcement to consider rescheduling cannabis this year could dramatically impact doctor’s willingness to work with the drug.

The DEA’s plan to release a decision on the matter represents a major shift in attitude toward treating patients with medical cannabis. This could very possibly culminate in the rescheduling of cannabis, which would allow for more medical research, including clinical trials. Dr. Scott Gottlieb, board-certified anesthesiologist and pain management specialist from Pearl River, New York, believes the bigger obstacles for doctors prescribing cannabis include the stigma associated with it, legal concerns and physicians’ lack of education. Dr. Gottlieb has practices in both New York and New Jersey where he recommends patients cannabis. He believes there should be some type of recourse to help physicians circumvent legal issues. “Some of the bigger legal concerns regarding cannabis surround complying with state regulations,” says Gottlieb. “That sort of compliance includes confirming the diagnosis of the patient with thorough documentation, making sure it is an approved condition to treat with cannabis, documenting continued treatment of the illness and clearing the patient of any contraindications.”

Dr. Gottlieb believes it should be a collaborative effort on behalf of states, dispensaries and patients working to help educate doctors on the legal concerns surrounding the recommendation of cannabis. “Physicians are not taught anything in medical school about dosing or the medical effects of cannabis,” says Gottlieb. “With more education we can get rid of the stigma and get physicians aware of the potential benefits for their patients and the ability to control dosage in medication.”

Currently, there is very little communication between doctors and dispensaries in New York. A collaborative effort to educate all stakeholders involved could help get more doctors involved and streamline the entire process. “Doctors want patients to feel comfortable and know what to expect in receiving treatment with cannabis,” continues Gottlieb. “Which will come with a more transparent system, involving patients, doctors and dispensaries in a conversation about education.”

Pointing to the success of doctors actively recommending cannabis could also facilitate doctor participation. “The number one reason why I recommend cannabis is that I have a number of patients that use it to successfully treat their conditions and completely eliminate their opioid regiment,” says Gottlieb. That kind of success in a treatment should grab the attention of physicians as what could possibly be best for their patients. With more education and research, doctors will gradually feel more comfortable recommending cannabis to their patients.