Tag Archives: analyte

Dr. Ed Askew
From The Lab

Quality Plans for Lab Services: Managing Risks as a Grower, Processor or Dispensary, Part 3

By Dr. Edward F. Askew
No Comments
Dr. Ed Askew

Editor’s Note: The views expressed in this article are the author’s opinions based on his experience working in the laboratory industry. This is an opinion piece in a series of articles designed to highlight the potential problems that clients may run into with labs. 


In the last two articles, I discussed the laboratory’s first line of defense (e.g. certification or accreditation) paperwork wall used if a grower, processor or dispensary (user/client) questioned a laboratory result and the conflicts of interest that exist in laboratory culture. Now I will discuss the second line of defense that a laboratory will present to the user in the paperwork wall: Quality Control (QC) results.

Do not be discouraged by the analytical jargon of the next few articles. I suggest that you go immediately to the conclusions to get the meat of this article and then read the rest of it to set you on the path to see the forest for the trees.

QC in a laboratory consists of a series of samples run by the laboratory to determine the accuracy and precision of a specific batch of samples. So, to start off, let’s look at the definitions of accuracy and precision.QC Charts can provide a detailed overview of laboratory performance in a well-run laboratory.

According to the Standard Methods for the Examination of Water and Wastewater:

Accuracy: estimate of how close a measured value is to the true value; includes expressions for bias and precision.

Precision: a measure of the degree of agreement among replicate analyses of a sample.

A reputable laboratory will measure the Accuracy and Precision of QC samples in a batch of user samples and record these values in both the analytical test report issued to the user and in control charts kept by the laboratory. These control charts can be reviewed by the user if they are requested by the user. These control charts record:

Accuracy (means) chart: The accuracy chart for QC samples (e.g., LRB, CCV, LFBs, LFMs, and surrogates) is constructed from the average and standard deviation of a specified number of measurements of the analyte of interest.

Precision (range) chart: The precision chart also is constructed from the average and standard deviation of a specified number of measurements (e.g., %RSD or RPD) for replicate of duplicate analyses of the analyte of interest.

Now, let’s look at what should be run in a sample batch for cannabis analyses. The typical cannabis sample would have analyses for cannabinoids, terpenes, microbiological, organic compounds, pesticides and heavy metals.

Each compound listed above would require a specific validated analytical method for the type of matrix being analyzed. Examples of specific matrixes are:

  • Cannabis buds, leaves, oil
  • Edibles, such as Chocolates, Baked Goods, Gummies, Candies and Lozenges, etc.
  • Vaping liquids
  • Tinctures
  • Topicals, such as lotions, creams, etc.

Running QC analyses does not guarantee that the user’s specific sample in the batch was analyzed correctly.

Also, both ISO 17025-2005 and ISO 17025-2017 require the use of a validated method.

ISO 17025-2005: When it is necessary to use methods not covered by standard methods, these shall be subject to agreement with the customer and shall include a clear specification of the customer’s requirements and the purpose of the test and/or calibration. The method developed shall have been validated appropriately before use.

ISO 17025-2017: The laboratory shall validate non-standard methods, laboratory-developed methods and standard methods used outside their intended scope or otherwise modified. The validation shall be as extensive as is necessary to meet the needs of the given application or field of application.

Validation procedures can be found in a diverse number of analytical chemistry associations (such as AOACand ASTM) but the State of California has directed users and laboratories to the FDA manual “Guidelines for the Validation of Chemical Methods for the FDA FVM Program, 2nd Edition, 2015

The laboratory must have on file for user review the following minimum results in an analytical statistical report validating their method:

  • accuracy,
  • limit of quantitation,
  • ruggedness,
  • precision,The user must look beyond the QC data provided in their analytical report or laboratory control charts.
  • linearity (or other calibration model),
  • confirmation of identity
  • selectivity,
  • range,
  • spike recovery.
  • limit of detection,
  • measurement uncertainty,

The interpretation of an analytical statistical report will be discussed in detail in the next article. Once the validated method has been selected for the specific matrix, then a sample batch is prepared for analysis.

Sample Batch: A sample batch is defined as a minimum of one (1) to a maximum of twenty (20) analytical samples run during a normal analyst’s daily shift. A LRB, LFB, LFM, LFMD, and CCV will be run with each sample batch. Failure of any QC sample in sample batch will require a corrective action and may require the sample batch to be reanalyzed. The definitions of the specific QC samples are described later.

The typical sample batch would be set as:

  • Instrument Start Up
  • Calibration zero
  • Calibration Standards, Quadratic
  • LRB
  • LFB
  • Sample used for LFM/LFMD
  • LFM
  • LFMD
  • Samples (First half of batch)
  • CCV
  • Samples (Second half of batch)
  • CCV

The QC samples are defined as:

Calibration Blank: A volume of reagent water acidified with the same acid matrix as in the calibration standards. The calibration blank is a zero standard and is used to calibrate the ammonia analyzer

Continuing Calibration Verification (CCV): A calibration standard, which is analyzed periodically to verify the accuracy of the existing calibration for those analytes.

Calibration Standard: A solution prepared from the dilution of stock standard solutions. These solutions are used to calibrate the instrument response with respect to analyte concentration

Laboratory Fortified Blank (LFB): An aliquot of reagent water or other blank matrix to which known quantities of the method analytes and all the preservation compounds are added. The LFB is processed and analyzed exactly like a sample, and its purpose is to determine whether the methodology is in control, and whether the laboratory is capable of making accurate and precise measurements.

Laboratory Fortified Sample Matrix/Duplicate (LFM/LFMD) also called Matrix Spike/Matrix Spike Duplicate (MS/MSD): An aliquot of an environmental sample to which known quantities of ammonia is added in the laboratory. The LFM is analyzed exactly like a sample, and its purpose is to determine whether the sample matrix contributes bias to the analytical results. The background concentrations of the analytes in the sample matrix must be determined in a separate aliquot and the measured values in the LFM corrected for background concentrations (Section 9.1.3).Laboratories must validate their methods.

Laboratory Reagent Blank (LRB): A volume of reagent water or other blank matrix that is processed exactly as a sample including exposure to all glassware, equipment, solvents and reagents, sample preservatives, surrogates and internal standards that are used in the extraction and analysis batches. The LRB is used to determine if the method analytes or other interferences are present in the laboratory environment, the reagents, or the apparatus.

Once a sample batch is completed, then some of the QC results are provided in the user’s analytical report and all of the QC results should be recorded in the control charts identified in the accuracy and precision section above.

But having created a batch and performing QC sample analyses, the validity of the user’s analytical results is still not guaranteed. Key conclusion points to consider are:

  1. Laboratories must validate their methods.
  2. Running QC analyses does not guarantee that the user’s specific sample in the batch was analyzed correctly.
  3. QC Charts can provide a detailed overview of laboratory performance in a well-run laboratory.

The user must look beyond the QC data provided in their analytical report or laboratory control charts. Areas to look at will be covered in the next few articles in this series.

The Practical Chemist

Instrumentation for Heavy Metals Analysis in Cannabis

By Chris English
2 Comments

Determination of Toxic Metals in Cannabis

Heavy metals are common environmental contaminants often resulting from mining operations, industrial waste, automotive emissions, coal fired power plants, amount other sources. Several remediation strategies exist that are common for the reduction/elimination of metals in the environment. Phytoremediation is one method for removing metals from soil, utilizing plants to uptake metals which then bioaccumulate in the plant matter. In one study, cesium concentrations were found to be 8,000 times greater in the plant roots compared to the surrounding water in the soil. In 1998, cannabis was specifically tested at the Chernobyl nuclear disaster site for its ability to remediate the contaminated soil. These examples demonstrate that cannabis must be carefully cultivated to avoid the uptake of toxic metals. Possible sources would not only include the growing environment, but also materials such as fertilizers. Many states publish metal content in fertilizer products allowing growers to select the cleanest product for their plants. For cannabis plant material and concentrates several states have specific limits for cadmium (Cd), Lead (Pb), Arsenic (As) and Mercury (Hg), based on absolute limits in product or daily dosage by body weight.

Analytical Approaches to Metals Determination

Inductively Coupled Plasma, Ionized Argon gas stream. Photo Courtesy: Sigma via Wikimedia Commons

Flame Atomic Absorption Spectroscopy (Flame AA) and Graphite Furnace Atomic Absorption Spectroscopy (GFAA) are both techniques that determine both the identity and quantity of specific elements. For both of these techniques, the absorption in intensity of a specific light source is measured following the atomization of the sample digestate using either a flame or an electrically heated graphite tube. Reference standards are analyzed prior to the samples in order to develop a calibration that relates the concentration of each element relative to its absorbance. For these two techniques, each element is often determined individually, and the light source, most commonly a hollow cathode lamp (HLC) or electrodeless discharge lamp (EDL) are specific for each element. The two most common types of Atomic Emission Spectroscopy (AES) are; Inductively Coupled Plasma Optical Emission Spectroscopy (ICP-OES) and ICP-Mass Spectrometry (ICP-MS). Both of these techniques use an argon plasma for atomization of the sample digestates. This argon plasma is maintained using a radio frequency generator that is capable of atomization and excitation of the majority of the elements on the periodic table. Due to the considerably higher energy of the plasma-based instruments, they are more capable than the flame or furnace based systems for measurement of a wide range of elements. Additionally, they are based on optical emission, or mass spectrometric detection, and are capable of analysis of all elements at essentially the same time.

Technique Selection

Flame AA is easy to use, inexpensive and can provide reasonable throughput for a limited number of elements. However, changes to light sources and optical method parameters are necessary when determining different metals. GFAA is also limited by similar needs to change the light sources, though it is capable of greater sensitivity for most elements as compared to flame AA. Runtimes are on the order of three minutes per element for each sample, which can result in lower laboratory throughput and greater sample digestate consumption. While the sensitivity of the absorption techniques is reasonable, the dynamic range can be more limited requiring re-analyses and dilutions to get the sample within the calibration range. ICP-OES allows the simultaneous analysis of over 70 elements in approximately a minute per sample with a much greater linear dynamic range. ICP-OES instruments cost about 2-5 times more than AA instruments. ICP-MS generally has the greatest sensitivity (sub-parts-per-trillion, for some elements) with the ability to determine over 70 elements per minute. Operator complexity, instrument expense and MS stability, as well as cost are some of the disadvantages. The US FDA has a single laboratory validated method for ICP-MS for elements in food using microwave assisted digestion, and New York State recently released a method for the analysis of metals in medical cannabis products by ICP-MS (NYS DOH LINC-250).

The use of fertilizers, and other materials, with low metal content is one step necessary to providing a safe product and maintaining customer confidence. The state-by-state cannabis regulations will continue to evolve which will require instrumentation that is flexible enough to quickly accommodate added metals to the regulatory lists, lower detection limits while adding a high level of confidence in the data.

From The Lab

QuEChERS 101

By Danielle Mackowsky
No Comments

Sample preparation experts and analytical chemists are quick to suggest QuEChERS (Quick, Easy, Cheap, Effective, Rugged and Safe) to cannabis laboratories that are analyzing both flower and edible material for pesticides, mycotoxins and cannabinoid content. Besides having a quirky name, just what makes QuEChERS a good extraction technique for the complicated matrices of cannabis products? By understanding the chemistry behind the extraction and the methodology’s history, cannabis laboratories can better implement the technology and educate their workforce.

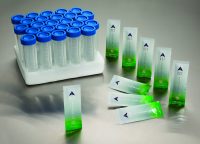
QuEChERS salt blends can be packed into mylar pouches for use with any type of centrifuge tubes

In 2003, a time when only eight states had legalized the use of medical cannabis, a group of four researchers published an article in the Journal of AOAC International that made quite the impact in the residue monitoring industry. Titled Fast and Easy Multiresidue Method Employing Acetonitrile Extraction/Partitioning and “Dispersive Solid-Phase Extraction” for the Determination of Pesticide Residues in Produce, Drs. Michael Anastassiades, Steven Lehotay, Darinka Štajnbaher and Frank Schenck demonstrate how hundreds of pesticides could be extracted from a variety of produce samples through the use of two sequential steps: an initial phase partitioning followed by an additional matrix clean up. In the paper’s conclusion, the term QuEChERS was officially coined. In the fourteen years that have followed, this article has been cited over 2800 times. Subsequent research publications have demonstrated its use in matrices beyond food products such as biological fluids, soil and dietary supplements for a plethora of analytes including phthalates, pharmaceutical compounds and most recently cannabis.

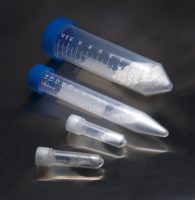
QuEChERS salts can come prepacked into centrifuge tubes

The original QuEChERS extraction method utilized a salt blend of 4 g of magnesium sulfate and 1 g of sodium chloride. A starting sample volume of 10 g and 10 mL of acetonitrile (ACN) were combined with the above-mentioned salt blend in a centrifuge tube. The second step, dispersive solid phase extraction (dSPE) cleanup, included 150 mg of magnesium sulfate and 25 mg of primary secondary amine (PSA). Subsequent extraction techniques, now known as AOAC and European QuEChERS, suggested the use of buffered salts in order to protect any base sensitive analytes that may be critical to one’s analysis. Though the pH of the extraction solvent may differ, all three methods agree that ACN should be used as the starting organic phase. ACN is capable of extracting the broadest range of analytes and is compatible with both LC-MS/MS and GC-MS systems. While ethyl acetate has also been suggested as a starting solvent, it is incompatible with LC-MS/MS and extracts a larger amount of undesirable matrix components in the final aliquot.

All laboratories, including cannabis and food safety settings, are constantly looking for ways to decrease their overhead costs, batch out the most samples possible per day, and keep their employees trained and safe. It is not a stretch to say that QuEChERS revolutionized the analytical industry and made the above goals tangible achievements. In the original publication, Anastassiades et al. established that recoveries of over 85% for pesticides residues were possible at a cost as low as $1 per ten grams of sample. Within forty minutes, up to twelve samples were fully extracted and ready to be analyzed by GC-MS, without the purchase of any specialized equipment. Most importantly, no halogenated solvents were necessary, making this an environmentally conscious concept. Due to the nature of the cannabis industry, laboratories in this field are able to decrease overall solvent usage by a greater amount than what was demonstrated in 2003. The recommended starting sample for cannabis laboratories is only one gram of flower, or a tenth of the starting volume that is commonly utilized in the food safety industry. This reduction in sample volume then leads to a reduction in acetonitrile usage and thus QuEChERS is a very green extraction methodology.

The complexity of the cannabis matrix can cause great extraction difficulties if proper techniques are not used

As with any analytical method, QuEChERS is not perfect or ideal for every laboratory setting. Challenges remain in the cannabis industry where the polarity of individual pesticides monitored in some states precludes them from being amenable to the QuEChERS approach. For cannabis laboratories looking to improve their pesticide recoveries, decrease their solvent usage and not invest their resources into additional bench top equipment, QuEChERS is an excellent technique to adopt. The commercialization of salt blends specific for cannabis flowers and edibles takes the guesswork out of which products to use. The growth of cannabis technical groups within established analytical organizations has allowed for better communication among scientists when it comes to best practices for this complicated matrix. Overall, it is definitely worth implementing the QuEChERS technique in one’s cannabis laboratory in order to streamline productivity without sacrificing your results.

The Practical Chemist

Pesticide Analysis in Cannabis and Related Products: Part 3

By Julie Kowalski
No Comments

As mentioned in Part 1, pesticides residue analysis is very challenging especially considering the complexity of cannabis and the variety of flower, concentrates and infused products. In addition, pesticides are tested at low levels typically at parts-per-billion (ppb). For example, the food safety industry often uses 10 ppb as a benchmark limit of quantification. To put that in perspective, current pesticides limits in cannabis range from 10 ppb default (Massachusetts Regulatory Limit) to a more typical range of 100 ppb to 2 ppm in other states. Current testing is also complicated by evolving regulations.

Despite these challenges, adaptation of methods used by the food safety industry have proved successful for testing pesticides in cannabis. These methods typically rely on mass spectrometric detection paired with sample preparation methods to render the sample clean enough to yield quality data.

Pesticide Analysis Methods: Sample preparation and Analytical Technique Strategy

Generally, methods can be divided into two parts; sample preparation and analytical testing where both are critical to the success of pesticide residue testing and are inextricably linked. Reliance on mass spectrometric techniques like tandem mass spectrometry and high resolution accurate mass (HRAM) mass spectrometry is attributed to the substantial sensitivity and selectivity provided. The sensitivity and selectivity achievable by the detector largely dictates the sample preparation that will be required. The more sensitive and selective the detector, the less rigorous and resource intensive sample preparation can be.

Analytical technique: Gas and Liquid Chromatography Tandem Mass Spectrometry 

The workhorse approach for pesticide residue analysis involves using gas chromatography and liquid chromatography tandem mass spectrometry (MS/MS) in the ion transition mode. This ion transition mode, often referred to as multiple reaction monitoring (MRM) or selected reaction monitoring (SRM), adds the selectivity and sensitivity needed for trace level analysis. Essentially, a pesticide precursor ion is fragmented into product ions. The detector monitors the signal for a specified product ion known to have originated from the pesticide precursor ion. This allows the signal to be corrected, associated with the analyte and not with other matrix components in the sample. In addition, because only ions meeting the precursor/product ion requirements are passed to the detector with little noise, there is a benefit to the observed signal to noise ratio allowing better sensitivity than in other modes. Even though ion transitions are specific, there is the possibility a matrix interference that also demonstrates that same ion transition could result in a false positive. Multiple ion transitions for each analyte are monitored to determine an ion ratio. The ion ratio should remain consistent for a specific analyte and is used to add confidence to analyte identification.

The best choice for pesticide analysis between gas chromatography (GC) and liquid chromatography (LC) is often questioned. To perform comprehensive pesticide screening similar to the way the food safety market approaches this challenge requires both techniques. It is not uncommon for screening methods to test for several hundred pesticides that vary in physiochemical properties. It may be possible that with a smaller list of analytes, only one technique will be needed but often in order to reach the low limits for pesticide residues both GC and LC are required.

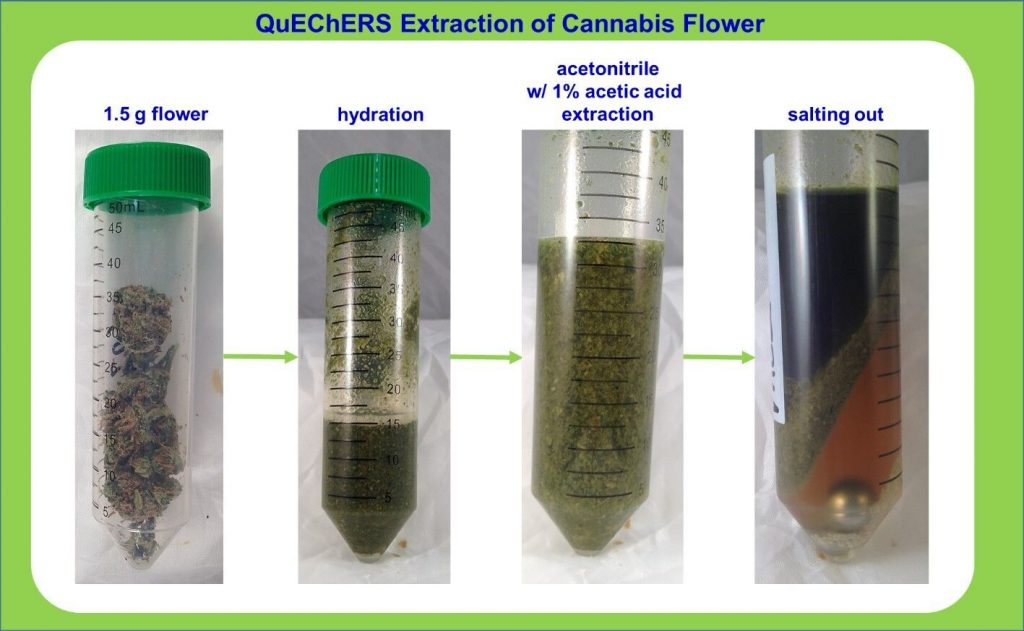
Modified QuEChERS extraction using 1.5 grams of cannabis flower. Courtesy of Julie Kowalski (Restek Corporation), Jeff Dahl (Shimadzu Scientific Instruments) and Derek Laine (Trace Analytics).

Analytical technique: Sample Preparation

Less extensive sample preparation is possible when combined with sensitive and selective detectors like MS/MS. One popular method is the QuEChERS approach. QuEChERS stands for Quick, Easy, Cheap, Effective, Rugged and Safe. It consists of a solvent extraction/salting out step followed by a cleanup using dispersive solid phase extraction. Originally designed for fruit and vegetable pesticide testing, QuEChERS has been modified and used for many other commodity types including cannabis. Although QuEChERS is a viable method, sometimes more cleanup is needed and this can be done with cartridge solid phase extraction. This cleanup functions differently and is more labor intensive, but results in a cleaner extract. A cleaner extract helps to secure quality data and is sometimes needed for difficult analyses.

Oregon Issues Health Alert for Contaminated Cannabis

By Aaron G. Biros
No Comments

According to Jonathan Modie, spokesman for the Oregon Health Authority (OHA), on Friday, October 21st, the OHA issued a ‘health alert’ regarding cannabis products sold from a McMinnville dispensary that were possibly tainted with extremely high levels of Spinosad, an insecticide commonly used to combat mites and other pests. “My understanding is that two medical patients purchased the cannabis products whom we had contact info for, but most of the purchasers were recreational customers,” says Modie. “Because it is not required to get contact info for recreational customers, we issued the health alert to get the word out as quickly as possible because we didn’t know who bought the product.” The OHA is urging consumers who purchased cannabis from New Leaf CannaCenter in McMinnville to check the labels and see if they purchased potentially dangerous cannabis, and to either return the cannabis to the dispensary or dispose of it appropriately.

oha_logo_lrgThe action level, the measured amount of pesticides in a product that the OHA deems potentially dangerous, for Spinosad is 0.2 parts-per-million (PPM). The two batches in question are the strains Dr. Jack (batch number G6J0051-02) and Marion Berry (batch number G6J0051-01), which were tested to contain approximately 42 PPM and 22 PPM respectively, much higher than the OHA’s action level.

While this is the first health alert issued in Oregon in connection with potentially contaminated cannabis, Modie says he expects there will be more health alerts in the future. “Unfortunately the product was inappropriately transferred from the grower to the dispensary and from the dispensary to customers, so we are working to get the word out to dispensaries, growers and processors about the testing rules to prevent this from happening in the future,” says Modie. “We want to make it clear that any grower, processor or dispensary that does not follow the testing requirements or fail to label, store or retain batches that fail a test will be subject to enforcement actions such as fines, penalties, suspension or revocation of their license.” The OHA has a list of pesticide analytes and their action levels on their website.

“We are advising recreational and medical users alike to read the product labels closely; the labels must have the license or registrant number, the packaging or distributor license number, the name of the strain and the universal symbol,” says Modie. “We are also suggesting consumers request a copy of pesticide test results from the dispensary.” It is unclear at this time if all of the cannabis products in question have been properly disposed of, but OHA was informed that New Leaf has pulled all products in question off of the shelf.