Tag Archives: analytical chemistry

amandarigdon
The Practical Chemist

Calibration Part II – Evaluating Your Curves

By Amanda Rigdon
No Comments
amandarigdon

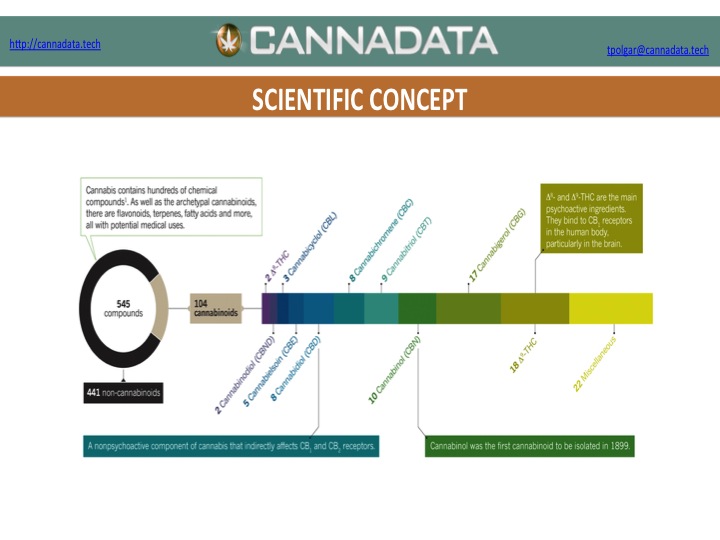
Despite the title, this article is not about weight loss – it is about generating valid analytical data for quantitative analyses. In the last installment of The Practical Chemist, I introduced instrument calibration and covered a few ways we can calibrate our instruments. Just because we have run several standards across a range of concentrations and plotted a curve using the resulting data, it does not mean our curve accurately represents our instrument’s response across that concentration range. In order to be able to claim that our calibration curve accurately represents our instrument response, we have to take a look at a couple of quality indicators for our curve data:

  1. correlation coefficient (r) or coefficient of determination (r2)
  2. back-calculated accuracy (reported as % error)

The r or r2 values that accompany our calibration curve are measurements of how closely our curve matches the data we have generated. The closer the values are to 1.00, the more accurately our curve represents our detector response. Generally, r values ≥0.995 and r2 values ≥ 0.990 are considered ‘good’. Figure 1 shows a few representative curves, their associated data, and r2 values (concentration and response units are arbitrary).

Figure 1: Representative Curves and r2 values

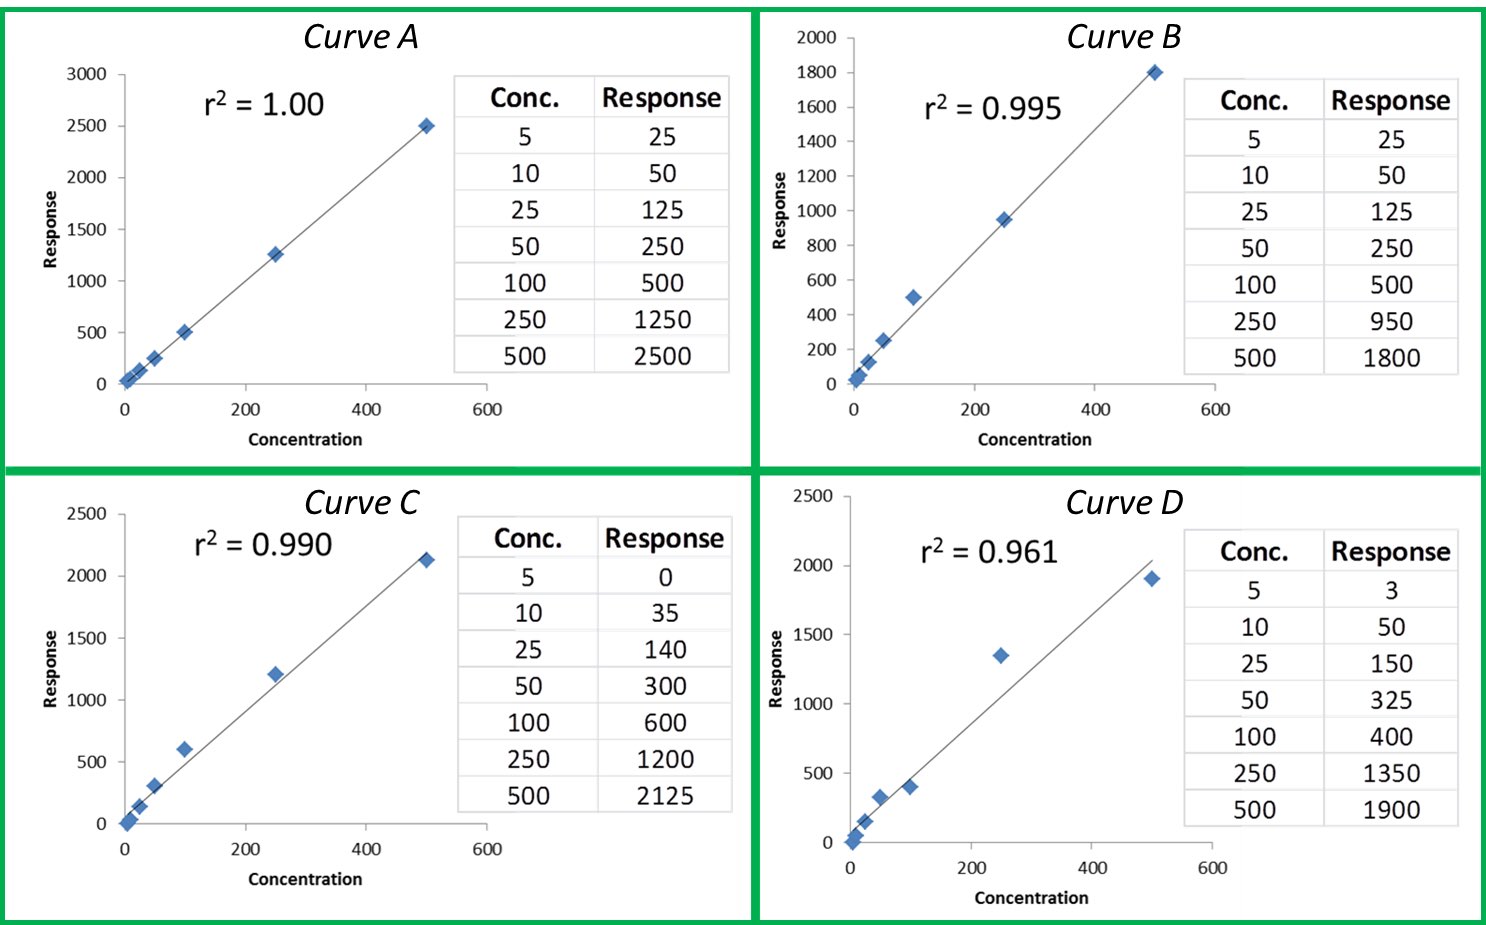
Let’s take a closer look at these curves:

Curve A: This represents a case where the curve perfectly matches the instrument data, meaning our calculated unknown values will be accurate across the entire calibration range.

Curve B: The r2 value is good and visually the curve matches most of the data points pretty well. However, if we look at our two highest calibration points, we can see that they do not match the trend for the rest of the data; the response values should be closer to 1250 and 2500. The fact that they are much lower than they should be could indicate that we are starting to overload our detector at higher calibration levels; we are putting more mass of analyte into the detector than it can reliably detect. This is a common problem when dealing with concentrated samples, so it can occur especially for potency analyses.

Curve C: We can see that although our r2 value is still okay, we are not detecting analytes as we should at the low end of our curve. In fact, at our lowest calibration level, the instrument is not detecting anything at all (0 response at the lowest point). This is a common problem with residual solvent and pesticide analyses where detection levels for some compounds like benzene are very low.

Curve D: It is a perfect example of our curve not representing our instrument response at all. A curve like this indicates a possible problem with the instrument or sample preparation.

So even if our curve looks good, we could be generating inaccurate results for some samples. This brings us to another measure of curve fitness: back-calculated accuracy (expressed as % error). This is an easy way to determine how accurate your results will be without performing a single additional run.

Back-calculated accuracy simply plugs the area values we obtained from our calibrators back into the calibration curve to see how well our curve will calculate these values in relation to the known value. We can do this by reprocessing our calibrators as unknowns or by hand. As an example, let’s back-calculate the concentration of our 500 level calibrator from Curve B. The formula for that curve is: y = 3.543x + 52.805. If we plug 1800 in for y and solve for x, we end up with a calculated concentration of 493. To calculate the error of our calculated value versus the true value, we can use the equation: % Error = [(calculated value – true value)/true value] * 100. This gives us a % error of -1.4%. Acceptable % error values are usually ±15 – 20% depending on analysis type. Let’s see what the % error values are for the curves shown in Figure 1.

practical chemist table 1
Table 1: % Error for Back-Calculated Values for Curves A – D

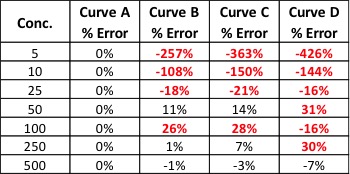
Our % error values have told us what our r2 values could not. We knew Curve D was unacceptable, but now we can see that Curves B and C will yield inaccurate results for all but the highest levels of analyte – even though the results were skewed at opposite ends of the curves.

There are many more details regarding generating calibration curves and measuring their quality that I did not have room to mention here. Hopefully, these two articles have given you some tools to use in your lab to quickly and easily improve the quality of your data. If you would like to learn more about this topic or have any questions, please don’t hesitate to contact me at amanda.rigdon@restek.com.

UCT-Dspe

Pesticide & Potency Analysis of Street-Grade versus Medicinal Cannabis

By Danielle Mackowsky
2 Comments
UCT-Dspe

In states where cannabis is legalized, some analytical laboratories are tasked with identifying and quantifying pesticide content in plant material. This is a relatively new concept in the study of cannabis as most forensic laboratories that work with seized plant material are only concerned with positively identifying the sample as cannabis. Laboratories of this nature, often associated with police departments, the office of the chief medical examiner or the local department of public health are not required to identify the amount of THC and other cannabinoids in the plant. While data is abundant that compares the average THC content in today’s recreational cannabis to that commonly consumed in the 1960s and 1970s, limited scientific studies can be found that discuss the pesticide content in street-grade cannabis.

cannabis-siezed
Street-grade cannabis that is ground into a fine powder

Using the QuEChERS approach, which is the industry gold-standard in food analysis for pesticides, a comparison study was carried out to analyze the pesticide and cannabinoid content in street-grade cannabis versus medicinal cannabis. For all samples, one gram of plant material was ground into a fine powder prior to hydration with methanol. The sample was then ready to be placed into an extraction tube, along with 10 mL of acetonitrile and one pouch of QuEChERS salts. After a quick vortex, all samples were then shaken for 1 minute using a SPEX Geno/Grinder prior to centrifugation.

Quenchers-analysis
Formation of layers following QuEChERS extraction

For pesticide analysis, a one mL aliquot of the top organic layer was then subjected to additional dispersive solid phase extraction (dSPE) clean-up. The blend of dSPE salts was selected to optimize the removal of chlorophyll and other interfering compounds from the plant material without compromising the recovery of any planar pesticides. Shaken and centrifuged under the same conditions as described above, an aliquot of the organic layer was then transferred to an auto-sampler vial and diluted with deionized water. Cannabinoid analysis required serial dilutions between 200 to 2000 times, depending on the individual sample. Both pesticide and cannabinoid separation was carried out on a UCT Selectra® Aqueous C18 HPLC column and guard column coupled to a Thermo Scientific Dionex UltiMate 3000 LC System/ TSQ VantageTM tandem MS.

UCT-Dspe
Supernatant before and after additional dispersive SPE clean-up using UCT’s Chlorofiltr

Pesticide Results

Due to inconsistent regulations among states that have legalized medicinal or recreational cannabis, a wide panel of commonly encountered pesticides was selected for this application. DEET, recognized by the EPA as not evoking health concerns to the general public when applied topically, was found on all medical cannabis samples tested. An average of 28 ng/g of DEET was found on medicinal samples analyzed. Limited research as to possible side effects, if any, of having this pesticide present within volatilized medical-grade product is available. Street-grade cannabis was found to have a variety of pesticides at concentrations higher than what was observed in the medical-grade product.

Potency Results

Tetrahydrocannabinolic acid A (THCA-A) is the non-psychoactive precursor to THC. Within fresh plant material, up to 90% of available THC is found in this form. Under intense heating such as when cannabis is smoked, THCA-A is progressively decarboxylated to the psychoactive THC form. Due to possible therapeutic qualities of this compound, medical cannabis samples specifically were tested for this analyte in addition to other cannabinoids. On average, 17% of the total weight in each medical cannabis sample came from the presence of THCA-A. In both medical and recreational samples, the percentage of THC contribution ranged from 0.9-1.7.

Summary

A fast and effective method was developed for the determination of pesticide residues and cannabis potency in recreational and medical cannabis samples. Pesticide residues and cannabinoids were extracted using the UCT QuEChERS approach, followed by either additional cleanup using a blend of dSPE sorbents for pesticide analysis, or serial dilutions for cannabinoid potency testing.

amandarigdon
The Practical Chemist

Easy Ways to Generate Scientifically Sound Data

By Amanda Rigdon
1 Comment
amandarigdon

I have been working with the chemical analysis side of the cannabis industry for about six years, and I have seen tremendous scientific growth on the part of cannabis labs over that time. Based on conversations with labs and the presentations and forums held at cannabis analytical conferences, I have seen the cannabis analytical industry move from asking, “how do we do this analysis?” to asking “how do we do this analysis right?” This change of focus represents a milestone in the cannabis industry; it means the industry is growing up. Growing up is not always easy, and that is being reflected now in a new focus on understanding and addressing key issues such as pesticides in cannabis products, and asking important questions about how regulation of cannabis labs will occur.

While sometimes painful, growth is always good. To support this evolution, we are now focusing on the contribution that laboratories make to the safety of the cannabis consumer through the generation of quality data. Much of this focus has been on ensuring scientifically sound data through regulation. But Restek is neither a regulatory nor an accrediting body. Restek is dedicated to helping analytical chemists in all industries and regulatory environments produce scientifically sound data through education, technical support and expert advice regarding instrumentation and supplies. I have the privilege of supporting the cannabis analytical testing industry with this goal in mind, which is why I decided to write a regular column detailing simple ways analytical laboratories can improve the quality of their chromatographic data right now, in ways that are easy to implement and are cost effective.

Anyone with an instrument can perform chromatographic analysis and generate data. Even though results are generated, these results may not be valid. At the cannabis industry’s current state, no burden of proof is placed on the analytical laboratory regarding the validity of its results, and there are few gatekeepers between those results and the consumer who is making decisions based on them. Even though some chromatographic instruments are super fancy and expensive, the fact is that every chromatographic instrument – regardless of whether it costs ten thousand or a million dollars – is designed to spit out a number. It is up to the chemist to ensure that number is valid.

In the first couple of paragraphs of this article, I used terms to describe ‘good’ data like ‘scientifically-sound’ or ‘quality’, but at the end of the day, the definition of ‘good’ data is valid data. If you take the literal meaning, valid data is justifiable, logically correct data. Many of the laboratories I have had the pleasure of working with over the years are genuinely dedicated to the production of valid results, but they also need to minimize costs in order to remain competitive. The good news is that laboratories can generate valid scientific results without breaking the bank.

In each of my future articles, I will focus on one aspect of valid data generation, such as calibration and internal standards, explore it in practical detail and go over how that aspect can be applied to common cannabis analyses. The techniques I will be writing about are applied in many other industries, both regulated and non-regulated, so regardless of where the regulations in your state end up, you can already have a head start on the analytical portion of compliance. That means you have more time to focus on the inevitable paperwork portion of regulatory compliance – lucky you! Stay tuned for my next column on instrument calibration, which is the foundation for producing quality data. I think it will be the start of a really good series and I am looking forward to writing it.

amandarigdon

Amanda Rigdon to Offer Guidance on Method Validation at Cannabis Labs Conference

By Aaron G. Biros
No Comments
amandarigdon

With multiple states now requiring third-party certification as part of licensing cannabis laboratories, there is a large role for laboratory accreditation in the cannabis industry. Using method validation can prove that your data is reproducible and that you have robust methods for sample preparation and calibration. All of these tools are instrumental in getting a laboratory accredited.

Amanda Rigdon, associate marketing manager for GC columns at Restek, Inc.
Amanda Rigdon, associate marketing manager for GC columns at Restek

Amanda Rigdon, associate marketing manager for gas chromatography columns at Restek, Inc., will deliver a presentation, Opportunities and Challenges for Method Validation in the Evolving Cannabis Industry, at the first annual Cannabis Labs Conference taking place this March 9th in Atlanta, Georgia. The Cannabis Labs Conference will be co-located with the third annual Food Labs Conference and the Pittsburgh Conference on Analytical Chemistry and Applied Spectroscopy (Pittcon) at the Georgia World Congress Center.

scottradcliffe
Scott Radcliffe, technical support scientist at Romer Labs, Inc.

In her presentation, Rigdon will discuss established validation guidelines from a variety of regulatory bodies. “Method validation is absolutely critical to the cannabis industry,” she says. “Accurate test results not only help to protect consumers, but because of the high dollar value of cannabis products, accurate results can also protect producers from false positives, and laboratories in backing up their results.” She will also be sharing actual validation data from a number of cannabis analytical methods.

Scott Radcliffe, technical support scientist at Romer Labs, Inc., will share his validation methods of immunoassays for the detection of pathogens and mycotoxins in cannabis. He will include a discussion of specific rapid pathogen detection methods for Salmonella and E. coli O157 species. This will cover their small-scale validation studies with partner labs in Michigan and Washington for immunoassays.

stevegoldner
Stephen Goldner, Esq, founder of Pinnacle Laboratory and Regulatory Affairs Associates

Stephen Goldner, Esq, founder of Pinnacle Laboratories, will discuss how cannabis labs can apply FDA lab practices with recommendations for short and long term management implementation. Goldner’s presentation will include a discussion of  preparation for FDA involvement in sate regulatory systems.

Beyond validation methods in laboratories, the Cannabis Labs Conference will feature several presentations on ISO/IEC 17025:2005 compliance, the need for standardization, seed-to-sale traceability, FDA best lab practices and cannabis quality. Nic Easley, chief executive officer of Comprehensive Cannabis Consulting (3C), will deliver the keynote presentation on the role of quality assurance in the cannabis industry.

Tech Startup Seeking Investors for Cannabis Data Research Tool

By Aaron G. Biros
No Comments

Innovations in technology used for cannabis research have the potential to lead to major breakthroughs and discoveries for the plant’s various applications. Software and information technologies are particularly useful for sorting through the tremendous amount of data required in medical research and the cannabis industry. Tímea Polgár, founder of CannaData, worked in the pharmaceutical and biotech industries previously as a molecular biologist and computational chemist.

Tímea Polgár, founder of CannaData

Her background in informatics, pharmaceutical research, molecular biology and chemistry brings her to the cannabis industry to study the plant in an herbal medicine context using high-tech informatics. Polgár, originally from Hungary, received her PhD from Budapest University of Technology and Engineering in pharmaceutical drug discovery. She has worked as a senior research scientist at Gedeon Richter in Budapest and as a senior molecular modeler at Servier, Inc. in Paris, France. After leaving the pharmaceutical industry, she began working at a startup called Chemaxon, a chemistry informatics company working on scientific business development. Polgár has worked for years in scientific business development, leveraging technology and knowledge to businesses, which brought her to work across multiple disciplines.

CannaData is essentially a software tool used to gather information on strain genetics, chemical components of different strains, molecular mechanisms of different strains and the medicinal effects. According to Polgár, the company plans to build a continuously growing data repository in conjunction with computational modeling and research in determining entourage effects to pinpoint how active chemical agents in cannabis interact. The tool will help scientists find areas of the plant that need more studying and areas that are inert. In addition to the database, CannaData will provide scientific analysis of data from seed banks, laboratories, clinics and other businesses collecting data in the cannabis industry.

A flowchart of the scientific concept behind herbal medicine research

Polgár’s organization is currently seeking investors to launch the project in hopes of connecting the cannabis industry, herbal medicine and computational chemistry for more accurate scientific research and understanding of the plant. According to Polgár, research and development of disease-fighting drugs has long had a narrow-minded approach. “Herbal medicine is very complex with numerous active chemical components. Recent technological and computational advancements have made it possible to study these chemical network interactions,” says Polgár. “The cannabis industry could provide a pioneering route for the novel concept of combining herbal medicinal research with information technology, furthering our molecular understanding of the benefits of cannabis.”

A flowchart breaking down the chemical composition of cannabis

Polgár believes that this type of research has the ability to help support standardization and quality control in the cultivation of cannabis. “We are linking technologies to herbal medicine and cannabis where there is a huge need to manage, extract and analyze data,” says Polgár. “Today, there are computational technologies that can manage this quantity of information required to model and understand herbal molecular mechanisms and we will be the first ones to do so on a commercial level.”

A flowchart describing the technical concept of CannaData, depicting the utility of a data repository
The technical concept of CannaData, depicting the utility of a data repository

Polgár’s organization is seeking investors looking to innovate in the areas of life sciences, pharmaceutical research and software development. Through bringing broad information technological solutions from research to the cannabis industry, CannaData hopes to serve analytical laboratories with chemical informatics software services. Ultimately, this project will serve the cannabis industry by analyzing data on strain genetics and known chemical profiles of cannabis, furthering scientific research on cannabis.