Tag Archives: calibration

An Evaluation of Sample Preparation Techniques for Cannabis Potency Analysis

By Kelsey Cagle, Frank L. Dorman, Jessica Westland
No Comments

Sample preparation is an essential part of method development and is critical to successful analytical determinations. With cannabis and cannabis products, the analyst is faced with a very challenging matrix and targets that may range from trace level through percent level thus placing considerable demands on the sample preparation techniques.1 The optimal sample preparation, or “extraction”, method for potency analysis of cannabis flower was determined using a methanol extraction coupled with filtration using regenerated cellulose filters. 

In the United States (US), Canada, and other countries where medicinal and/or adult recreational cannabis has been legalized, regulatory entities require a panel of chemical tests to ensure quality and safety of the products prior to retail sales2. Cannabis testing can be divided into two different categories: Quality and Safety. Quality testing, which includes potency analysis (also known as cannabinoid testing or cannabinoid content), is performed to analyze the product in accordance with the producer/grower expectations and government regulations. Safety testing is conducted under regulatory guidelines to ensure that consumers are not exposed to toxicants such as pesticides, mycotoxins, heavy metals, residual solvents and microbial contaminates.

Potency testing evaluates the total amount of cannabinoid content, specifically focusing on tetrahydrocannabinol (THC) and cannabidiol (CBD). In the US, the biggest push for accurate total THC is to differentiate between hemp (legally grown for industrial or medicinal use), which is defined as cannabis sativa with a THC limit ≤ 0.3 %, and cannabis (Cannabis spp.), which is any cannabis plant with THC measured above 0.3 %3. Potency testing is typically performed by liquid chromatography (LC) with UV detection to determine the quantity of major cannabinoids.

In addition to reporting THC and CBD, their respective precursors are also important for reporting total potency. Tetrahydrocannabinolic acid (THCA) is the inactive precursor to THC while cannabidiolic acid (CBDA) is the precursor to CBD.4,5

Methods and Materials

Sample Preparation

All samples were homogenized using an immersion blender with a dry material grinder. The nominal sample amounts were 200 mg of flower, 500 mg of edibles, and 250 mg of candy samples.

Potency Extraction Method (1)

Twenty milliliters (mL) of methanol (MeOH) was added to each sample. The samples were mechanically shaken for 10 minutes and centrifuged for 5 minutes.

Potency Extraction Method (2)

Ten mL of water was added to each sample. The samples were mechanically shaken for 10 minutes. 20 mL of acetonitrile (ACN) was then added to each sample and vortexed. An EN QuEChERS extraction salt packet was added to the sample. The samples were placed on a mechanical shaker for 2 minutes and then centrifuged for 5 minutes.

Each extract was split and evaluated with two filtration/cleanup steps: (1) a regenerated cellulose (RC) syringe filter (Agilent Technologies, 4 mm, 0.45 µm); (2) a PFTE syringe filter (Agilent Technologies, 4 mm, 0.45 µm). The final filtered extracts were injected into the ultra-performance liquid chromatograph coupled with a photodiode array detector (UPLC-PDA) for analysis.

Figure 1: Calibration curve for THC potency

Calibration

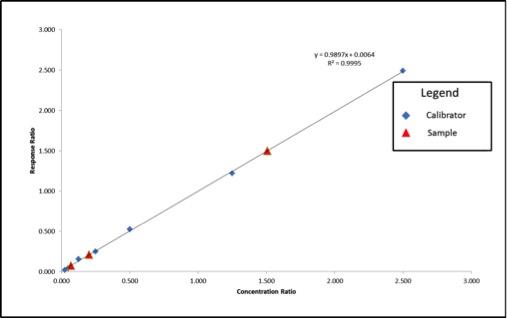
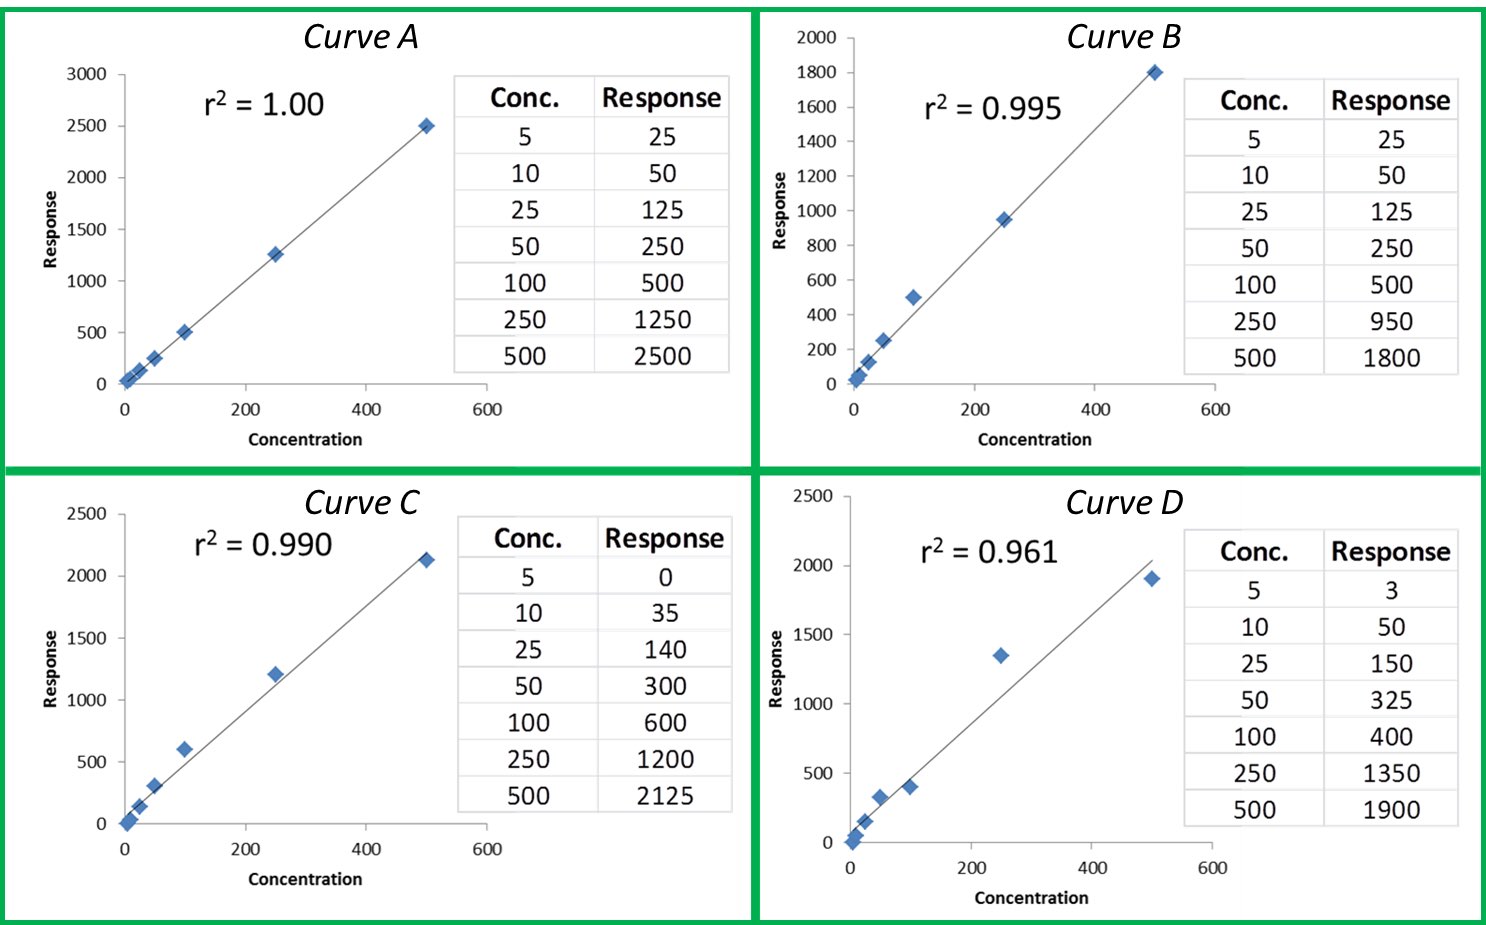
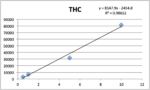
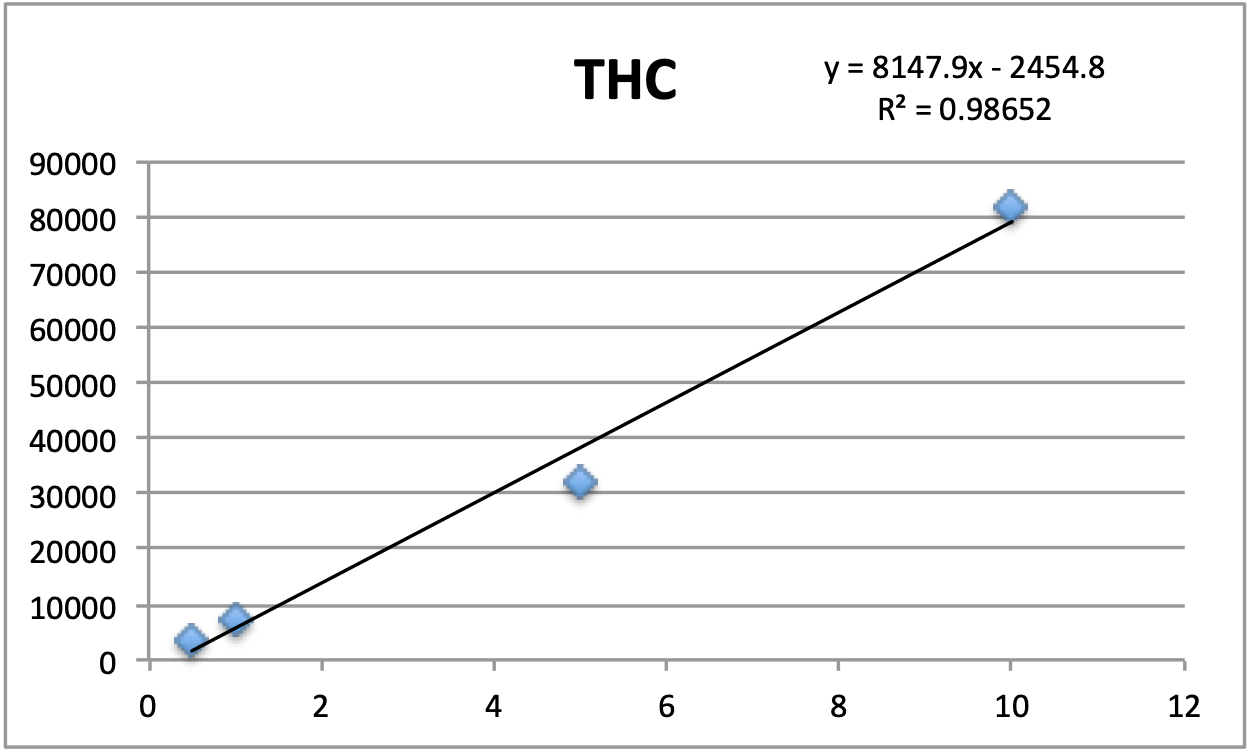
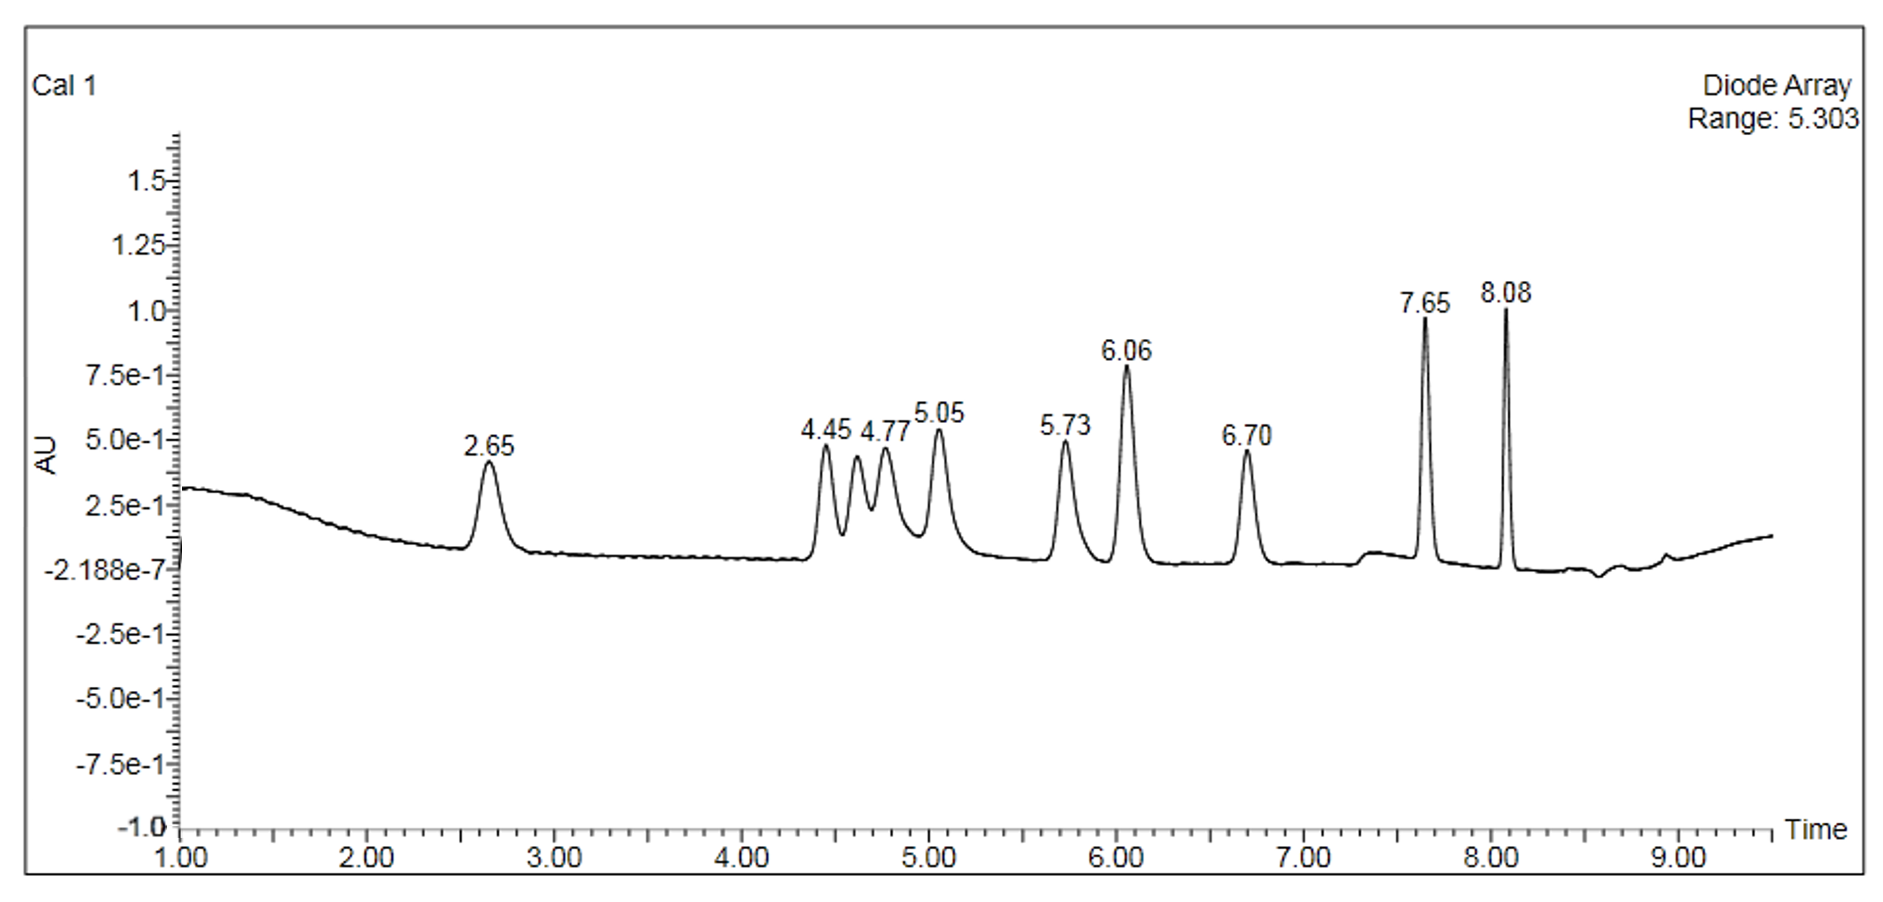
Standards were obtained for the following cannabinoids at a concentration of 1 mg/mL: cannabidivarin (CBDV), tetrahydrocannabivarin (THCV), cannabidiol (CBD), cannabigerol (CBG), cannabidiolic acid (CBDA), cannabigerolic acid (CBGA), cannabinol (CBN), tetrahydrocannabinol (9-THC), cannabichromene (CBC), tetrahydrocannabinol acid (THCA). Equal volumes of each standard were mixed with MeOH to make a standard stock solution of 10 ug/mL. Serial dilutions were made from the stock to make concentrations of 5, 1, and 0.5 ug/mL for the calibration curve (Figure 1).

Instrumental Method

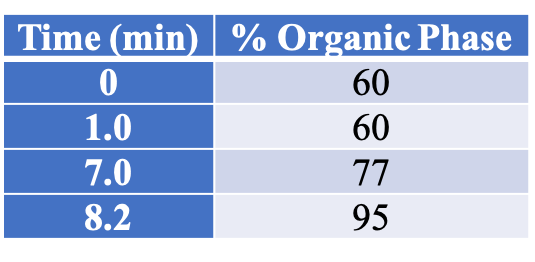
All instrument parameters were followed from Agilent Application Note 5991-9285EN.8 A UPLC with a PDA (Waters Corp, Milford, MA) detector was employed for potency analysis. An InfinityLab Poroshell 120 EC-C18, 3.0 x 50 mm, 2.7 um column (Agilent Technologies, Wilmington, DE) was utilized for compound separation. The organic mobile phase composition was 0.05 % (v/v) formic acid in HPLC grade MeOH and the aqueous mobile phase composition was 0.1 % (v/v) formic acid in HPLC grade water. The mobile phase gradient is shown in Table 1. The flow rate was 1 mL/min (9.5 minute total program), injection volume was 5 uL, and column temperature was 50 °C.

Table 1: LC mobile phase gradient for potency samples6

Discussion and Results

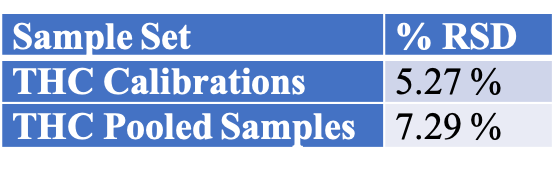
Table 2 summarizes the relative standard deviations (% RSD) were found for the THC calibrator (at 1 ug/mL) and one extract of a homogeneous sample (utilizing 7 replicates).

Table 2- %RSD values for the instrument response precision for THC in both the calibrations and the homogeneous extract.

The cannabinoid potency of various cannabis plant and cannabis product samples were determined for the various extraction techniques In the chromatograms THC was observed ~8.08 minutes and CBD was observed ~4.61 minutes (Figure 2).

Figure 2: Chromatogram of the 10ug/mL calibrator for potency/cannabinoid analysis

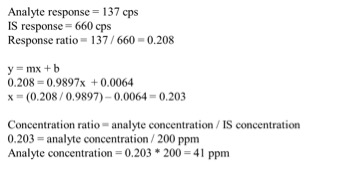
Total potency for THC & CBD were calculated for each sample using the equations below. Equation 1 was used because it accounts for the presence of THCA as well as the specific weight difference between THC and THCA (since THCA will eventually convert to THC, this needs to be accounted for in the calculations).

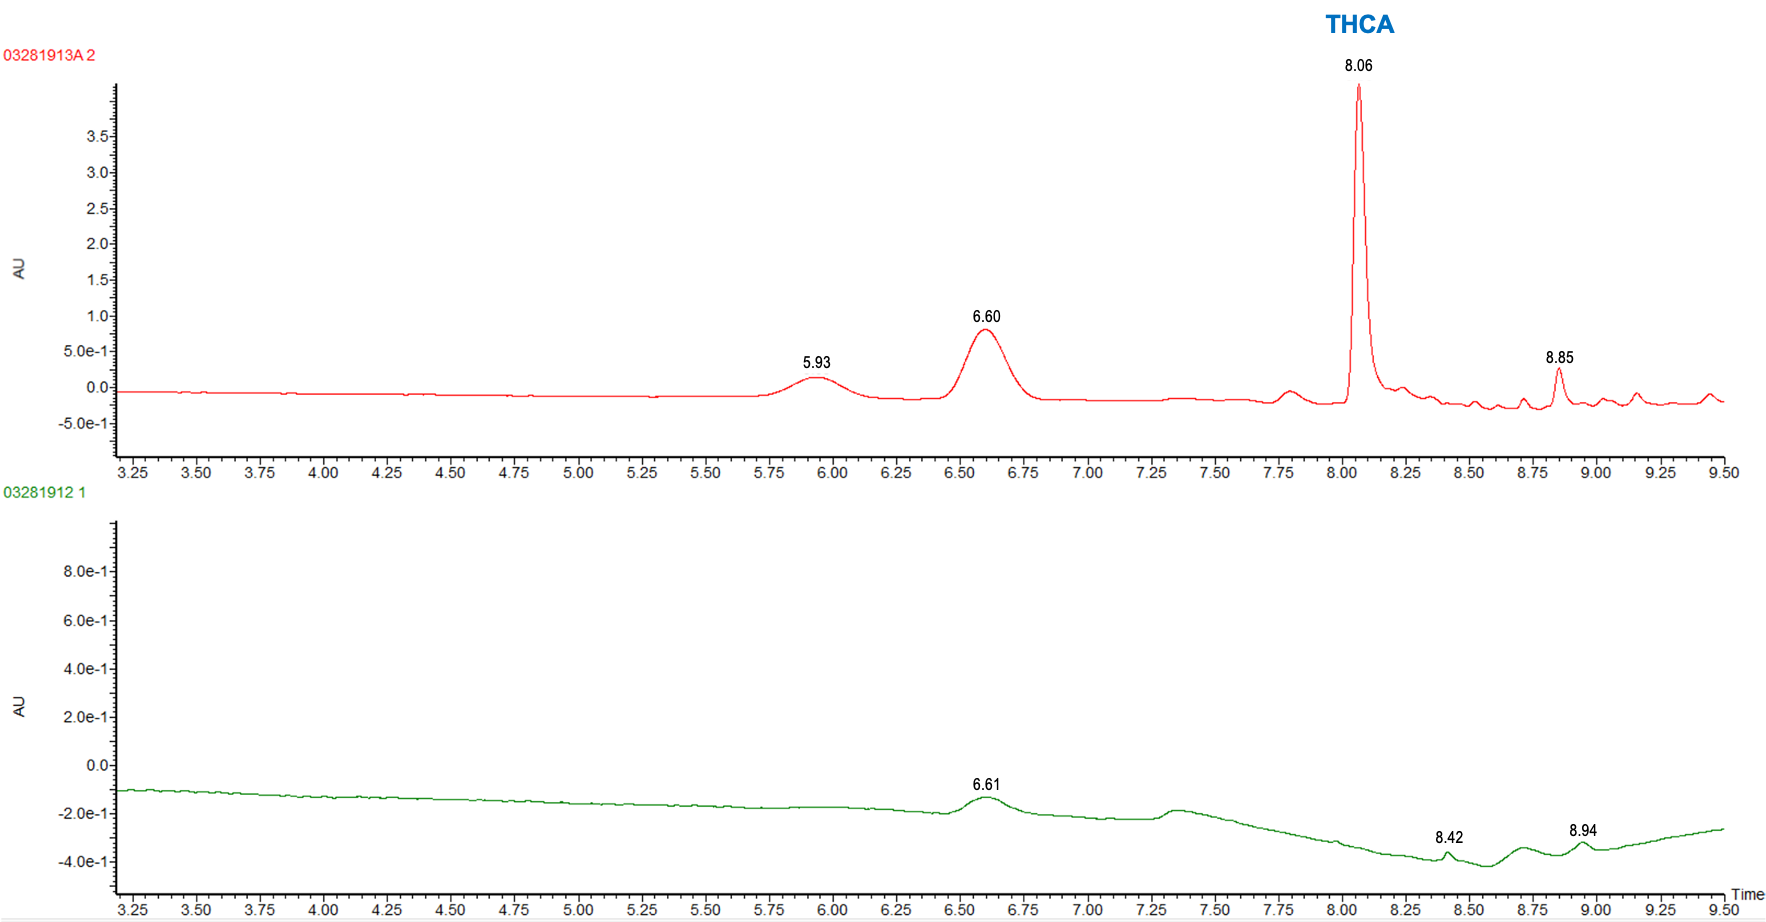
Table 3 shows the % THC and the total THC potency values calculated for the same flower samples that went through all four various potency sample preparation techniques as described earlier. Figure 3 also provides LC chromatograms for flower sample 03281913A-2 and edible sample 03281912-1.

Table 3-THC and Total THC potency values for the same cannabis flower sample processed through the combination of extractions and cleanups.
Figure 3: Potency/Cannabinoid analysis chromatogram for flower sample 03281913A-2 (red trace) and edible sample 03281912-1 (green trace).

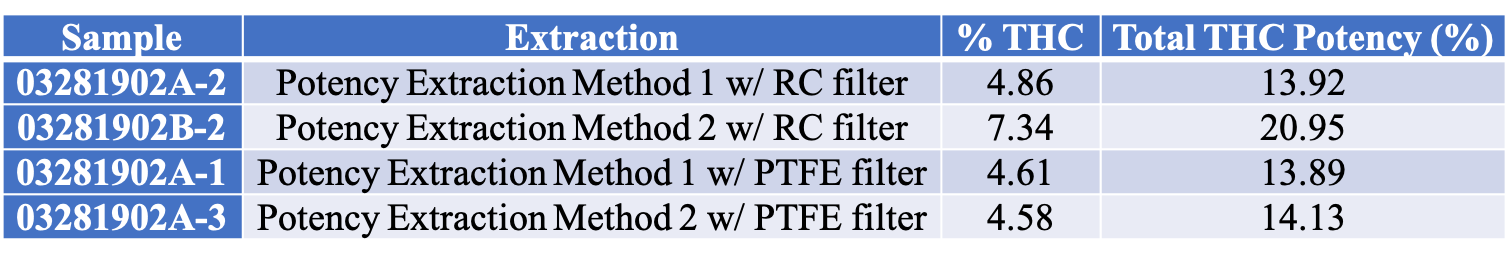
The results indicated that with the “Potency Extraction Method 2” (ACN/QuEChERS extraction) coupled with the RC filter provided a bias of 7.29 % greater for total THC % over the other extraction techniques. Since the other 3 techniques provided total THC values within 2% of each other, the total THC of the sample is more likely ~14%.

Since the sample dilution for the above data set reduced the CBD content, an undiluted sample was run and analyzed. This data is reported in Table 4.

Table 4- CBD and Total CBD potency values for the same cannabis flower sample processed through different sample preparation techniques.

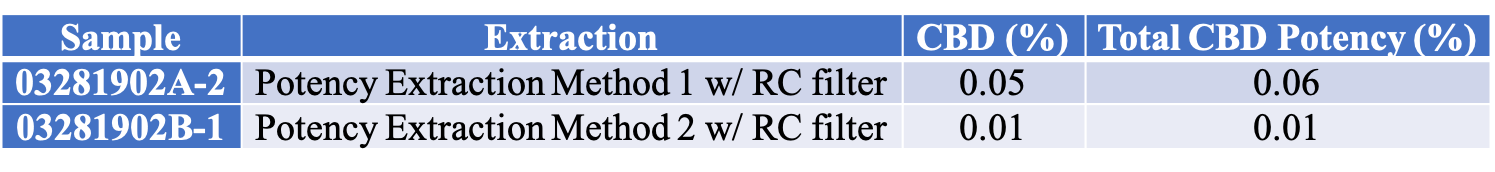
The CBD results indicated that with the “Potency Extraction Method 1” (methanol extraction) coupled with RC filter, allowed for a greater CBD recovery. This may indicate the loss of CBD with an ACN/QuEChERS extraction.

With an average ~14% total THC and 0.06% total CBD for a homogenous cannabis flower sample, the optimal sample preparation extraction was determined to be a methanol extraction coupled with filtration using a regenerated cellulose filter. Since potency continues to remain at the forefront of cannabis regulatory testing it is important to utilize the right sample prep for your cannabis samples.


References

  1. Wang M, Wang YH, Avula B, Radwan MM, Wanas AS, Mehmedic Z, et al. Quantitative Determination of Cannabinoids in Cannabis and Cannabis Products Using Ultra-High-Performance Supercritical Fluid Chromatography and Diode Array/Mass Spectrometric Detection. Journal of Forensic Sciences 2016;62(3):602-11.
  2. Matthew Curtis, Eric Fausett, Wendi A. Hale, Ron Honnold, Jessica Westland, Peter J. Stone, Jeffery S. Hollis, Anthony Macherone. Cannabis Science and Technology, September/October 2019, Volume 2, Issue 5.
  3. Sian Ferguson. https://www.healthline.com/health/hemp-vs-marijuana. August 27, 2020.
  4. Taschwer M, Schmid MG. Determination of the relative percentage distribution of THCA and 9-THC in herbal cannabis seized in Austria- Impact of different storage temperatures on stability. Forensic Science International 2015; 254:167-71.
  5. Beadle A. CBDA Vs CBD: What are the differences? [Internet]. Analytical Cannabis. 2019 [cited 2020 Apr 22]; https://www.analyticalcannabis.com/articles/cbda-vs-cbd-what-are-the-differences-312019.
  6. Storm C, Zumwalt M, Macherone A. Dedicated Cannabinoid Potency Testing Using the Agilent 1220 Infinity II LC System. Agilent Technologies, Inc. Application Note 5991-9285EN

ISO/IEC 17025 Accreditation Falls Short for Cannabis Testing Laboratories

By Kathleen May
2 Comments

What is the role of the Quality Control (QC) Laboratory?

The Quality Control (QC) laboratory serves as one of the most critical functions in consumer product manufacturing. The QC laboratory has the final say on product release based on adherence to established product specifications. Specifications establish a set of criteria to which a product should conform to be considered acceptable for its intended use. Specifications are proposed, justified and approved as part of an overall strategy to ensure the quality, safety, and consistency of consumer products. Subsequently, the quality of consumer products is determined by design, development, Good Manufacturing Practice (GMP) controls, product and process validations, and the specifications applied throughout product development and manufacturing. These specifications are specifically the validated test methods and procedures and the established acceptance criteria for product release and throughout shelf life/stability studies.

The Code of Federal Regulations, 21 CFR Part 211, Good Manufacturing Practice for Finished Pharmaceuticals, provides the minimum requirements for the manufacture of safe products that are consumed by humans or animals. More specifically, 21 CFR Part 211: Subpart I-Laboratory Controls, outlines the requirements and expectations for the quality control laboratory and drug product testing. Additionally, 21 CFR Part 117, Current Good Manufacturing Practice, Hazard Analysis, and Risk-Based Preventative Controls for Human Food: Subpart B-Processes and Controls states that appropriate QC operations must be implemented to ensure food products are safe for consumption and food packing materials and components are safe and fit for purpose. Both food and drug products must be tested against established specifications to verify quality and safety, and laboratory operations must have the appropriate processes and procedures to support and defend testing results.

ISO/IEC 17025, General Requirements for the Competence of Testing and Calibration Laboratories is used to develop and implement laboratory management systems. Originally known as ISO/IEC Guide 25, first released in 1978, ISO/IEC 17025 was created with the belief that “third party certification systems [for laboratories] should, to the extent possible, be based on internationally agreed standards and procedures”7. National accreditation bodies are responsible for accrediting laboratories to ISO/IEC 17025. Accreditation bodies are responsible for assessing the quality system and technical aspects of a laboratory’s Quality Management System (QMS) to determine compliance to the requirements of ISO/IEC 17025. ISO/IEC 17025 accreditation is pursued by many laboratories as a way to set them apart from competitors. In some cannabis markets accreditation to the standard is mandatory.

The approach to ISO/IEC 17025 accreditation is typically summarizing the standard requirements through the use of a checklist. Documentation is requested and reviewed to determine if what is provided satisfies the item listed on the checklist, which correlate directly to the requirements of the standard. ISO/IEC 17025 covers the requirements for both testing and calibration laboratories. Due to the wide range of testing laboratories, the standard cannot and should not be overly specific on how a laboratory would meet defined requirements. The objective of any laboratory seeking accreditation is to demonstrate they have an established QMS. Equally as critical, for product testing laboratories in particular, is the objective to establish GxP, “good practices”, to ensure test methods and laboratory operations verify product safety and quality. ISO/IEC 17025 provides the baseline, but compliance to Good Laboratory Practice (GLP), Good Manufacturing Practice (GMP) and even Good Safety Practices (GSP) are essential for cannabis testing laboratories to be successful and demonstrate testing data is reliable and accurate.

Where ISO/IEC 17025 accreditation falls short

Adherence to ISO/IEC 17025, and subsequently receiving accreditation, is an excellent way to ensure laboratories have put forth the effort to establish a QMS. However, for product testing laboratories specifically there are a number of “gaps” within the standard and the accreditation process. Below are my “Top Five” that I believe have the greatest impact on a cannabis testing laboratory’s ability to maintain compliance and consistency, verify data integrity and robust testing methods, and ensure the safety of laboratory personnel.

Standard Operating Procedures (SOPs)

The understanding of what qualifies as a Standard Operating Procedure (SOP) is often misunderstood by cannabis operators. An SOP is a stand-alone set of step-by-step instructions which allow workers to consistently carry out routine operations, and documented training on SOPs confirms an employee’s comprehension of their job tasks. Although not required per the current version of the standard, many laboratories develop a Quality Manual (QM). A QM defines an organization’s Quality Policy, Quality Objectives, QMS, and the procedures which support the QMS. It is not an uncommon practice for cannabis laboratories to use the QM as the repository for their “procedures”. The intent of a QM is to be a high-level operations policy document. The QM is NOT a step-by-step procedure, or at least it shouldn’t be.

Test Method Transfer (TMT)

Some cannabis laboratories develop their own test methods, but a common practice in many cannabis laboratories is to purchase equipment from vendors that provide “validated” test methods. Laboratories purchase equipment, install equipment with pre-loaded methods and jump in to testing products. There is no formal verification (what is known as a Test Method Transfer (TMT)) by the laboratory to demonstrate the method validated by the vendor on the vendor’s equipment, with the vendor’s technicians, using the vendor’s standards and reagents, performs the same and generates “valid” results when the method is run on their own equipment, with their own technician(s), and using their own standards and reagents. When discrepancies or variances in results are identified (most likely the result of an inadequate TMT), changes to test methods may be made with no justification or data to support the change, and the subsequent method becomes the “validated” method used for final release testing. The standard requires the laboratory to utilize “validated” methods. Most laboratories can easily provide documentation to meet that requirement. However, there is no verification that the process of either validating in house methods or transferring methods from a vendor were developed using any standard guidance on test method validation to confirm the methods are accurate, precise, robust and repeatable. Subsequently, there is no requirement to define, document, and justify changes to test methods. These requirements are mentioned in ISO/IEC 17025, Step 7.2.2, Validation of Methods, but they are written as “Notes” and not as actual necessities for accreditation acceptance.

Change Control

The standard speaks to identifying “changes” in documents and authorizing changes made to software but the standard, and subsequently the accreditation criteria, is loose on the requirement of a Change Control process and procedure as part of the QMS. The laboratory is not offered any clear instruction of how to manage change control, including specific requirements for making changes to procedures and/or test methods, documented justification of those changes, and the identification of individuals authorized to approve those changes.

Out of Specification (OOS) results

The documentation and management of Out of Specification (OOS) testing results is perhaps one of the most critical liabilities witnessed for cannabis testing laboratories. The standard requires a procedure for “Nonconforming Work”. There is no mention of requiring a root cause investigation, no requirement to document actions, and most importantly there is no requirement to document a retesting plan, including justification for retesting. “Testing into compliance”, as this practice is commonly referred to, was ruled unacceptable by the FDA in the highly publicized 1993 court case United States vs. Barr Laboratories.

Laboratory Safety

FDAlogoSafe laboratory practices are not addressed at all in ISO/IEC 17025. A “Culture of Safety” (as defined by the Occupational Safety and Health Administration (OSHA)) is lacking in most cannabis laboratories. Policies and procedures should be established to define required Personal Protective Equipment (PPE), the safe handling of hazardous materials and spills, and a posted evacuation plan in the event of an emergency. Gas chromatography (GC) is a common test method utilized in an analytical testing laboratory. GC instrumentation requires the use of compressed gas which is commonly supplied in gas cylinders. Proper handling, operation and storage of gas cylinders must be defined. A Preventative Maintenance (PM) schedule should be established for eye wash stations, safety showers and fire extinguishers. Finally, Safety Data Sheets (SDSs) should be printed and maintained as reference for laboratory personnel.

ISO/IEC 17025 accreditation provides an added level of trust, respect and confidence in the eyes of regulators and consumers. However, the current process of accreditation misses the mark on the establishment of GxP, “good practices” into laboratory operations. Based on my experience, there has been some leniency given to cannabis testing laboratories seeking accreditation as they are “new” to standards implementation. In my opinion, this is doing cannabis testing laboratories a disservice and setting them up for failure on future accreditations and potential regulatory inspections. It is essential to provide cannabis testing laboratory owners and operators the proper guidance from the beginning and hold them up to the same rigor and scrutiny as other consumer product testing laboratories. Setting the precedence up front drives uniformity, compliance and standardization into an industry that desperately needs it.


References:

  1. 21 Code of Federal Regulations (CFR) Part 211- Good Manufacturing Practice for Finished Pharmaceuticals.
  2. 21 Code of Federal Regulations (CFR) Part 117;Current Good Manufacturing Practice, Hazard Analysis, and Risk-Based Preventative Controls for Human Food: Subpart B-Processes and Controls.
  3. ICH Q7 Good Manufacturing Practice Guidance for Active Pharmaceutical Ingredients; Laboratory Controls.
  4. World Health Organization (WHO).
  5. International Building Code (IBC).
  6. International Fire Code (IFC).
  7. National Fire Protection Association (NFPA).
  8. Occupational Safety and Health Administration; Laboratories.
  9. ASTM D8244-21; Standard Guide for Analytical Operations Supporting the Cannabis/Hemp Industry.
  10. org; ISO/IEC 17025.

Top 10 Common Findings Detected During Cannabis Laboratory Assessments: A Guide to Assist with Accreditation

By Tracy Szerszen
No Comments

With the cannabis industry growing rapidly, laboratories are adapting to the new market demand for medical cannabis testing in accordance to ISO/IEC 17025. Third-party accreditation bodies, such as Perry Johnson Laboratory Accreditation, Inc. (PJLA), conduct these assessments to determine that laboratories are following relevant medical cannabis testing standard protocols in order to detect potency and contaminant levels in cannabis. Additionally, laboratories are required to implement and maintain a quality management system throughout their facility. Obtaining accreditation is a challenge for laboratories initially going through the process. There are many requirements outlined in the standard that laboratories must adhere to in order to obtain a final certificate of accreditation. Laboratories should evaluate the ISO 17025 standard thoroughly, receive adequate training, implement the standard within their facility and conduct an internal audit in order to prepare for a third-party assessment. Being prepared will ultimately reduce the number of findings detected during the on-site assessment. Listed below is research and evidence gathered by PJLA to determine the top ten findings by clause specifically in relation to cannabis testing laboratories.

PJLA chart
The top 10 findings by clause

4.2: Management System

  • Defined roles and responsibilities of management system and its quality policies, including a structured outline of supporting procedures, requirements of the policy statement and establishment of objectives.
  • Providing evidence of establishing the development, implementation and maintenance of the management system appropriate to the scope of activities and the continuous improvement of its effectiveness.
  • Ensuring the integrity of the management system during planned and implemented changes.
  • Communication from management of the importance of meeting customer, statutory and regulatory requirements

4.3: Document Control

  • Establishing and maintaining procedures to control all documents that form the management system.
  • The review of document approvals, issuance and changes.

4.6: Purchasing Services and Supplies

  • Policies and procedures for the selection and purchasing of services and supplies, inspection and verification of services and supplies
  • Review and approval of purchasing documents containing data describing the services and supplies ordered
  • Maintaining records for the evaluation of suppliers of critical consumables, supplies and services, which affect the quality of laboratory outputs.

4.13: Control of Records

  • Establishing and maintaining procedures for identification, collection, indexing, access, filing, storage and disposal of quality and technical records.
  • Providing procedures to protect and back-up records stored electronically and to prevent unauthorized access.

4.14: Internal Audits

  • Having a predetermined schedule and procedure for conducting internal audits of its activities and that addresses all elements that verify its compliance of its established management system and ISO/IEC 17025
  • Completing and recording corrective actions arising from internal audits in a timely manner, follow-up activities of implementation and verification of effectiveness of corrective actions taken.

5.2: Personnel

  • Laboratory management not ensuring the competence and qualifications of all personnel who operate specific equipment, perform tests, evaluate test results and sign test reports. Lack of personnel undergoing training and providing appropriate supervision
  • Providing a training program policies and procedures for an effective training program that is appropriate; identification and review of training needs and the program’s effectiveness to demonstrate competence.
  • Lack of maintaining records of training actions taken, current job descriptions for managerial, technical and key support personnel involved in testing

5.4: Test and Calibration Methods and Method Validation

  • Utilization of appropriate laboratory methods and procedures for all testing within the labs scope; including sampling, handling, transport, storage and preparation of items being tested, and where appropriate, a procedure for an estimation of the measurement of uncertainty and statistical techniques for analysis
  • Up-to-date instructions on the use and operation of all relevant equipment, and on the handling and preparation of items for testing
  • Introduction laboratory-developed and non-standard methods and developing procedures prior to implementation.
  • Validating non-standard methods in accordance with the standard
  • Not completing appropriate checks in a systematic manner for calculations and data transfers

5.6: Measurement Traceability

  • Ensuring that equipment used has the associated measurement uncertainty needed for traceability of measurements to SI units or certified reference materials and completing intermediate checks needed according to a defined procedure and schedules.
  • Not having procedures for safe handling, transport, storage and use of reference standards and materials that prevent contamination or deterioration of its integrity.

5.10: Reporting the Results

  • Test reports not meeting the standard requirements, statements of compliance with accounting for uncertainty, not providing evidence for measurement traceability, inaccurately amending reports.

SOP-3: Use of the Logo

  • Inappropriate use of PJLA’s logo on the laboratories test reports and/or website.
  • Using the incorrect logo for the testing laboratory or using the logo without prior approval from PJLA.
control the room environment

Environmental Controls: The Basics

By Vince Sebald
No Comments
control the room environment

The outside environment can vary widely depending on where your facility is located. However, the internal environment around any activity can have an effect on that activity and any personnel performing the activity, whether that’s storage, manufacturing, testing, office work, etc. These effects can, in turn, affect the product of such activities. Environmental control strategies aim to ensure that the environment supports efforts to keep product quality high in a manner that is economical and sensible, regardless of the outside weather conditions.

For this article, let us define the “environment” as characteristics related to the room air in which an activity is performed, setting aside construction and procedural conditions that may also affect the activity. Also, let us leave the issue of managing toxins or potent compounds for another time (as well as lighting, noise, vibration, air flow, differential pressures, etc). The intent here is to focus on the basics: temperature, humidity and a little bit on particulate counts.

Temperature and humidity are key because a non-suitable environment can result in the following problems:

  • Operator discomfort
  • Increased operator error
  • Difficulty in managing products (e.g. powders, capsules, etc)
  • Particulate generation
  • Degradation of raw materials
  • Product contamination
  • Product degradation
  • Microbial and mold growth
  • Excessive static

USP <659> “Packaging and Storage Requirements” identifies room temperature as 20-25°C (68-77 °F) and is often used as a guideline for operations. If gowning is required, the temperature may be reduced to improve operator comfort. This is a good guide for human working areas. For areas that require other specific temperatures (e.g. refrigerated storage for raw materials), the temperature of the area should be set to those requirements.

Humidity can affect activities at the high end by allowing mold growth and at the low end by increasing static. Some products (or packaging materials) are hydroscopic, and will take on water from a humid environment. Working with particular products (e.g. powders) can also drive the requirement for better humidity control, since some powders become difficult to manage in either high or low humidity environments. For human operations without other constraints, a typical range for desirable humidity is in the range of 20 to 70% RH in manufacturing areas, allowing for occasional excursions above. As in the case of temperature, other requirements may dictate a different range.

control the room environment
In some cases, a locally controlled environment is a good option to reduce the need to control the room environment as tightly or to protect the operator.

In a typical work environment, it is often sufficient to control the temperature, while allowing the relative humidity to vary. If the humidity does not exceed the limits for the activity, then this approach is preferred, because controlling humidity adds a level of complexity (and cost) to the air handling. If humidity control is required, it can be managed by adding moisture via various humidification systems, or cooling/reheating air to remove moisture. When very low humidity is required, special equipment such as a desiccant system may be required. It should be noted that although you can save money by not implementing humidity control at the beginning, retrofitting your system for humidity control at a later time can be expensive and require a shutdown of the facility.

Good engineering practice can help prevent issues that may be caused by activities performed in inappropriately controlled environments. The following steps can help manage the process:

  • Plan your operations throughout your facility, taking into account the requirements for the temperature and humidity in each area and know what activities are most sensitive to the environment. Plans can change, so plan for contingencies whenever possible.
  • Write down your requirements in a User Requirement Specification (URS) to a level of detail that is sufficient for you to test against once the system is built. This should include specific temperature and RH ranges. You may have additional requirements. Don’t forget to include requirements for instrumentation that will allow you to monitor the temperature and RH of critical areas. This instrumentation should be calibrated.
  • Solicit and select proposals for work based on the URS that you have generated. The contractor will understand the weather in the area and can ensure that the system can meet your requirements. A good contractor can also further assist with other topics that are not within the scope of this article (particulates, differential pressures, managing heating or humidity generating equipment effects, etc).
  • Once work is completed, verify correct operation using the calibrated instrumentation provided, and make sure you add periodic calibration of critical equipment, as well as maintenance of your mechanical system(s), to your calibration and maintenance schedules, to keep everything running smoothly.

The main point is if you plan your facility and know your requirements, then you can avoid significant problems down the road as your company grows and activity in various areas increases. Chances are that a typical facility may not meet your particular requirements, and finding that out after you are operational can take away from your vacation time and peace of mind. Consider the environment, its good business!

VinceSebald

Maintenance and Calibration: Your Customers Are Worth It!

By Vince Sebald
No Comments
VinceSebald

Ultimately, the goal of any good company is to take care of their customers by providing a quality product at a competitive price. You take the time to use good practices in sourcing raw materials, processing, testing and packaging to make sure you have a great final product. Yet in practice, sometimes the product can degrade over time, or you find yourself facing costly manufacturing stoppages and repairs due to downed equipment or instrumentation. This can harm your company’s reputation and result in real, negative effects on your bottom line.

One thing you can do to prevent this problem is to have a properly scaled calibration and maintenance program for your organization.

First, a short discussion of terms:

Balance Calibration
Figure 1– Periodic calibration of an electronic balance performed using traceable standard weights helps to ensure that the balance remains within acceptable operating ranges during use and helps identify problems.

Calibration, in the context of this article, refers to the comparison of the unit under test (your equipment) to a standard value that is known to be accurate. Equipment readings often drift over time due to various reasons and may also be affected by damage to the equipment. Periodic calibration allows the user to determine if the unit under test (UUT) is sufficiently accurate to continue using it. In some cases, the UUT may require adjustment or may not be adjustable and should no longer be used.

Maintenance, in the context of this article, refers to work performed to maximize the performance of equipment and support a long life span for the equipment. This may include lubrication, adjustments, replacement of worn parts, etc. This is intended to extend the usable life of the equipment and the consistency of the quality of the work performed by the equipment.

There are several elements to putting together such a program that can help you to direct your resources where they will have the greatest benefit. The following are some key ingredients for a solid program:

Keep it Simple: The key is to scale it to your operation. Focus on the most important items if resources are strained. A simple program that is followed and that you can defend is much better than a program where you can never catch up.

Written Program: Your calibration and maintenance programs should be written and they should be approved by quality assurance (QA). Any program should include the following: 

  • Equipment Assessment and Identification: Assess each piece of equipment or instrument to determine if it is important enough to be calibrated and/or requires maintenance. You will probably find much of your instrumentation is not used for a critical purpose and can be designated as non-calibrated. Each item should have an ID assigned to allow tracking of the maintenance and/or calibration status.
  • Scheduling System: There needs to be some way to schedule when equipment is due for calibration or maintenance. This way it is easy to stay on top of it. A good scheduling system will pay for itself over time and be easy to use and maintain. A web-based system is a good choice for small to mid-sized companies.
  • Calibration Tolerance Assignment: If you decide to calibrate an instrument, consider what kind of accuracy you actually need from the equipment/instrument. This is a separate discussion on its own, but common rule of thumb is that the instrument should be at least 4 times more accurate than your specification. For very important instruments, it may require spending the money to get a better device.
  • Calibration and Maintenance Interval Assignments: Consider what interval you are going to perform maintenance for each equipment item. Manufacturer recommendations are based on certain conditions. If you use the equipment more or less often than “normal” use, consider adjusting the interval between calibrations or maintenance. 
  • OOT Management: If you do get an Out of Tolerance (OOT) result during a calibration and you find that the instrument isn’t as accurate as you need. Congratulations! You just kept it from getting worse. Review the history and see if this may have had an effect since the last passing calibration, adjust or replace the instrument, take any other necessary corrective actions, and keep it up.

    Maintenance with Checklist
    Figure 2- Maintenance engineers help keep your systems running smoothly and within specification for a long, trouble-free life.
  • Training: Make sure personnel that use the equipment are trained on its use and not to use equipment that is not calibrated for critical measurements. Also, anyone performing calibration and/or maintenance should be qualified to do so. It is best to put a program in place as soon as you start acquiring significant equipment so that you can keep things running smoothly, avoid costly repairs and quality control problems. Don’t fall into the trap of assuming equipment will keep running just because it has run flawlessly for months or years. There are many bad results that can come of mismanaged calibration and/or maintenance including the following:
  • Unscheduled Downtime/Damage/Repairs: A critical piece of equipment goes down. Production stops, and you are forced to schedule repairs as soon as possible. You pay premium prices for parts and labor, because it is an urgent need. Some parts may have long lead times, or not be available. You may suffer reputational costs with customers waiting for delivery. Some calibration issues could potentially affect operator safety as well.
  • Out of Specification Product: Quality control may indicate that product is not maintaining its historically high quality. If you have no calibration and maintenance program in place, tracking down the problem is even more difficult because you don’t have confidence in the readings that may be indicating that there is a problem.
  • Root Cause Analysis: Suppose you find product that is out of specification and you are trying to determine the cause. If there is no calibration and maintenance program in place, it is far more difficult to pinpoint changes that may have affected your production system. This can cause a very significant impact on your ability to correct the problem and regain your historical quality standards of production.

A solid calibration and maintenance program can go a long way to keeping your production lines and quality testing “boring”, without any surprises or suspense, and can allow you to put more sophisticated quality control systems in place. Alternatively, an inappropriate system can bog you down with paperwork, delays, unpredictable performance, and a host of other problems. Take care of your equipment and relax, knowing your customers will be happy with the consistent quality that they have become accustomed to.

amandarigdon
The Practical Chemist

Internal Standards– Turning Good Data Into Great Data

By Amanda Rigdon
2 Comments
amandarigdon

Everyone likes to have a safety net, and scientists are no different. This month I will be discussing internal standards and how we can use them not only to improve the quality of our data, but also give us some ‘wiggle room’ when it comes to variation in sample preparation. Internal standards are widely used in every type of chromatographic analysis, so it is not surprising that their use also applies to common cannabis analyses. In my last article, I wrapped up our discussion of calibration and why it is absolutely necessary for generating valid data. If our calibration is not valid, then the label information that the cannabis consumer sees will not be valid either. These consumers are making decisions based on that data, and for the medical cannabis patient, valid data is absolutely critical. Internal standards work with calibration curves to further improve data quality, and luckily it is very easy to use them.

So what are internal standards? In a nutshell, they are non-analyte compounds used to compensate for method variations. An internal standard can be added either at the very beginning of our process to compensate for variations in sample prep and instrument variation, or at the very end to compensate only for instrument variation. Internal standards are also called ‘surrogates’, in some cases, however, for the purposes of this article, I will simply use the term ‘internal standard.’

Now that we know what internal standards are, lets look at how to use them. We use an internal standard by adding it to all samples, blanks, and calibrators at the same known concentration. By doing this, we now have a single reference concentration for all response values produced by our instrument. We can use this reference concentration to normalize variations in sample preparation and instrument response. This becomes very important for cannabis pesticide analyses that involve lots of sample prep and MS detectors. Figure 1 shows a calibration curve plotted as we saw in the last article (blue diamonds), as well as the response for an internal standard added to each calibrator at a level of 200ppm (green circles). Additionally, we have three sample results (red triangles) plotted against the calibration curve with their own internal standard responses (green Xs).

Figure 1: Calibration Curve with Internal Standard Responses and Three Sample Results

In this case, our calibration curve is beautiful and passes all of the criteria we discussed in the previous article. Lets assume that the results we calculate for our samples are valid – 41ppm, 303ppm, and 14ppm. Additionally, we can see that the responses for our internal standards make a flat line across the calibration range because they are present at the same concentration in each sample and calibrator. This illustrates what to expect when all of our calibrators and samples were prepared correctly and the instrument performed as expected. But lets assume we’re having one of those days where everything goes wrong, such as:

  • We unknowingly added only half the volume required for cleanup for one of the samples
  • The autosampler on the instrument was having problems and injected the incorrect amount for the other two samples

Figure 2 shows what our data would look like on our bad day.

Figure 2: Calibration Curve with Internal Standard Responses and Three Sample Results after Method Errors

We experienced no problems with our calibration curve (which is common when using solvent standard curves), therefore based on what we’ve learned so far, we would simply move on and calculate our sample results. The sample results this time are quite different: 26ppm, 120ppm, and 19ppm. What if these results are for a pesticide with a regulatory cutoff of 200ppm? When measured accurately, the concentration of sample 2 is 303ppm. In this example, we may have unknowingly passed a contaminated product on to consumers.

In the first two examples, we haven’t been using our internal standard – we’ve only been plotting its response. In order to use the internal standard, we need to change our calibration method. Instead of plotting the response of our analyte of interest versus its concentration, we plot our response ratio (analyte response/internal standard response) versus our concentration ratio (analyte concentration/internal standard concentration). Table 1 shows the analyte and internal standard response values for our calibrators and samples from Figure 2.


Table 1: Values for Calibration Curve and Samples Using Internal Standard

The values highlighted in green are what we will use to build our calibration curve, and the values in blue are what we will use to calculate our sample concentration. Figure 3 shows what the resulting calibration curve and sample points will look like using an internal standard.

Figure 3: Calibration Curve and Sample Results Calculated Using Internal Standard Correction

We can see that our axes have changed for our calibration curve, so the results that we calculate from the curve will be in terms of concentration ratio. We calculate these results the same way we did in the previous article, but instead of concentrations, we end up with concentration ratios. To calculate the sample concentration, simply multiply by the internal standard amount (200ppm). Figure 4 shows an example calculation for our lowest concentration sample.

Figure 4: Example Calculation for Sample Results for Internal-Standard Corrected Curve

Using the calculation shown in Figure 4, our sample results come out to be 41ppm, 302ppm, and 14ppm, which are accurate based on the example in Figure 1. Our internal standards have corrected the variation in our method because they are subjected to that same variation.

As always, there’s a lot more I can talk about on this topic, but I hope this was a good introduction to the use of internal standards. I’ve listed couple of resources below with some good information on the use of internal standards. If you have any questions on this topic, please feel free to contact me at amanda.rigdon@restek.com.


Resources:

When to use an internal standard: http://www.chromatographyonline.com/when-should-internal-standard-be-used-0

Choosing an internal standard: http://blog.restek.com/?p=17050

amandarigdon
The Practical Chemist

Calibration Part II – Evaluating Your Curves

By Amanda Rigdon
No Comments
amandarigdon

Despite the title, this article is not about weight loss – it is about generating valid analytical data for quantitative analyses. In the last installment of The Practical Chemist, I introduced instrument calibration and covered a few ways we can calibrate our instruments. Just because we have run several standards across a range of concentrations and plotted a curve using the resulting data, it does not mean our curve accurately represents our instrument’s response across that concentration range. In order to be able to claim that our calibration curve accurately represents our instrument response, we have to take a look at a couple of quality indicators for our curve data:

  1. correlation coefficient (r) or coefficient of determination (r2)
  2. back-calculated accuracy (reported as % error)

The r or r2 values that accompany our calibration curve are measurements of how closely our curve matches the data we have generated. The closer the values are to 1.00, the more accurately our curve represents our detector response. Generally, r values ≥0.995 and r2 values ≥ 0.990 are considered ‘good’. Figure 1 shows a few representative curves, their associated data, and r2 values (concentration and response units are arbitrary).

Figure 1: Representative Curves and r2 values

Let’s take a closer look at these curves:

Curve A: This represents a case where the curve perfectly matches the instrument data, meaning our calculated unknown values will be accurate across the entire calibration range.

Curve B: The r2 value is good and visually the curve matches most of the data points pretty well. However, if we look at our two highest calibration points, we can see that they do not match the trend for the rest of the data; the response values should be closer to 1250 and 2500. The fact that they are much lower than they should be could indicate that we are starting to overload our detector at higher calibration levels; we are putting more mass of analyte into the detector than it can reliably detect. This is a common problem when dealing with concentrated samples, so it can occur especially for potency analyses.

Curve C: We can see that although our r2 value is still okay, we are not detecting analytes as we should at the low end of our curve. In fact, at our lowest calibration level, the instrument is not detecting anything at all (0 response at the lowest point). This is a common problem with residual solvent and pesticide analyses where detection levels for some compounds like benzene are very low.

Curve D: It is a perfect example of our curve not representing our instrument response at all. A curve like this indicates a possible problem with the instrument or sample preparation.

So even if our curve looks good, we could be generating inaccurate results for some samples. This brings us to another measure of curve fitness: back-calculated accuracy (expressed as % error). This is an easy way to determine how accurate your results will be without performing a single additional run.

Back-calculated accuracy simply plugs the area values we obtained from our calibrators back into the calibration curve to see how well our curve will calculate these values in relation to the known value. We can do this by reprocessing our calibrators as unknowns or by hand. As an example, let’s back-calculate the concentration of our 500 level calibrator from Curve B. The formula for that curve is: y = 3.543x + 52.805. If we plug 1800 in for y and solve for x, we end up with a calculated concentration of 493. To calculate the error of our calculated value versus the true value, we can use the equation: % Error = [(calculated value – true value)/true value] * 100. This gives us a % error of -1.4%. Acceptable % error values are usually ±15 – 20% depending on analysis type. Let’s see what the % error values are for the curves shown in Figure 1.

practical chemist table 1
Table 1: % Error for Back-Calculated Values for Curves A – D

Our % error values have told us what our r2 values could not. We knew Curve D was unacceptable, but now we can see that Curves B and C will yield inaccurate results for all but the highest levels of analyte – even though the results were skewed at opposite ends of the curves.

There are many more details regarding generating calibration curves and measuring their quality that I did not have room to mention here. Hopefully, these two articles have given you some tools to use in your lab to quickly and easily improve the quality of your data. If you would like to learn more about this topic or have any questions, please don’t hesitate to contact me at amanda.rigdon@restek.com.

The Practical Chemist

Calibration – The Foundation of Quality Data

By Amanda Rigdon
1 Comment

This column is devoted to helping cannabis analytical labs generate valid data right now with a relatively small amount of additional work. The topic for this article is instrument calibration – truly the foundation of all quality data. Calibration is the basis for all measurement, and it is absolutely necessary for quantitative cannabis analyses including potency, residual solvents, terpenes, and pesticides.

Just like a simple alarm clock, all analytical instruments – no matter how high-tech – will not function properly unless they are calibrated. When we set our alarm clock to 6AM, that alarm clock will sound reproducibly every 24 hours when it reads 6AM, but unless we set the correct current time on the clock based on some known reference, we can’t be sure when exactly the alarm will sound. Analytical instruments are the same. Unless we calibrate the instrument’s signal (the response) from the detector to a known amount of reference material, the instrument will not generate an accurate or valid result.

Without calibration, our result may be reproducible – just like in our alarm clock example – but the result will have no meaning unless the result is calibrated against a known reference. Every instrument that makes a quantitative measurement must be calibrated in order for that measurement to be valid. Luckily, the principle for calibration of chromatographic instruments is the same regardless of detector or technique (GC or LC).

Before we get into the details, I would like to introduce one key concept:

Every calibration curve for chromatographic analyses is expressed in terms of response and concentration. For every detector the relationship between analyte (e.g. a compound we’re analyzing) concentration and response is expressible mathematically – often a linear relationship.

Now that we’ve introduced the key concept behind calibration, let’s talk about the two most common and applicable calibration options.

Single Point Calibration

This is the simplest calibration option. Essentially, we run one known reference concentration (the calibrator) and calculate our sample concentrations based on this single point. Using this method, our curve is defined by two points: our single reference point, and zero. That gives us a nice, straight line defining the relationship between our instrument response and our analyte concentration all the way from zero to infinity. If only things were this easy. There are two fatal flaws of single point calibrations:

  1. We assume a linear detector response across all possible concentrations
  2. We assume at any concentration greater than zero, our response will be greater than zero

Assumption #1 is never true, and assumption #2 is rarely true. Generally, single point calibration curves are used to conduct pass/fail tests where there is a maximum limit for analytes (i.e. residual solvents or pesticide screening). Usually, quantitative values are not reported based on single point calibrations. Instead, reports are generated in relation to our calibrator, which is prepared at a known concentration relating to a regulatory limit, or the instrument’s LOD. Using this calibration method, we can accurately report that the sample contains less than or greater than the regulatory limit of an analyte, but we cannot report exactly how much of the analyte is present. So how can we extend the accuracy range of a calibration curve in order to report quantitative values? The answer to this question brings us to the other common type of calibration curve.

Multi-Point Calibration:

A multi-point calibration curve is the most common type used for quantitative analyses (e.g. analyses where we report a number). This type of curve contains several calibrators (at least 3) prepared over a range of concentrations. This gives us a calibration curve (sometimes a line) defined by several known references, which more accurately expresses the response/concentration relationship of our detector for that analyte. When preparing a multi-point calibration curve, we must be sure to bracket the expected concentration range of our analytes of interest, because once our sample response values move outside the calibration range, the results calculated from the curve are not generally considered quantitative.

The figure below illustrates both kinds of calibration curves, as well as their usable accuracy range:

Calibration Figure 1

This article provides an overview of the two most commonly used types of calibration curves, and discusses how they can be appropriately used to report data. There are two other important topics that were not covered in this article concerning calibration curves: 1) how can we tell whether or not our calibration curve is ‘good’ and 2) calibrations aren’t permanent – instruments must be periodically re-calibrated. In my next article, I’ll cover these two topics to round out our general discussion of calibration – the basis for all measurement. If you have any questions about this article or would like further details on the topic presented here, please feel free to contact me at amanda.rigdon@restek.com.