Tag Archives: data

Consumer Education: Transparency is King

By Gabrielle Wesseldyk
2 Comments

Making Cannabis Transparent: The Future of the Industry is Information and Data

The last decade has been marked by great strides in the cannabis industry, as public awareness surrounding the health benefits of marijuana-infused products has spread and products have become increasingly well researched and scientifically advanced. Despite this significant progress, however, cannabis legislation and regulations continue to vary widely between states, ultimately contributing to a lack of clarity within the industry.

This issue was at the forefront of the DispensaryNext Conference and Expo agenda held in Denver a few weeks ago. During the expo’s Consumer Safety and Education discussion, a panel of industry leaders including Kevin Gallagher, director of compliance and government affairs at Craft Concentrates and executive director of the Cannabis Business Alliance (CBA); Eileen Konieczny, registered nurse and president of the American Cannabis Nurses Association; Kevin Staunton, director of business development at RM3 labs; and moderator David Kotler, a partner at Cohen Kotler P.A., highlighted a number of important issues for cannabis patients and adult-use consumers, as well as what’s next for physicians, testing labs and dispensaries across the industry. A number of common themes resonated in their discussion of opportunities and challenges, ultimately pointing to a need for increased research and data, and most notably, a growing demand for transparency industry-wide.

Medical practitioners and dispensary technicians need qualified and legitimate information.

Konieczny opened by stressing that the industry must stop calling dispensary sales associates “budtenders.” “I prefer the term ‘dispensary technician.’ These are knowledgeable people who are on the front lines, helping patients understand the products available to them. They deserve a title to reflect that our industry and their knowledge is much more than ‘bud,’” says Konieczny.

These are knowledgeable people who are on the front lines, helping patients understand the products available to them. The most prominent information gaps in the industry lie at the level of dispensary technicians and medical practitioners. The ideal scenario for patients who are looking to use cannabis as medicine is that their medical practitioner is educated about the endocannabinoid system and that the products are available locally so that a treatment plan can be developed based on their needs. But the reality is that many patients enter their local dispensary without much knowledge or support at all, relying on the professionalism of the dispensary staff to help them navigate the dizzying array of products.

Putting the patient’s safety and success first, it is imperative that everyone involved has the proper data and information to make the best choices. However, dispensary technicians should be extremely careful to avoid making health or benefit claims. As Gallagher noted, “It is not only illegal, but also unethical to make medical claims as a dispenser. There is a difference between a claim and a personal experience. A dispenser can tell their customer that a certain strain helped them personally, but they cannot tell the customer that the strain will cure their specific ailment.”

The industry needs transparency.

New cannabis consumers may have a certain degree of misunderstanding of the products they are consuming and unfortunately, manufacturers do not offer a high level of transparency in disclosing ingredients, thereby preventing these customers from becoming better informed.

While educating the public is essential, educating the industry is of equal importance.Furthermore, labels often contain small barely legible type, along with confusing and unnecessary content. According to Gallagher, the labels need to be simpler. “Products are overloaded with redundant, confusing language that most consumers don’t understand. This turns them off—especially if they’re inexperienced in this realm,” says Gallagher. When customers who are new to cannabis find products off-putting, it hurts not only the industry, but also their own health. Ill-informed consumers may have trouble understanding how cannabis can help them, and therefore they can miss the benefits it provides.

While these issues are prevalent, there are many ways they can be resolved—with transparency at the core.

Research is critical and paramount.

For cultivators or manufacturers, research and data hold the key to attracting new consumers. By providing details about what is in a product and implementing certifications to show the product is contaminant-free, manufacturers are able to provide transparency and offer differentiation.

During the panel, Konieczny pointed out another common mistake that many manufacturers make—not sharing test results. “Not many are posting their test results, and yet this is one of the leading avenues that can increase revenue,” says Konieczny. “Most people just want to feel well again, so providing test results adds a layer of legitimacy for patients who are wary to try a new product.”

With all of this in mind, it is perhaps most important to consider the way that this information is conveyed. Facts and research are useless if they are not accessible to consumers, who may not comprehend complex data. “We need to present information in plain language, keeping it clear and simple to understand,” expressed Konieczny. The simpler the delivery, the better it will be understood and knowledge is a very powerful tool for patients, consumers and the bottom line.

Educating the educators.

While educating the public is essential, educating the industry is of equal importance. For instance, thoroughly training dispensary technicians to ask the correct questions and identify first-time users will ensure consumer safety while avoiding improper use.

The industry as a whole depends on transparencyEducating professionals on better product labeling is another critical way that the industry is working to improve itself. There has recently been a push at the manufacturing level for standardization in product labeling, as establishing a clear standard can aid customers in successfully using cannabis. “In working groups with Colorado’s MED (Marijuana Enforcement Division), we aim to standardize specific product categories, remove irrelevant names, and harmonize medical and retail labeling regulations,” says Gallagher. “Ultimately, we want to consolidate language and make it more transparent in promoting public health and safety so that it can be easily read and understood.”

All panelists agreed transparency is paramount for the future of the cannabis industry and for growing a brand. Using lab data can provide value, setting a brand apart and building loyalty among consumers looking for someone they can trust.

“Transparency is king,” Gallagher urges. “The more we educate consumers and professionals, the more clarity we will see at all levels, ultimately minimizing risk and creating greater demand among those consumers. The industry as a whole depends on transparency.”

How Science Is Going To Save Your Cannabis Business

By Kay Smythe
2 Comments

Marketing cannabis and the products that accompany recreational use is set to become one of the biggest industries in the United States. With 29 states promoting legal medical cannabis, 14 with it decriminalized and 8 having legalized it completely, you might be thinking this will be the easiest ad-campaign of all time. Unfortunately, science suggests otherwise.

The Science of Marketing

You heard correctly, marketing is a science, but almost half of what we know about the process cannot be applied to cannabis. Why? Because cannabis lives in the grey area of the American psyche. How do I know this?

Science.

In 2015, I completed and published The Safe Haven theory, a socio-demographic linguistic analysis of attitudes toward recreational drug use in the United Kingdom. I won’t bore you with the intricacies of the study, but the findings are important.

The study, using theoretical sociological trends, found that even non-recreational drug users in the United Kingdom favor cannabis legalization. A great number of police jurisdictions have chosen to not longer punish cannabis users, meaning that the law is (mostly) on our side – the side of full legalization and taxation of cannabis as a product for recreational usage, not so dissimilar from alcohol.

In the UK, we could easily put a huge billboard of someone’s grandmother smoking a spliff and make a million on the first day.

Unfortunately, the same can’t be done in the United States.

Advertising law aside, Americans just don’t have the same view of cannabis as Brits. In the last two years, I applied the same framework to a host of American demographics, and – as I hypothesized – localism rules the American market.

If you live in a Red town and you’re a recreational cannabis user, stigma will prevail over the scientific data, and changing that stigma is almost impossible without hard scientific evidence to back-up the marketing campaign.

Qualitative research is key when understanding why people buy into particular industries. This might not be the general belief held by most folks in advertising, as stats and numbers are distinctly easier to work with. However, as last year’s General Election and Brexit vote showed: numbers can lie. Therefore, the best means of understanding what people really want is to actually talk to them – and I mean in-person.

Marketing rules are shifting. More and more, the heads of marketing departments are turning to scientific and scholarly data to assess the current trends in social development, molding their campaigns around this data as a means of showing that they are industry leaders in understanding the phenomena, as well as speaking to target buyers in their own language.

Am I being too wordy? Let me put it simply.

Say your new product is an indoor indica strain with sleep/stress aid properties, this is how you should market it to three specific demographics:

  • Californian recreational smoker in the 50+ age demographic with a moderate knowledge of cannabis strains, “Indoor indica, grown locally with minimal chemical input, good as a sleep aid and positive for stress reduction.”
  • New York medical user, 30+, business background, “This strain is an excellent sleep aid, can decrease stress without taking off the edge of your day-to-day workload; highly recommended for those employed in a full-time, private sector position.”
  • Small town with predominantly low-income demographic employed in blue-collar industry, “affordable means of relaxing after a tough day at work that won’t give you the same cancer risk as tobacco.”

We market the same strain to each of these demographics, but the language used in the campaign is more important than the product itself. In the UK, the same strain would be marketed across the country using something like:

“Dank strain with sleep aid and relaxation properties, best for chilling out at the end of the day – definitely not recommended prior to work!”

What this means for the United States cannabis marketing specialist is simple: you need to invest as much as you can in getting scholarly researchers out into the field and figuring out the local socio-demographic linguistic trends for your target buyers. Luckily, this can be a fairly affordable means of research.

Marketing specialists have two options in uncovering this data:

  • Use students currently enrolled in universities and colleges, either offering paid internships or college credit for bulk research.
  • Hire an academic consultancy corporation. This is rapidly becoming a norm in for companies looking to expand their marketing by using scientific data, particularly in industries related to sport and the outdoors.

Just like how Pepsi really missed the mark with their latest failed advertising campaign, cannabis companies are at significant risk of ostracizing themselves from a wealth of demographics that would otherwise be open to recreational or medical cannabis use as an alternative to harsh pharmaceuticals, alcohol and even some forms of therapy.

Language is key, and if you can’t talk to your buyers on their level then you’ve already lost your edge over the competition.

BioTrackTHC Awarded Delaware’s Tracking Software Contract

By Aaron G. Biros
No Comments

According to a press release, the State of Delaware has chosen BioTrackTHC as their partner in seed-to-sale tracking software. Delaware’s Department of Health and Social Services (DHSS) signed a contract with BioTrackTHC for the tracking and patient registry software.

In 2016, Delaware issued a request for proposals for “the Delaware Enterprise Consolidated Cannabis Control System,” which encompasses the statewide patient registry and seed-to-sale traceability systems. “Our sincerest thanks to DHSS for choosing Team BioTrack,” says Patrick Vo, CEO of BioTrackTHC. “DHSS has been wonderful to work with throughout the contracting process, and we look forward to partnering with them to provide the tools and data they need to continue overseeing the industry and protecting their patients.” BioTrack’s software was selected as the winner of a number of government contracts in other states previously for the same role.

Their software is currently used in government traceability systems in Washington, New Mexico, Illinois, Hawaii, New York and the city of Arcata, California. The press release states regulators will have the ability to view the retail data “including plant counts and usable inventory, lab results, transportation, and point-of-sale data—to perform periodic audits and ensure compliance.” The patient registry will also provide better patient accessibility through the new software with a faster turn around time and automated application processing.

BioTrackTHC provides technology solutions for businesses and governments to tracking products throughout the supply chain to the point of sale. The software systems help businesses remain compliant with regulations and monitor data for things like inventory management.

The Practical Chemist

Building the Foundation of Medical Cannabis Testing – Understanding the Use of Standards and Reference Materials – Part 1

By Joe Konschnik
No Comments

In previous articles, you may recall that Amanda Rigdon, one our contributing authors, stated that instrument calibration is the foundation of all data quality. In this article, I would like to expand on that salient point. A properly calibrated instrument will, in fact, produce reliable data. It is the foundation we build our data upon. All foundations are comprised of building blocks, and our laboratory is no exception. If we take this analogy further, the keystone to the laboratory foundation, the stone that all data relies upon, is the analytical reference material. Proper calibration means that it is based on a true, accurate value. That is what the reference material provides. In this article, I would like to expand on the use and types of reference materials in analytical testing.

To develop sound analytical data, it is important to understand the significance of reference materials and how they are properly used. The proper selection and use of reference materials ensures the analytical certainty, traceability and comparability necessary to produce scientifically sound data. First, let’s take a moment to define the types of commonly used reference materials. According to the International Vocabulary of Metrology (VIM), a Reference Standard (RS) is something that is reused to measure against, like a balance or a set of weights. A Reference Material (RM) is a generic term. It is described as something that is prepared using a RS that is homogeneous, stable and is consumed during its use for measurement. An example of an RM is the solutions used to construct a calibration curve, often referred to as calibration standards, on your GC or LC. Due to the current state of cannabis testing, reference materials can be hard to find and, even more critical, variable in their accuracy to a known reference standard. Sometimes this is not critical, but when quantifying an unknown, it is paramount.

RMs can be either quantitative or qualitative. Qualitative RMs verify the identity and purity of a compound. Quantitative RMs, on the other hand, provide a known concentration, or mass, telling us not only what is present, and its purity, but also how much. This is typically documented on the certificate that accompanies the reference material, which is provided by the producer or manufacturer. The certificate describes all of the properties of the starting materials and steps taken to prepare the RM. For testing requirements, like potency, pesticides, etc., where quantitation is expected, it is important to use properly certified quantitative RMs.

Now, the pinnacle of reference materials is the Certified Reference Material (CRM). VIM defines a Certified Reference Material (CRM) as an RM accompanied by documentation issued by an authoritative body and provides one or more specified property values, with associated uncertainties and traceability using valid procedures. A CRM is generally recognized as providing the highest level of traceability and accuracy to a measurement – the strongest keystone you can get for your foundation. It is also important to recognize that the existence of a certificate does not make a reference material a CRM. It is the process used in manufacturing that makes it a CRM, and these are typically accreditations earned by specific manufacturers who have invested on this level of detail.

Now that we understand the types of reference materials we can choose, in the next article of this series we will describe what a CRM provider must do to ensure the material and how we can use them to develop reliable data. Without properly formulated and prepared CRMs, instrument calibration and the use of internal standards are less effective at ensuring the quality of your data.


If you have any questions please contact me, Joe Konschnik at (800) 356-1688 ext. 2002 by phone, or email me at joe.konschnik@restek.com.

amandarigdon
The Practical Chemist

Calibration Part II – Evaluating Your Curves

By Amanda Rigdon
No Comments
amandarigdon

Despite the title, this article is not about weight loss – it is about generating valid analytical data for quantitative analyses. In the last installment of The Practical Chemist, I introduced instrument calibration and covered a few ways we can calibrate our instruments. Just because we have run several standards across a range of concentrations and plotted a curve using the resulting data, it does not mean our curve accurately represents our instrument’s response across that concentration range. In order to be able to claim that our calibration curve accurately represents our instrument response, we have to take a look at a couple of quality indicators for our curve data:

  1. correlation coefficient (r) or coefficient of determination (r2)
  2. back-calculated accuracy (reported as % error)

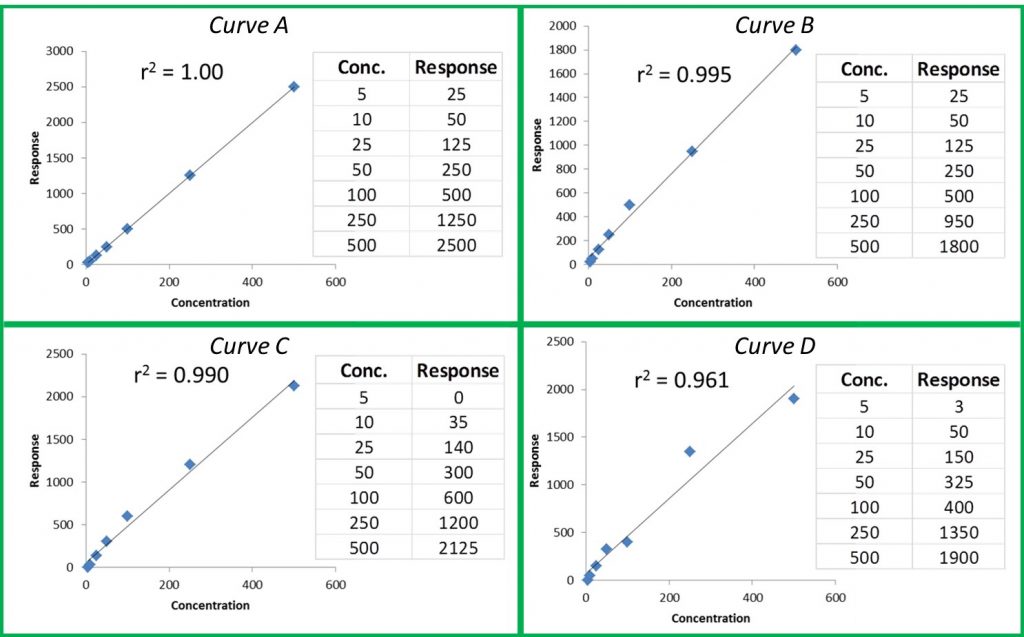
The r or r2 values that accompany our calibration curve are measurements of how closely our curve matches the data we have generated. The closer the values are to 1.00, the more accurately our curve represents our detector response. Generally, r values ≥0.995 and r2 values ≥ 0.990 are considered ‘good’. Figure 1 shows a few representative curves, their associated data, and r2 values (concentration and response units are arbitrary).

Figure 1: Representative Curves and r2 values

Let’s take a closer look at these curves:

Curve A: This represents a case where the curve perfectly matches the instrument data, meaning our calculated unknown values will be accurate across the entire calibration range.

Curve B: The r2 value is good and visually the curve matches most of the data points pretty well. However, if we look at our two highest calibration points, we can see that they do not match the trend for the rest of the data; the response values should be closer to 1250 and 2500. The fact that they are much lower than they should be could indicate that we are starting to overload our detector at higher calibration levels; we are putting more mass of analyte into the detector than it can reliably detect. This is a common problem when dealing with concentrated samples, so it can occur especially for potency analyses.

Curve C: We can see that although our r2 value is still okay, we are not detecting analytes as we should at the low end of our curve. In fact, at our lowest calibration level, the instrument is not detecting anything at all (0 response at the lowest point). This is a common problem with residual solvent and pesticide analyses where detection levels for some compounds like benzene are very low.

Curve D: It is a perfect example of our curve not representing our instrument response at all. A curve like this indicates a possible problem with the instrument or sample preparation.

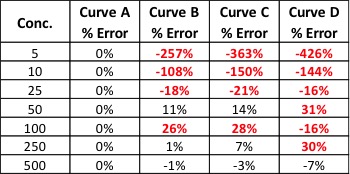
So even if our curve looks good, we could be generating inaccurate results for some samples. This brings us to another measure of curve fitness: back-calculated accuracy (expressed as % error). This is an easy way to determine how accurate your results will be without performing a single additional run.

Back-calculated accuracy simply plugs the area values we obtained from our calibrators back into the calibration curve to see how well our curve will calculate these values in relation to the known value. We can do this by reprocessing our calibrators as unknowns or by hand. As an example, let’s back-calculate the concentration of our 500 level calibrator from Curve B. The formula for that curve is: y = 3.543x + 52.805. If we plug 1800 in for y and solve for x, we end up with a calculated concentration of 493. To calculate the error of our calculated value versus the true value, we can use the equation: % Error = [(calculated value – true value)/true value] * 100. This gives us a % error of -1.4%. Acceptable % error values are usually ±15 – 20% depending on analysis type. Let’s see what the % error values are for the curves shown in Figure 1.

practical chemist table 1
Table 1: % Error for Back-Calculated Values for Curves A – D

Our % error values have told us what our r2 values could not. We knew Curve D was unacceptable, but now we can see that Curves B and C will yield inaccurate results for all but the highest levels of analyte – even though the results were skewed at opposite ends of the curves.

There are many more details regarding generating calibration curves and measuring their quality that I did not have room to mention here. Hopefully, these two articles have given you some tools to use in your lab to quickly and easily improve the quality of your data. If you would like to learn more about this topic or have any questions, please don’t hesitate to contact me at amanda.rigdon@restek.com.

amandarigdon
The Practical Chemist

Easy Ways to Generate Scientifically Sound Data

By Amanda Rigdon
1 Comment
amandarigdon

I have been working with the chemical analysis side of the cannabis industry for about six years, and I have seen tremendous scientific growth on the part of cannabis labs over that time. Based on conversations with labs and the presentations and forums held at cannabis analytical conferences, I have seen the cannabis analytical industry move from asking, “how do we do this analysis?” to asking “how do we do this analysis right?” This change of focus represents a milestone in the cannabis industry; it means the industry is growing up. Growing up is not always easy, and that is being reflected now in a new focus on understanding and addressing key issues such as pesticides in cannabis products, and asking important questions about how regulation of cannabis labs will occur.

While sometimes painful, growth is always good. To support this evolution, we are now focusing on the contribution that laboratories make to the safety of the cannabis consumer through the generation of quality data. Much of this focus has been on ensuring scientifically sound data through regulation. But Restek is neither a regulatory nor an accrediting body. Restek is dedicated to helping analytical chemists in all industries and regulatory environments produce scientifically sound data through education, technical support and expert advice regarding instrumentation and supplies. I have the privilege of supporting the cannabis analytical testing industry with this goal in mind, which is why I decided to write a regular column detailing simple ways analytical laboratories can improve the quality of their chromatographic data right now, in ways that are easy to implement and are cost effective.

Anyone with an instrument can perform chromatographic analysis and generate data. Even though results are generated, these results may not be valid. At the cannabis industry’s current state, no burden of proof is placed on the analytical laboratory regarding the validity of its results, and there are few gatekeepers between those results and the consumer who is making decisions based on them. Even though some chromatographic instruments are super fancy and expensive, the fact is that every chromatographic instrument – regardless of whether it costs ten thousand or a million dollars – is designed to spit out a number. It is up to the chemist to ensure that number is valid.

In the first couple of paragraphs of this article, I used terms to describe ‘good’ data like ‘scientifically-sound’ or ‘quality’, but at the end of the day, the definition of ‘good’ data is valid data. If you take the literal meaning, valid data is justifiable, logically correct data. Many of the laboratories I have had the pleasure of working with over the years are genuinely dedicated to the production of valid results, but they also need to minimize costs in order to remain competitive. The good news is that laboratories can generate valid scientific results without breaking the bank.

In each of my future articles, I will focus on one aspect of valid data generation, such as calibration and internal standards, explore it in practical detail and go over how that aspect can be applied to common cannabis analyses. The techniques I will be writing about are applied in many other industries, both regulated and non-regulated, so regardless of where the regulations in your state end up, you can already have a head start on the analytical portion of compliance. That means you have more time to focus on the inevitable paperwork portion of regulatory compliance – lucky you! Stay tuned for my next column on instrument calibration, which is the foundation for producing quality data. I think it will be the start of a really good series and I am looking forward to writing it.