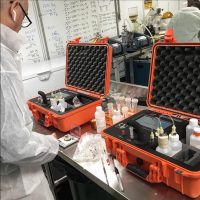
Last week at the National Cannabis Industry Association’s (NCIA) Cannabis Business Summit, Orange Photonics unveiled their newest product added to their suite of testing instruments for quality assurance in the field. The Terpenes+ Module for the LightLab Cannabis Analyzer, which semi-quantitatively measures terpenes, Cannabichromene (CBC) and degraded THC, adds three new chemical analyses to the six cannabinoids it already reports.
CBC, a cannabinoid typically seen in hemp and CBD-rich plants, has been linked to some potentially impactful medical applications, much like the findings regarding the benefits of CBD. The module that tests for it, along with terpenes and degraded THC, can be added to the LightLab without any changes to hardware or sample preparation.

According to Dylan Wilks, chief technology officer of Orange Photonics, this could be a particularly useful tool for distillate producers looking for extra quality controls. Cannabis distillates are some of the most prized cannabis products around, but the heat used to create them can also create undesirable compounds,” says Wilks. “Distillate producers can see potency drop more than 25% if their process isn’t optimized”. With this new Terpenes+ Module, a distillate producer could quantify degraded THC content and get an accurate reading for their QC/QA department.
We spoke with Stephanie McArdle, president of Orange Photonics, to learn more about their instruments designed for quality assurance for growers and extractors alike.

According to McArdle, this could help cultivators and processors understand and value their product when terpene-rich products are the end goal. “Rather than try to duplicate the laboratory analysis, which would require expensive equipment and difficult sample preparation, we took a different approach. We report all terpenes as a single total terpene number,” says McArdle. “The analyzer only looks for monoterpenes (some common monoterpenes are myrcene, limonene and alpha-pinene), and not sesquiterpenes (the other major group of cannabis terpenes, such as Beta- Caryophyllene and Humulene) so the analysis is semi-quantitative. What we do is measure the monoterpenes and make an assumption that the sesquiterpenes are similar to an average cannabis plant to calculate a total terpene content.” She says because roughly 80% of terpenes found in cannabis are monoterpenes, this should produce accurate results, though some exotic strains may not result in accurate terpene content using this method.

As growers look to make their product unique in a highly competitive market, many are looking at terpenes as a source of differentiation. There are a variety of areas where growers can target higher terpene production, McArdle says. “During production, a grower may want to select plants for growing based on terpene content, or adjust nutrient levels, lighting, etc. to maximize terpenes,” says McArdle. “During the curing process, adjusting the environmental conditions to maximize terpene content is highly desirable.” Terpenes are also beginning to get recognized for their potential medical and therapeutic values as well, notably as an essential piece in the Entourage Effect. “Ultimately, it comes down to economics – terpene rich products have a higher market value,” says McArdle. “If you’re the grower, you want to prove that your product is superior. If you’re the buyer, you want to ensure the product you buy is high quality before processing it into other products. In both cases, knowing the terpene content is critical to ensuring you’re maximizing profits.”
Orange Photonics’ LightLab operates very similarly to instruments you might find in a cannabis laboratory. Many cannabis testing labs use High Performance Liquid Chromatography (HPLC) to analyze hemp or cannabis samples. “The primary difference between LightLab and an HPLC is that we operate at lower pressures and rely on spectroscopy more heavily than a typical HPLC analysis does,” says McArdle. “Like an HPLC, LightLab pushes an extracted cannabis sample through a column. The column separates the cannabinoids in the sample by slowing down cannabinoids by different amounts based on their affinity to the column.” McArdle says this is what allows each cannabinoid to exit the column at a different time. “For example, CBD may exit the column first, then D9THC and so on,” says McArdle. “Once the column separates the cannabinoids, they are quantified using optical spectroscopy- basically we are using light to do the final quantification.”


