Remediation of delta-9 tetrahydrocannabinol (d9-THC) has become a hot button issue in the United States ever since the Drug Enforcement Agency (DEA) released their changes to the definitions of marijuana, marijuana extract, and tetrahydrocannabinols exempting extracts and tetrahydrocannabinols of a cannabis plant containing 0.3% or less d9-THC on a dry weight basis from the Controlled Substances Act. That is because, as a direct consequence, all extracts and tetrahydrocannabinols of a cannabis plant containing more than 0.3% d9-THC became explicitly under the purview of the DEA, including work-in-progress “hemp extracts” that because of the extraction process are above the 0.3% d9-THC limit immediately upon creation.
The legal ramifications of these changes to the definitions on the “hemp extracts” marketplace will not be addressed. Instead, this article focuses on the amount of d9-THC that is available in the plant material prior to extraction and tracks a “hemp extract” from the point it falls out of compliance to the point it becomes compliant again and stresses the importance of accurate track-n-trace protocols at the processing facility. The model developed to support this article was intended to be academic and was designed to follow the d9-THC portion of a “hemp extract” through the lifecycle of a typical CO2-based extract from initial extraction to THC remediation. A loss to the equipment of 2% was used for each step.
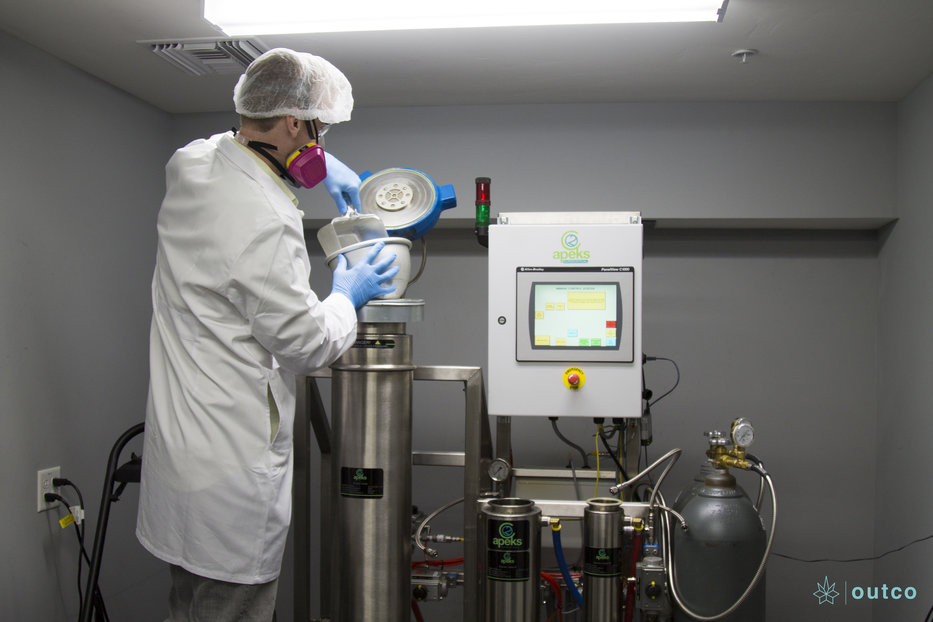
Initial Extraction
For this exercise, a common processing scenario of 1000 kg of plant material at 10% cannabidiol (CBD) and 0.3% d9-THC by weight was modeled. This amount, depending on scale of operations, can be a facility’s total capacity for the day or the capacity for a single run. 1000 kg of plant material at 0.3% d9-THC has 3 kg of d9-THC that could be extracted, purified, and diverted into the marketplace. CO2 has a nominal extraction efficiency of 95%, meaning some cannabinoids are left behind in the plant material. The same can be said about the recovery of the extract from the equipment. Traces of extract will remain in the equipment and this little bit of material, if unaccounted for, can potentially open an operator up to legal consequences. Data for the initial extraction is shown in Image 1.
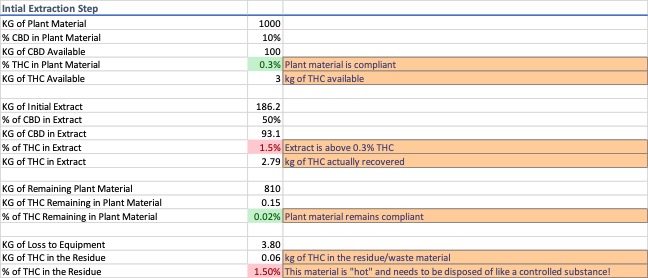
As soon as the initial extract is produced it is out of compliance with the 0.3% d9-THC limit to be classified as a “hemp extract”, and of the 3 kg of d9-THC available, the extract contains approx. 2.8 kg, because some of the d9-THC remains in the plant material and some is lost to the equipment.
Dewaxing via Winterization and Solvent Removal
Dewaxing a typical CO2 extract via winterization is a common process step. For this exercise, a wax content of 30% by weight was used. A process efficiency of 98% was attributed to the wax removal process and it was assumed that 100% of the loss can be accounted for in the residue recovered from the equipment rather than in the removed waxes. Data for the winterization and solvent recovery are shown in Image 2 and 3.
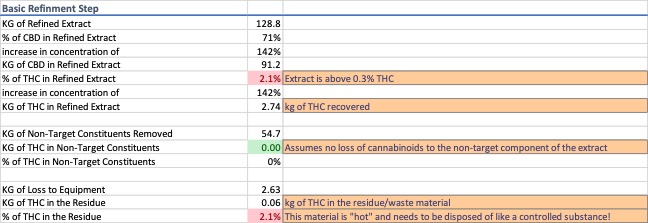
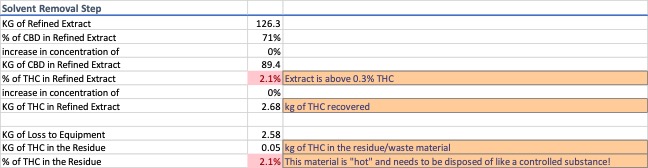
Two things occur during winterization and solvent removal, non-target constituents are removed from the extract and there is compounded loss from multiple pieces of process equipment. These steps increase the concentration of the d9-THC portion of the extract and produce two streams of noncompliant waste.
Decarboxylation & Devolatilization
Most cannabinoids in the plant material are in their acid form. For this exercise, 90% of the cannabinoids were considered to be acid forms. Decarboxylation is known to produce a mass difference of 87.7%, i.e. the neutral forms are 12.3% lighter than the acid forms. Heat was modeled as the primary driver and a process efficiency of 95% was used for the conversion rate during decarboxylation. To simplify the model, the remaining 5% acidic cannabinoids are presumed destroyed rather than degraded into other compounds because the portion of the cannabinoids which get destroyed versus degrade into other compounds varies from process to process.
Devolatilization is the process of removing low-molecular weight constituents from an extract to stabilize it prior to distillation. Since the molecular constituents of cannabis resin extracts vary from variety to variety and process to process, the extracts were assumed to consist of 10% volatile compounds. The model combines the decarboxylation and devolatilization steps to account for complete decarboxylation of the available acidic cannabinoids and ignores their weight contribution to the volatiles collected during devolatilization. Destroyed cannabinoids result in an amount of loss that can only be accounted for through a complete mass balance analysis. Data for decarboxylation and devolatilization are shown in Image 4.
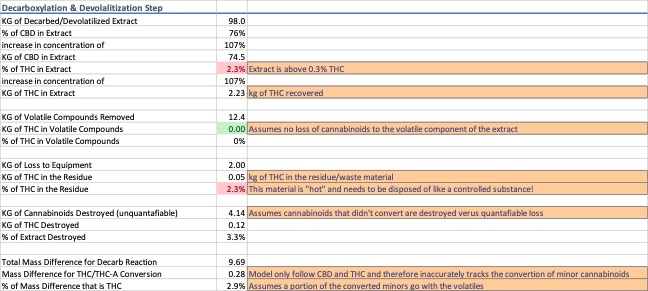
As the extract moves along the process train, the d9-THC concentration continues to increase. Decarboxylation further complicates traceability because there is both a known mass difference associated with the process and an unknown mass difference that must be calculated and justified.
Distillation
A two-pass distillation was modeled. On each pass a portion of the extract was removed to increase the cannabinoid concentration in the recovered material. Average data for distilled “hemp extracts” was used to ensure the model did not over- or underestimate the concentration of the cannabinoids in the distillate. The variables used to meet these data constraints were derived experimentally to match the model to the scenario described and are not indicative of an actual distillation. Data for distillation is shown in Image 5.
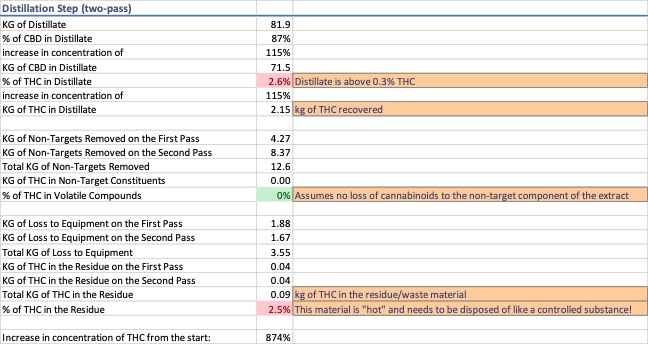
After distillation, the d9-THC concentration is shown to have increased by 874% from the original concentration in the plant material. Roughly 2.2 kg of the available 3 kg of d9-THC remains in the extract, but 0.8 kg of d9-THC has either ended up in a waste stream or walking out the door.
Chromatography – THC Remediation Step 1
Chromatography was modeled to remove the d9-THC from the extract. Because there are several systems with variable efficiency rates at being able to selectively isolate the d9-THC peak from the eluent stream, the model used a 5% cut-off on the front-end and tail-end of the peak, i.e. 5% of the material before the d9-THC peak and 5% of the material after the d9-THC peak is assumed to be collected along with the d9-THC. Data for chromatography is shown in Image 6.
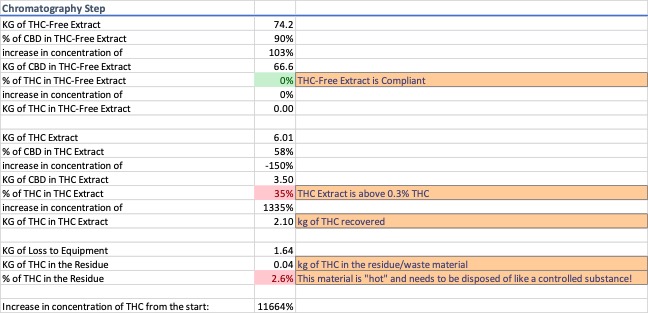
After chromatography, a minimum of three products are produced, compliant “hemp extract”, d9-THC extract, and noncompliant residue remaining in the equipment. The d9-THC extract modeled contains 2.1 kg of the available 3 kg in the plant material, and is 35% d9-THC by weight, an increase of 1335% from the distillation step and 11664% from the plant material.
CBN Creation – THC Remediation Step 2
For this exercise, the d9-THC extract was converted into cannabinol (CBN) using heat rather than cyclized into d8-THC, but a similar model could be used to account for this scenario. The conversion rate of the cannabinoids into CBN through heat degradation alone is low. Therefore, the model assumes half of the available cannabinoids in the d9-THC extract are converted to CBN. The entirety of the remaining portion of the cannabinoids are assumed to convert to some form of degradant rather than a portion getting destroyed. Data for THC destruction is shown in Image 7.
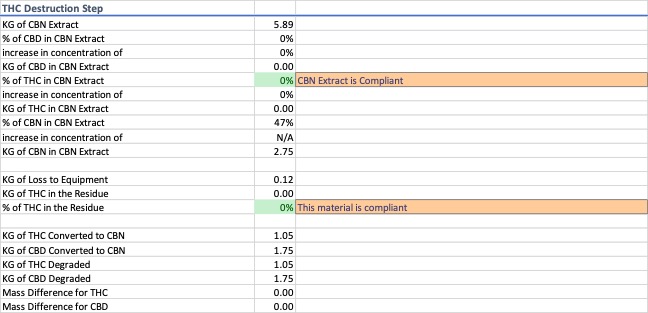
Only after the CBN cyclization step has completed does the product that was the d9-THC extract become compliant and classifiable as a “hemp extract.”
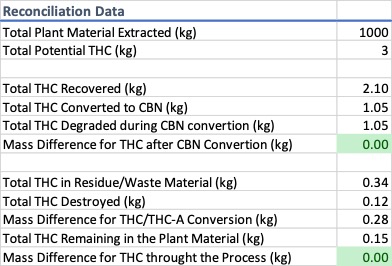
Throughout the process, from initial extraction to the final d9-THC remediation step, loss occurs. Of the 3 kg of d9-THC available in the plant material only 2.1 kg was recovered and converted to CBN. 0.9 kg was either lost to the equipment, destroyed in the process, attributable to the mass difference associated with decarboxylation, or was never extracted from the plant material in the first place. All of these potential areas of product loss should be identified, and their diversion risk fully assessed. Not every waste stream poses a risk of diversion, but some do; having a plan in place to handle waste the DEA considers a controlled substance is essential. Without a track-n-trace program following the d9-THC and identifying the potential risk of diversion would be impossible. The point of this is not to instill fear, instead the intention is to shed light on a very real issue “hemp extract” producers and state regulators need to understand to protect themselves and their marketplace from the DEA.