Tag Archives: FID

Terpene_KAS2
From The Lab

The Other Side of Cannabis: Terpenes

By Dr. Zacariah Hildenbrand, Allegra Leghissa, Dr. Kevin A. Schug
2 Comments
Terpene_KAS2

Have you ever wondered why all beers have that strong, characteristic smell? Or why you could tell the smell of cannabis apart from any other plant? The answer is simple – terpenes.

These 55,000 different molecules are responsible for a majority of the odors and fragrances around us, from a pine forest, to the air diffuser in your house 1–3. They all share the same precursor, isoprene, and because of that, they are all related and have similar molecular structures. Unfortunately, it is this uncanny similarity that makes their analysis so challenging; we still lack a complete list of which terpenes expected to be found in each given plant species 1,2.

Many different methods have been developed in an effort to provide a time-optimized and straightforward analysis. Gas chromatography (GC) is usually center stage due to the volatility of the terpenes. Therefore, there is significant concern with the type of GC detector used 2.

The flame ionization detector (FID) is a good quantitative detector for GC, but qualitatively it does not provide any information, except for retention time; the differentiation between terpene species is achieved solely by use of retention indices (RI), which are based on elution times from a particular GC stationary phase. The best part of the FID is its low cost, reliability, and relatively easy interface, which make it an effective tool for quality control (QC) but less so with respect to research and discovery 2.

The primary choice for a research setting is the mass spectrometer (MS) detector. It is more expensive and complicated than FID, but importantly, it provides both good quantitative capabilities, and it provides mass spectra for each species that elutes from the chromatograph. However, for terpene analysis, it may still not be the best detector choice. Since terpene class molecules share many structural and functional similarities, even their fragmentation and sub-sequential identification by MS may lead to inconsistent results, which need to be confirmed by use of RI. Still, MS is a better qualitative analysis tool than the FID, especially for distinguishing non-isobaric terpenes 2.

Recently, new technology based on vacuum ultraviolet spectroscopy (VUV) has been developed as a new GC detector. The VUV detector enables analysis of virtually all molecules; virtually all chemical compounds absorb light in the range in the 125-240 nm wavelength range probed by the detector, making it an essentially universal detector 4–11. Previously, spectroscopic absorption detectors for GC have lacked sufficient energy to measure absorption of most GC-amenable species. The VUV detector fills a niche, which is complementary to MS detection in terms of the qualitative information it provides.
Terpene_KAS2
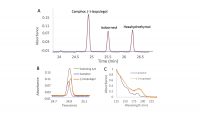
Figure 1: A, Section of the chromatographic separation of a terpenes standard mix; B, highlight of the co-eluting terpenes, camphor and (-)-isopulegol; C, differences in the absorbance spectra of camphor and (-)-isopulegol.

With the VUV detector, each compound exhibits its own unique absorbance spectrum. Even isomers and isobars, which are prevalent in terpene mixtures and can be difficult to distinguish different species by their electron ionization mass spectra, can be well differentiated based on their VUV spectra 6,9,10.  Nevertheless, because analytes exhibit different spectra, it is not required to achieve a perfect chromatographic separation of the mixture components. Co-eluting peaks can be separated post-run through the use of library spectra and software inherent to the instrument 4,10. This ability is called “deconvolution”, and it is based on the fact that two co-eluting terpenes will give a peak with an absorbance spectrum equal to the sum of the two single absorbance spectra 4. Figure 1 shows the deconvolution process for two co-eluting terpenes, camphor and (-)-isopulegol. Due to their different absorbance spectra (Figure 1C), it is possible to fully separate the two peaks in post-run, obtaining sharp peaks for both analytes 6.

The deconvolution process has been shown to yield precise and accurate results. Thus, chromatographic resolution can be sacrificed in favor of spectroscopic resolution; this enables the development of methods with faster run times. With the ability to deconvolve unresolved peaks, a long temperature ramp to chromatographically separate all isomeric terpenes is not required 6. Additionally, the presence of coeluting components, which might normally go undetected with some GC detectors, can be easily judged based on comparison of the measured spectra with pure reference spectra contained in the VUV spectral library.

The other issue in terpenes analysis is the extraction process. Terpenes can be extracted with the use of solvents (e.g., methanol, ethanol, hexane, and cyclohexane, among others), but the process is usually time-consuming, costly and not so environmentally-friendly 2. The plant needs to be manually crushed and then aliquots of solvent are used to extract components from the plant, ideally at least 3 times and combined to achieve acceptable results. The problem is that some terpenes may respond better to a certain solvent, making their extraction easier and more optimized than for others 2. The choice of solvent can cause discrimination against the extraction some terpenes, which limits the comprehensiveness of analysis.

Headspace is another technique that can be used for the sample preparation of terpenes. Headspace sampling is based on heating the solid or liquid sample inside a sealed vial, and then analyzing the air above it after sufficient equilibration. In this way, only volatile analytes are extracted from the solid/liquid sample into the gas phase; this allows relatively interference-free sampling 12–14.

How do we know whether our extraction analysis methods are correct and comprehensive for a certain plant sample? Unfortunately, there is not a complete list of available molecules for each plant species, and even if two specimens may smell really similar to our nose, their terpenes profiles may be notably different. When working with a new plant material, it is difficult to predict the extraction efficiency for the vast array of terpenes that may be present. We can only perform it with different extraction and detection methods, and compare the results.

The route for a comprehensive and fast analysis of terpenes is therefore still long; however, their intoxicating aromas and inherent medicinal value has provided a growing impetus for researchers around the world. Considering the evolving importance of Cannabis and the growing body of evidence on the synergistic effects between terpenes and cannabinoids, it is likely that newly improved extraction and analysis methods will be developed, paving the way for a more complete list of terpene species that can be found in different cultivars. The use of new analytical technologies, such as the VUV detector for GC, should aid considerably in this endeavor.


References:

[1]          Breitmaier E., Terpenes: Flavors, Fragrances, Pharmaca, Pheromones. John Wiley & Sons 2006.

[2]          Leghissa A., Hildenbrand Z. L., Schug K. A., A Review of Methods for the Chemical Characterization of Cannabis Natural Products. J. Sep. Sci.2018, 41, 398–415 .

[3]          Benvenuto E., Misra B. B., Stehle F., Andre C. M., Hausman J.-F., Guerriero G., Cannabis sativa: The Plant of the Thousand and One Molecules. Front. Plant Sci2016, 719, DOI: 10.3389/fpls.2016.00019.

[4]          Schug K. A., Sawicki I., Carlton D. D., Fan H.,Mcnair H. M.,Nimmo J. P., Kroll P.,Smuts J.,Walsh P., Harrison D., Vacuum Ultraviolet Detector for Gas Chromatography. Anal. Chem.2014, 86, 8329–8335 .

[5]          Fan H.,Smuts J., Walsh P.,Harrison D., Schug K. A., Gas chromatography-vacuum ultraviolet spectroscopy for multiclass pesticide identification. J. Chromatogr. A2015, DOI: 10.1016/j.chroma.2015.02.035.

[6]          Qiu C.,Smuts J., Schug K. A., Analysis of terpenes and turpentines using gas chromatography with vacuum ultraviolet detection. J. Sep. Sci.2017, 40, 869–877 .

[7]          Leghissa A., Smuts J., Qiu C., Hildenbrand Z. L., Schug K. A., Detection of cannabinoids and cannabinoid metabolites using gas chromatography-vacuum ultraviolet spectroscopy. Sep. Sci. Plus2018, 1.

[8]          Bai L.,Smuts J., Walsh P., Fan H., Hildenbrand Z., Wong D., Wetz D., Schug K. A., Permanent gas analysis using gas chromatography with vacuum ultraviolet detection. J. Chromatogr. A2015,1388, 244–250 .

[9]          Skultety L., Frycak P., Qiu C.,Smuts J., Shear-Laude L., Lemr K., Mao J. X., Kroll P., Schug K. A., Szewczak A., Vaught C., Lurie I., Havlicek V., Resolution of isomeric new designer stimulants using gas chromatography – Vacuum ultraviolet spectroscopy and theoretical computations. Anal. Chim. Acta2017, 971, 55–67 .

[10]       Bai L., Smuts J., Walsh P., Qiu C., McNair H. M., Schug K. ., Pseudo-absolute quantitative analysis using gas chromatography–vacuum ultraviolet spectroscopy–a tutorial. Anal. Chim. Acta2017, 953, 10–22 .

[11]       Schenk J., Nagy G., Pohl N. L. B., Leghissa A., Smuts J., Schug K. A., Identification and deconvolution of carbohydrates with gas chromatography-vacuum ultraviolet spectroscopy. J. Chromatogr. A2017, 1513, 210–221 .

[12]       Van Opstaele F., De Causmaecker B., Aerts G., De Cooman L., Characterization of novel varietal floral hop aromas by headspace solid phase microextraction and gas chromatography-mass spectrometry/olfactometry. J. Agric. Food Chem.2012, 60, 12270−12281 .

[13]       Hamm S., Bleton J., Connan J., Tchapla A., A chemical investigation by headspace SPME and GC-MS of volatile and semi-volatile terpenes in various olibanum samples. Phytochemistry2005,66, 1499–1514 .

[14]       Aberl A., Coelhan M., Determination of volatile compounds in different hop Varieties by headspace-trap GC/MS-in comparison with conventional hop essential oil analysis. J. Agric. Food Chem.2012, 60, 2785−2792 .

Chris English
The Practical Chemist

Accurate Detection of Residual Solvents in Cannabis Concentrates

By Chris English
2 Comments
Chris English

Edibles and vape pens are rapidly becoming a sizable portion of the cannabis industry as various methods of consumption popularize beyond just smoking dried flower. These products are produced using cannabis concentrates, which come in the form of oils, waxes or shatter (figure 1). Once the cannabinoids and terpenes are removed from the plant material using solvents, the solvent is evaporated leaving behind the product. Extraction solvents are difficult to remove in the low percent range so the final product is tested to ensure leftover solvents are at safe levels. While carbon dioxide and butane are most commonly used, consumer concern over other more toxic residual solvents has led to regulation of acceptable limits. For instance, in Colorado the Department of Public Health and Environment (CDPHE) updated the state’s acceptable limits of residual solvents on January 1st, 2017.

Headspace Analysis

Figure 1: Shatter can be melted and dissolved in a high molecular weight solvent for headspace analysis (HS). Photo Courtesy of Cal-Green Solutions.

Since the most suitable solvents are volatile, these compounds are not amenable to HPLC methods and are best suited to gas chromatography (GC) using a thick stationary phase capable of adequate retention and resolution of butanes from other target compounds. Headspace (HS) is the most common analytical technique for efficiently removing the residual solvents from the complex cannabis extract matrix. Concentrates are weighed out into a headspace vial and are dissolved in a high molecular weight solvent such as dimethylformamide (DMF) or 1,3-dimethyl-3-imidazolidinone (DMI). The sealed headspace vial is heated until a stable equilibrium between the gas phase and the liquid phase occurs inside the vial. One milliliter of gas is transferred from the vial to the gas chromatograph for analysis. Another approach is full evaporation technique (FET), which involves a small amount of sample sealed in a headspace vial creating a single-phase gas system. More work is required to validate this technique as a quantitative method.

Gas Chromatographic Detectors

The flame ionization detector (FID) is selective because it only responds to materials that ionize in an air/hydrogen flame, however, this condition covers a broad range of compounds. When an organic compound enters the flame; the large increase in ions produced is measured as a positive signal. Since the response is proportional to the number of carbon atoms introduced into the flame, an FID is considered a quantitative counter of carbon atoms burned. There are a variety of advantages to using this detector such as, ease of use, stability, and the largest linear dynamic range of the commonly available GC detectors. The FID covers a calibration of nearly 5 orders of magnitude. FIDs are inexpensive to purchase and to operate. Maintenance is generally no more complex than changing jets and ensuring proper gas flows to the detector. Because of the stability of this detector internal standards are not required and sensitivity is adequate for meeting the acceptable reporting limits. However, FID is unable to confirm compounds and identification is only based on retention time. Early eluting analytes have a higher probability of interferences from matrix (Figure 2).

Figure 2: Resolution of early eluting compounds by headspace – flame ionization detection (HS-FID). Chromatogram Courtesy of Trace Analytics.

Mass Spectrometry (MS) provides unique spectral information for accurately identifying components eluting from the capillary column. As a compound exits the column it collides with high-energy electrons destabilizing the valence shell electrons of the analyte and it is broken into structurally significant charged fragments. These fragments are separated by their mass-to-charge ratios in the analyzer to produce a spectral pattern unique to the compound. To confirm the identity of the compound the spectral fingerprint is matched to a library of known spectra. Using the spectral patterns the appropriate masses for quantification can be chosen. Compounds with higher molecular weight fragments are easier to detect and identify for instance benzene (m/z 78), toluene (m/z 91) and the xylenes (m/z 106), whereas low mass fragments such as propane (m/z 29), methanol (m/z 31) and butane (m/z 43) are more difficult and may elute with matrix that matches these ions. Several disadvantages of mass spectrometers are the cost of equipment, cost to operate and complexity. In addition, these detectors are less stable and require an internal standard and have a limited dynamic range, which can lead to compound saturation.

Regardless of your method of detection, optimized HS and GC conditions are essential to properly resolve your target analytes and achieve the required detection limits. While MS may differentiate overlapping peaks the chances of interference of low molecular weight fragments necessitates resolution of target analytes chromatographically. FID requires excellent resolution for accurate identification and quantification.

The Practical Chemist

Appropriate Instrumentation for the Chemical Analysis of Cannabis and Derivative Products: Part 1

By Rebecca Stevens
1 Comment

Election Day 2016 resulted in historic gains for state level cannabis prohibition reform. Voters in California, Maine, Massachusetts and Nevada chose to legalize adult use of Cannabis sp. and its extracts while even traditionally conservative states like Arkansas, Florida, Montana and North Dakota enacted policy allowing for medical use. More than half of the United States now allows for some form of legal cannabis use, highlighting the rapidly growing need for high quality analytical testing.

For the uninitiated, analytical instrumentation can be a confusing mix of abbreviations and hyphenation that provides little obvious information about an instrument’s capability, advantages and disadvantages. In this series of articles, my colleagues and I at Restek will break down and explain in practical terms what instruments are appropriate for a particular analysis and what to consider when choosing an instrumental technique.

Potency Analysis

Potency analysis refers to the quantitation of the major cannabinoids present in Cannabis sp. These compounds are known to provide the physiological effects of cannabis and their levels can vary dramatically based on cultivation practices, product storage conditions and extraction practices.

The primary technique is high performance liquid chromatography (HPLC) coupled to ultraviolet absorbance (UV) detection. Gas chromatography (GC) coupled to a flame ionization detector (FID) or mass spectrometry (MS) can provide potency information but suffers from issues that preclude its use for comprehensive analysis.

Pesticide Residue Analysis

Pesticide residue analysis is, by a wide margin, the most technically challenging testing that we will discuss here. Trace levels of pesticides incurred during cultivation can be transferred to the consumer both on dried plant material and in extracts prepared from the contaminated material. These compounds can be acutely toxic and are generally regulated at part per billion parts-per-billion levels (PPB).

Depending on the desired target pesticides and detection limits, HPLC and/or GC coupled with tandem mass spectrometry (MS/MS) or high resolution accurate mass spectrometry (HRAM) is strongly recommended. Tandem and HRAM mass spectrometry instrumentation is expensive, but in this case it is crucial and will save untold frustration during method development.

Residual Solvents Analysis

When extracts are produced from plant material using organic solvents such as butane, alcohols or supercritical carbon dioxide there is a potential for the solvent and any other contaminants present in it to become trapped in the extract. The goal of residual solvent analysis is to detect and quantify solvents that may remain in the finished extract.

Residual solvent analysis is best accomplished using GC coupled to a headspace sample introduction system (HS-GC) along with FID or MS detection. Solid phase microextraction (SPME) of the sample headspace with direct introduction to the GC is another option.

Terpene Profile Analysis

While terpene profiles are not a safety issue, they provide much of the smell and taste experience of cannabis and are postulated to synergize with the physiologically active components. Breeders of Cannabis sp. are often interested in producing strains with specific terpene profiles through selective breeding techniques.

Both GC and HPLC can be employed successfully for terpenes analysis. Mass spectrometry is suitable for detection as well as GC-FID and HPLC-UV.

Heavy Metals Analysis

Metals such as arsenic, lead, cadmium, chromium and mercury can be present in cannabis plant material due to uptake from the soil, fertilizers or hydroponic media by a growing plant. Rapidly growing plants like Cannabis sp. are particularly efficient at extracting and accumulating metals from their environment.

Several different types of instrumentation can be used for metals analysis, but the dominant technology is inductively coupled plasma mass spectrometry (ICP-MS). Other approaches can also be used including ICP coupled with optical emission spectroscopy (ICP-OES).

Rebecca is an Applications Scientist at Restek Corporation and is eager to field any questions or comments on cannabis analysis, she can be reached by e-mail, rebecca.stevens@restek.com or by phone at 814-353-1300 (ext. 2154)

An inductively coupled plasma torch used in MS reaches local temperatures rivaling the surface of the sun. Image by W. Blanchard, Wikimedia
An inductively coupled plasma torch used in Optical Emission Spectroscopy (OES) reaches local temperatures rivaling the surface of the sun. Image by W. Blanchard, Wikimedia