This is the first part of a series of articles designed to introduce an integrated pest management framework for cannabis cultivation facilities. Part one details an overview of the plan as well as pest identification. Part two comes out next week and will delve into the world of pest monitoring and record keeping. Stay tuned for more!
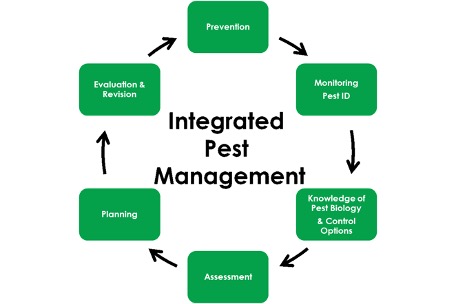
Figure 1: Integrated Pest Management Cycle
Background
Integrated Pest Management (IPM) is a philosophy of pest prevention and control that integrates cultural, mechanical, physical and chemical practices to control pest populations within an acceptable degree of economic tolerance.
IPM encourages growers to take a step-wise approach to determine the most appropriate means necessary for avoiding pest-related economic injury through careful consideration of all available pest control practices.
When practicing IPM, less invasive non-chemical practices are given priority, until escalation necessitates otherwise.
This is Part 1: Pest Identification & Monitoring/Communications
Personal experience in a facility is a great place to start. Review your history and identify a list of pests that you have experienced in this or previous grows. Point out which pests currently exist where they were or are currently and possible sources of the contamination/infestation.
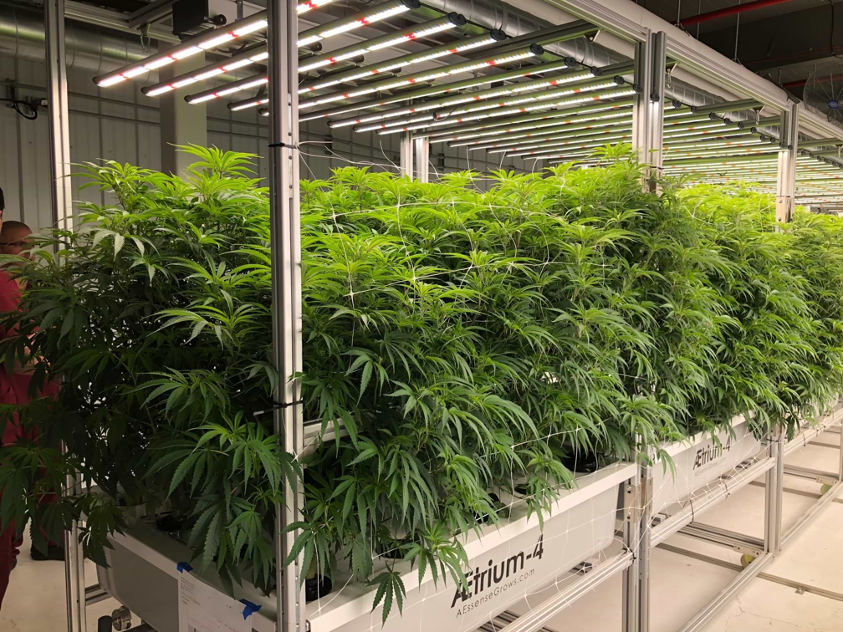
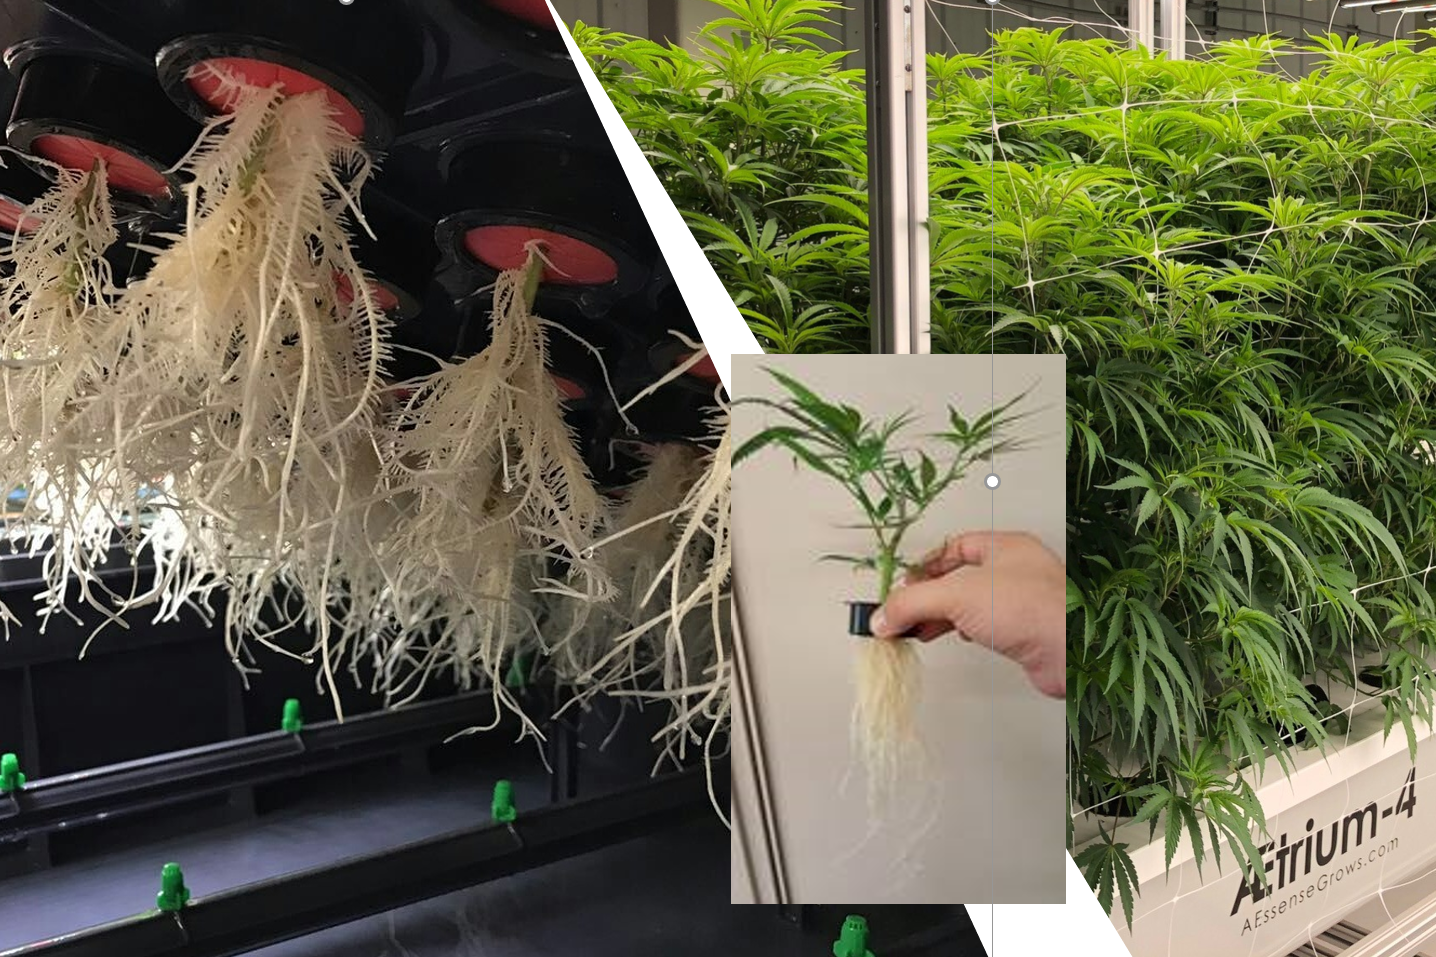
Figure 2: Healthy Aeroponic Mother Stock
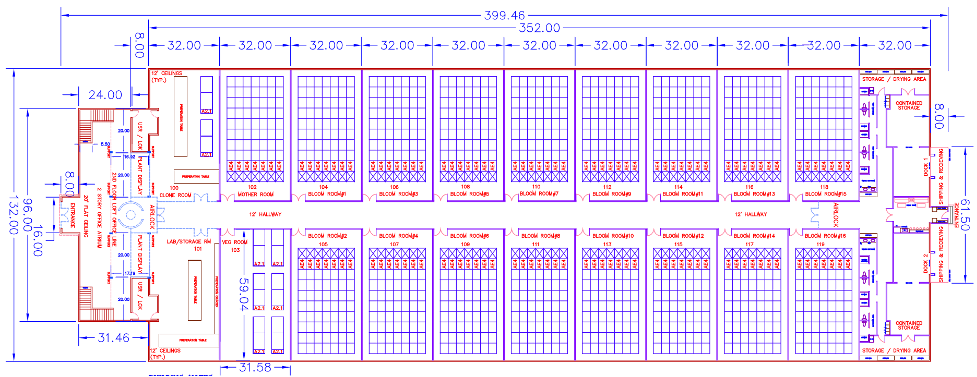
Map out your facility with clear entry/exits, plumbing & drainage and air flow access to visually see and understand potential access points for crawling, flying or airborne pests.
From your nursery mother room to cloning and vegetation areas, what are the transfer methods as you move from one area to another. Are pests present in these areas? Where could they have come from? Oftentimes, a cultivator may not have the space for their own mother and cuttings/cloning space. In these cases, where did the outsourced clones come from? What are the IPM controls in place for these genetic sources? Are they carriers of the challenges transferred to your own facility? It is important to identify the possible source of pest potentials
Does your flower room have white flies or fungus gnats? Locating these and identifying the likely source is a good place to start if you have an ongoing infestation.
Figure 3: Example Aeroponic Facility Layout For IPM Planning
Powdery mildew is a routine challenge if air into your facility is not filtered and sterilized to eliminate these spores.
What is the Source of Your Irrigation/Fertigation Water?
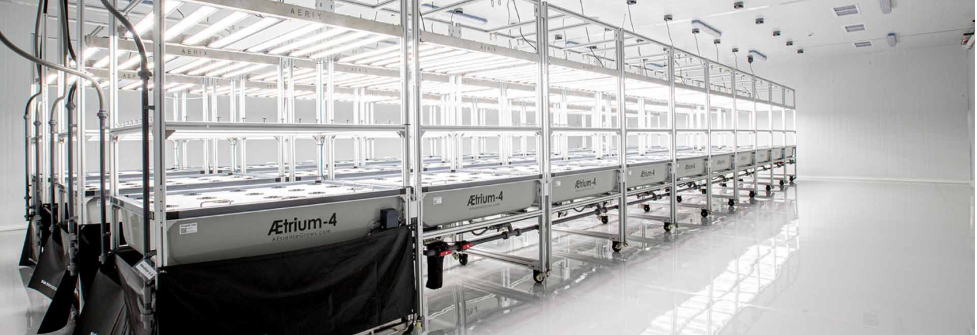
Water is a crucial element for high-value indoor farms such as those that grow cannabis. However, water can also be a source of disease-causing microorganisms that can negatively impact the growth and yield of crops. Monitoring, filtering and sterilizing the biological contents of water is therefore crucial in ensuring the health and quality of high-value crops.
Unfiltered water can contain a range of pathogens such as bacteria, viruses, fungi and parasites that can cause root, stem and bud rot. These diseases can cause significant losses in crop yield and quality, which can be devastating for indoor farmers growing high-value crops.
Figure 4: Precision Aeroponics at FarmaGrowers GMP Facility, South Africa
Monitoring the quality of water that is brought into the indoor farm is the first step in ensuring that the water is free from harmful pathogens. This involves regular testing of the incoming water for parameters such as pH, dissolved oxygen, TDS, nutrient content and microbial load. This allows cultivators to identify aspects of the incoming water they need to address before the water is provided to their crops to prevent potential problems.
Is your plumbing building biofilm that is feeding into your irrigation lines? Obviously, there are many potential sources when you go through an inventory of the risks for your facility. From that initial step, you will build your management team and label who should be contacted when a pest is found. Do you have an IPM specialist or is this a resource that needs to be contracted to address an infection?
Building this communications tree is your first step to fewer pest issues and higher yields and potency.
For the complete white paper on Integrated Pest Management Recommendations, download the document here. Part two comes out next week and will delve into the world of pest monitoring and record keeping. Stay tuned for more!
This is Part 2 in The 3-Legged Stool of Successful Grow Operations series. Click here to read Part 1 and stay tuned for Part 3 coming next week.
Aeroponic and hydroponic systems use zero-soil, so water is effectively our media and our transport mechanism for nutrition. Ideally, you start with clean, fresh water with “nothing” in it. Nothing in this case means no heavy metals, pesticides, bacteria or pathogens. There are some scary words in there so let’s talk through the best ways to get to “nothing.”
The first place to start is by testing your source water, whether it is surface, well or municipal water. This will give you an initial idea of how “empty” your water is. Water supplies shift over time, so it is also a very important input to monitor over time with annual or bi-annual testing. Clean water is the essence of success for aeroponics and a great way to lower your cost of production. With proper design and management, you can recycle and reuse 95%+ of the water you draw into your facility.
Reverse Osmosis (RO)
Mothers to clones: Happy clones, it’s all about the water
RO is the most common way to clear your incoming water. The process uses pressure filtration by forcing your water through a series of filters or meshes that block or extract large particles, organics and metals. Normally this is 98%-99% efficient. These systems do require attention and maintenance as they do have filters that are required to be changed regularly depending on the clarity of your original water source and the type of material filtered. This accomplishes a lot of your water clearing process to empty the balloon, but it does not clear the pesky biologicals or pathogens. RO is covered in detail in our “You are what you drink” webinar so look that over for a deeper explanation. There are a wide range of relatively low-cost suppliers based on capacity and filtration efficiency. From an operations standpoint, the key is to understand the filter replacement cycle and cost of replacement.
Ultraviolet Light (UV)
UV light can be used to clear organics and pathogens from water. The primary use is to clear origin water but it is also especially important for recovered water that you save from the humidity in your grow rooms. More on this below. One has to be cautious about the use of UV light. It will cause sunburn and eye damage with exposure so handle this resource with care. After RO & UV treatment, input water should be an empty balloon ready for the addition of your perfect nutrient salt recipe. There are a wide range of low-cost UV lighting solution suppliers from which to choose and they are easy to find.
Dehumidification & Recovery (DEHU)
Early root follicles: Reaching for first nutrients
The number one way to conserve water in an accelerated growth aeroponic grow room is to recapture the humidity that is transpired into the air as the plants grow. While DEHU water is effectively distilled water (or clear of particulates), it can be full of healthy little bacteria or pathogens than may be transported through air or residing in the equipment filters. Clearing these with UV light normally makes this water directly reusable in your fertigation systems. Not all dehumidifiers are perfect. Some metals used in their construction can leach into the recovered water, so this is worth a deeper look as you create your complete water system. Air treatment suppliers are covered in Part 1 of this series.
Used Fertigation Water, or “Flush”
At the start of the flower cycle, take your clean water (the empty balloon) and add your perfect nutrient salt flower recipe and deliver it to your plants. Over the grow cycle from flower to harvest, your plants will use portions of your nutrients and your balloon contents will drift from your target recipe you’re your desired cycle, clear or flush your reservoirs and reset your recipe by refilling your balloon to your exact targets. The exiting nutrient-rich “flush” water can also be recycled into your source water feed since the salts and metals present can be cleared from the mixture through the same RO process that your source water goes through. The end result is perfectly good recycled water savings.
Oxygen Reduction Potential (ORP)
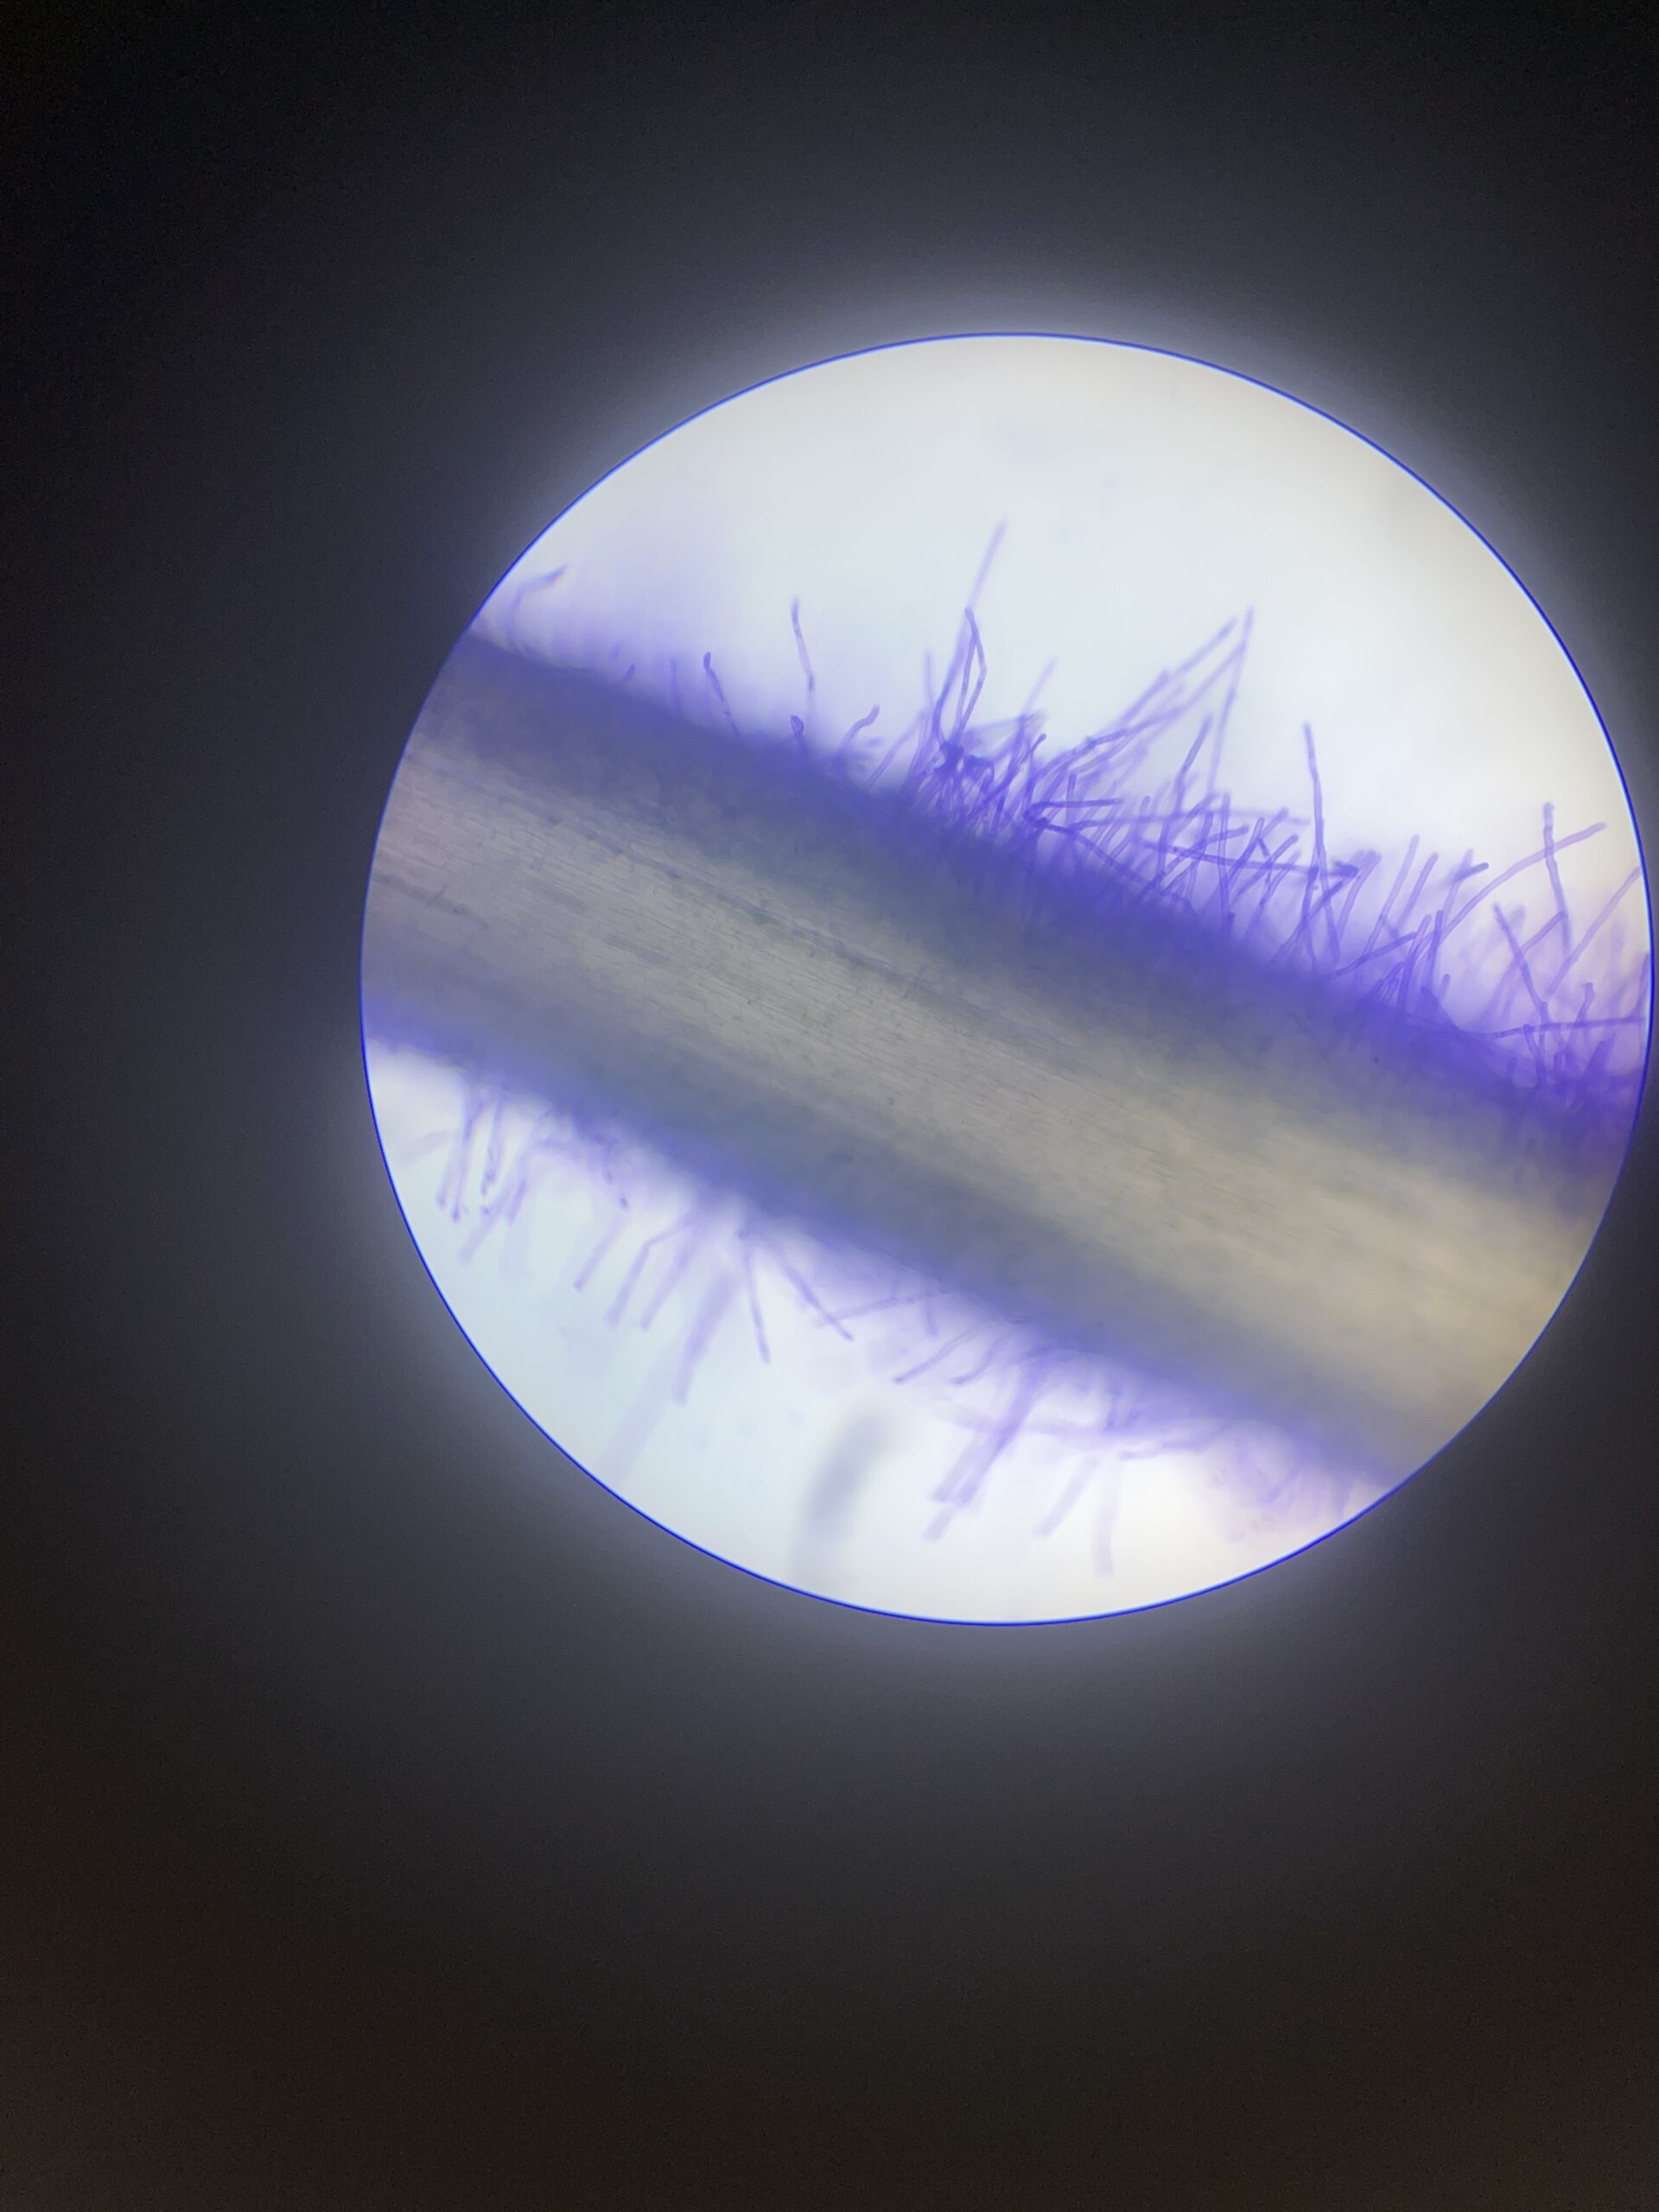
Healthy roots reach for water: Early veg when plants get rolling
ORP is a measurement of an oxidizing agent. Oxidizing solutions are a common and inexpensive method of disinfecting water before and during use in hydroponic systems. Oxidizers can be used to monitor and deal with the “cleanliness” of a nutrient water solution while it is in use. Several oxidizing agents exist with the most common being: hydrogen peroxide, chlorine, ozone and chlorine dioxide. The characteristics of each of these agents and how they interact with the organic matter in solutions is different. The ideal concentrations to use in each situation to kill or control pathogens is unique and one of the topics covered by our “Letters from the AEssenseGrows plant science team” on our website. That deep dive is the subject of another paper.
When you take all of these subjects together and they are done right, you should be able to recycle 95% of your source water with a professional water treatment & recycling system.
Here, I would like highlight the ultimate water hero: Ashley Hubbard, director of cultivation at RAIR Cannabis. For a quick tour of her water treatment and recovery room, see here. No one that I know manages water better than RAIR Cannabis and Ashley leads the team there.
By Kelsey Cagle, Frank L. Dorman, Jessica Westland No Comments
Sample preparation is an essential part of method development and is critical to successful analytical determinations. With cannabis and cannabis products, the analyst is faced with a very challenging matrix and targets that may range from trace level through percent level thus placing considerable demands on the sample preparation techniques.1 The optimal sample preparation, or “extraction”, method for potency analysis of cannabis flower was determined using a methanol extraction coupled with filtration using regenerated cellulose filters.
In the United States (US), Canada, and other countries where medicinal and/or adult recreational cannabis has been legalized, regulatory entities require a panel of chemical tests to ensure quality and safety of the products prior to retail sales2. Cannabis testing can be divided into two different categories: Quality and Safety. Quality testing, which includes potency analysis (also known as cannabinoid testing or cannabinoid content), is performed to analyze the product in accordance with the producer/grower expectations and government regulations. Safety testing is conducted under regulatory guidelines to ensure that consumers are not exposed to toxicants such as pesticides, mycotoxins, heavy metals, residual solvents and microbial contaminates.
Potency testing evaluates the total amount of cannabinoid content, specifically focusing on tetrahydrocannabinol (THC) and cannabidiol (CBD). In the US, the biggest push for accurate total THC is to differentiate between hemp (legally grown for industrial or medicinal use), which is defined as cannabis sativa with a THC limit ≤ 0.3 %, and cannabis (Cannabis spp.), which is any cannabis plant with THC measured above 0.3 %3. Potency testing is typically performed by liquid chromatography (LC) with UV detection to determine the quantity of major cannabinoids.
In addition to reporting THC and CBD, their respective precursors are also important for reporting total potency. Tetrahydrocannabinolic acid (THCA) is the inactive precursor to THC while cannabidiolic acid (CBDA) is the precursor to CBD.4,5
Methods and Materials
Sample Preparation
All samples were homogenized using an immersion blender with a dry material grinder. The nominal sample amounts were 200 mg of flower, 500 mg of edibles, and 250 mg of candy samples.
Potency Extraction Method (1)
Twenty milliliters (mL) of methanol (MeOH) was added to each sample. The samples were mechanically shaken for 10 minutes and centrifuged for 5 minutes.
Potency Extraction Method (2)
Ten mL of water was added to each sample. The samples were mechanically shaken for 10 minutes. 20 mL of acetonitrile (ACN) was then added to each sample and vortexed. An EN QuEChERS extraction salt packet was added to the sample. The samples were placed on a mechanical shaker for 2 minutes and then centrifuged for 5 minutes.
Each extract was split and evaluated with two filtration/cleanup steps: (1) a regenerated cellulose (RC) syringe filter (Agilent Technologies, 4 mm, 0.45 µm); (2) a PFTE syringe filter (Agilent Technologies, 4 mm, 0.45 µm). The final filtered extracts were injected into the ultra-performance liquid chromatograph coupled with a photodiode array detector (UPLC-PDA) for analysis.
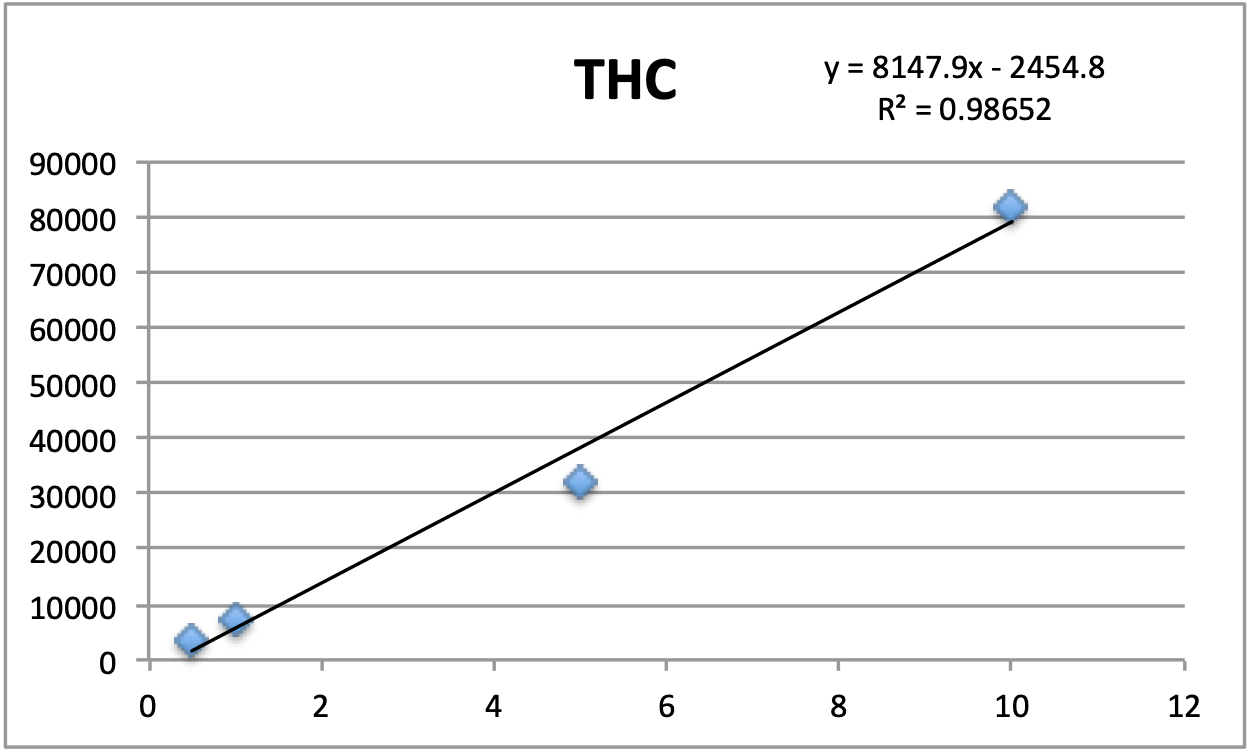
Figure 1: Calibration curve for THC potency
Calibration
Standards were obtained for the following cannabinoids at a concentration of 1 mg/mL: cannabidivarin (CBDV), tetrahydrocannabivarin (THCV), cannabidiol (CBD), cannabigerol (CBG), cannabidiolic acid (CBDA), cannabigerolic acid (CBGA), cannabinol (CBN), tetrahydrocannabinol (9-THC), cannabichromene (CBC), tetrahydrocannabinol acid (THCA). Equal volumes of each standard were mixed with MeOH to make a standard stock solution of 10 ug/mL. Serial dilutions were made from the stock to make concentrations of 5, 1, and 0.5 ug/mL for the calibration curve (Figure 1).
Instrumental Method
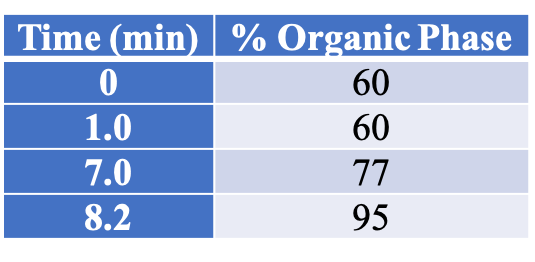
All instrument parameters were followed from Agilent Application Note 5991-9285EN.8 A UPLC with a PDA (Waters Corp, Milford, MA) detector was employed for potency analysis. An InfinityLab Poroshell 120 EC-C18, 3.0 x 50 mm, 2.7 um column (Agilent Technologies, Wilmington, DE) was utilized for compound separation. The organic mobile phase composition was 0.05 % (v/v) formic acid in HPLC grade MeOH and the aqueous mobile phase composition was 0.1 % (v/v) formic acid in HPLC grade water. The mobile phase gradient is shown in Table 1. The flow rate was 1 mL/min (9.5 minute total program), injection volume was 5 uL, and column temperature was 50 °C.
Table 1: LC mobile phase gradient for potency samples6
Discussion and Results
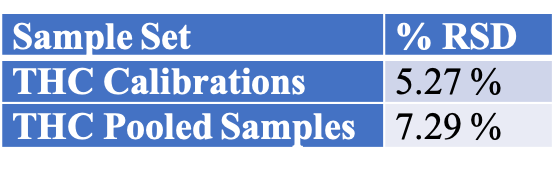
Table 2 summarizes the relative standard deviations (% RSD) were found for the THC calibrator (at 1 ug/mL) and one extract of a homogeneous sample (utilizing 7 replicates).
Table 2- %RSD values for the instrument response precision for THC in both the calibrations and the homogeneous extract.
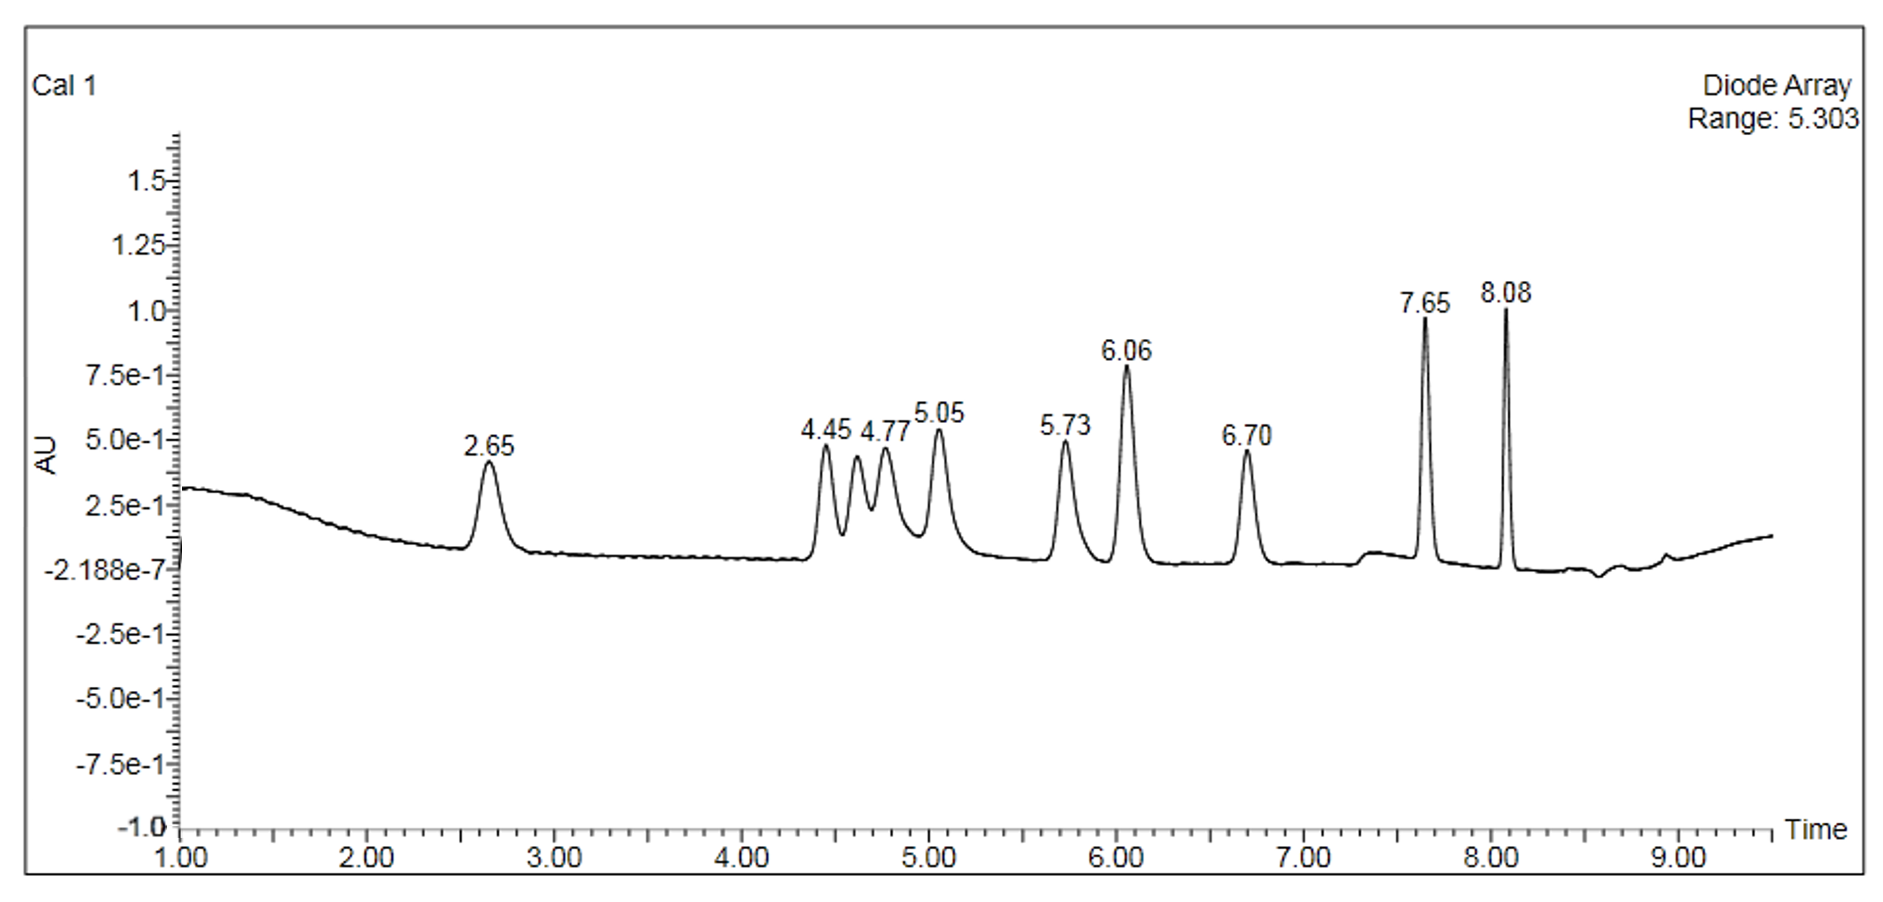
The cannabinoid potency of various cannabis plant and cannabis product samples were determined for the various extraction techniques In the chromatograms THC was observed ~8.08 minutes and CBD was observed ~4.61 minutes (Figure 2).
Figure 2: Chromatogram of the 10ug/mL calibrator for potency/cannabinoid analysis
Total potency for THC & CBD were calculated for each sample using the equations below. Equation 1 was used because it accounts for the presence of THCA as well as the specific weight difference between THC and THCA (since THCA will eventually convert to THC, this needs to be accounted for in the calculations).
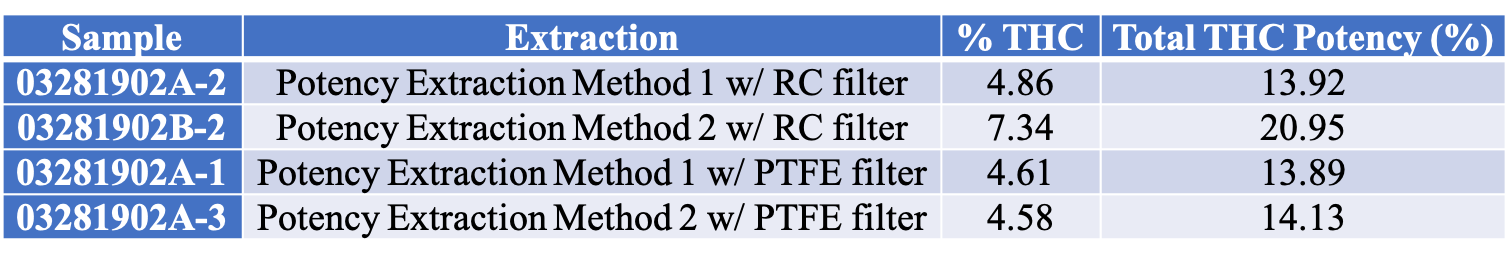
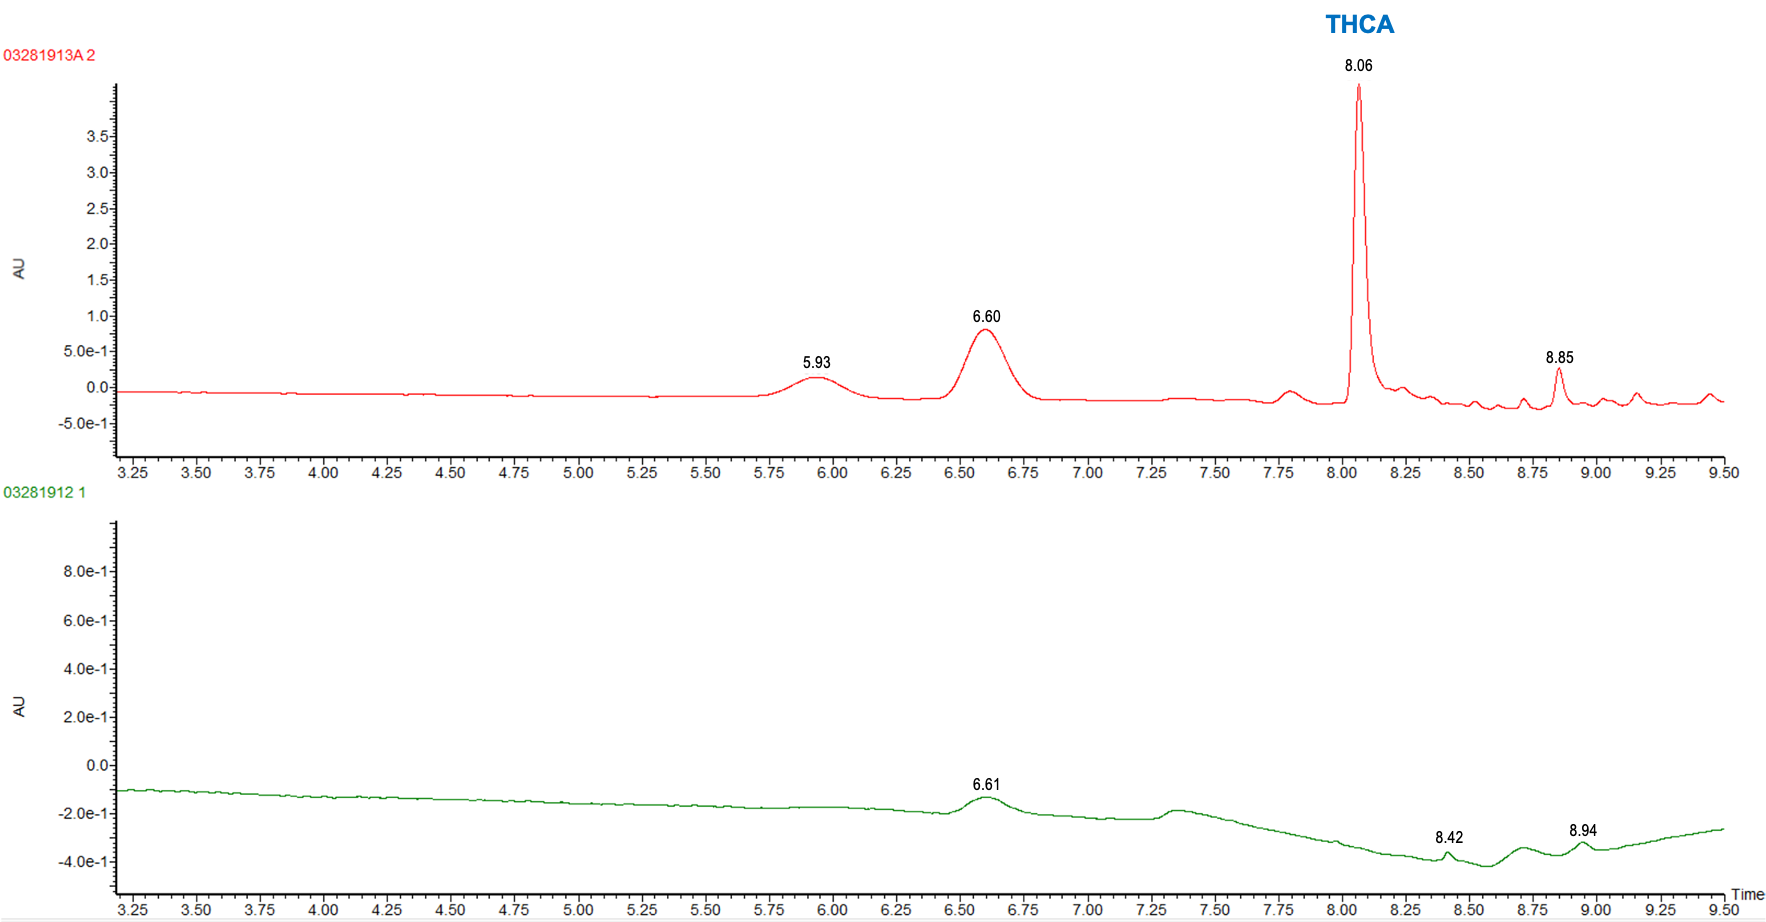
Table 3 shows the % THC and the total THC potency values calculated for the same flower samples that went through all four various potency sample preparation techniques as described earlier. Figure 3 also provides LC chromatograms for flower sample 03281913A-2 and edible sample 03281912-1.
Table 3-THC and Total THC potency values for the same cannabis flower sample processed through the combination of extractions and cleanups.Figure 3: Potency/Cannabinoid analysis chromatogram for flower sample 03281913A-2 (red trace) and edible sample 03281912-1 (green trace).
The results indicated that with the “Potency Extraction Method 2” (ACN/QuEChERS extraction) coupled with the RC filter provided a bias of 7.29 % greater for total THC % over the other extraction techniques. Since the other 3 techniques provided total THC values within 2% of each other, the total THC of the sample is more likely ~14%.
Since the sample dilution for the above data set reduced the CBD content, an undiluted sample was run and analyzed. This data is reported in Table 4.
Table 4- CBD and Total CBD potency values for the same cannabis flower sample processed through different sample preparation techniques.
The CBD results indicated that with the “Potency Extraction Method 1” (methanol extraction) coupled with RC filter, allowed for a greater CBD recovery. This may indicate the loss of CBD with an ACN/QuEChERS extraction.
With an average ~14% total THC and 0.06% total CBD for a homogenous cannabis flower sample, the optimal sample preparation extraction was determined to be a methanol extraction coupled with filtration using a regenerated cellulose filter. Since potency continues to remain at the forefront of cannabis regulatory testing it is important to utilize the right sample prep for your cannabis samples.
References
Wang M, Wang YH, Avula B, Radwan MM, Wanas AS, Mehmedic Z, et al. Quantitative Determination of Cannabinoids in Cannabis and Cannabis Products Using Ultra-High-Performance Supercritical Fluid Chromatography and Diode Array/Mass Spectrometric Detection. Journal of Forensic Sciences 2016;62(3):602-11.
Matthew Curtis, Eric Fausett, Wendi A. Hale, Ron Honnold, Jessica Westland, Peter J. Stone, Jeffery S. Hollis, Anthony Macherone. Cannabis Science and Technology, September/October 2019, Volume 2, Issue 5.
Sian Ferguson. https://www.healthline.com/health/hemp-vs-marijuana. August 27, 2020.
Taschwer M, Schmid MG. Determination of the relative percentage distribution of THCA and 9-THC in herbal cannabis seized in Austria- Impact of different storage temperatures on stability. Forensic Science International 2015; 254:167-71.
Storm C, Zumwalt M, Macherone A. Dedicated Cannabinoid Potency Testing Using the Agilent 1220 Infinity II LC System. Agilent Technologies, Inc. Application Note 5991-9285EN
This website uses cookies so that we can provide you with the best user experience possible. Cookie information is stored in your browser and performs functions such as recognising you when you return to our website and helping our team to understand which sections of the website you find most interesting and useful.
Strictly Necessary Cookies
Strictly Necessary Cookie should be enabled at all times so that we can save your preferences for cookie settings.
We use tracking pixels that set your arrival time at our website, this is used as part of our anti-spam and security measures. Disabling this tracking pixel would disable some of our security measures, and is therefore considered necessary for the safe operation of the website. This tracking pixel is cleared from your system when you delete files in your history.
We also use cookies to store your preferences regarding the setting of 3rd Party Cookies.
If you disable this cookie, we will not be able to save your preferences. This means that every time you visit this website you will need to enable or disable cookies again.