Tag Archives: gas chromotography

A Conversation with the Founders of Veda Scientific: Part One

By Aaron G. Biros
No Comments

Leo Welder, CEO of Veda Scientific, founded the business with Aldwin M. Anterola, PhD in July of 2019. A serial entrepreneur with experience in a variety of markets, he came to the industry with an intrigue for cannabis testing and analysis. After teaming up with Dr. Anterola, co-founder and chief science officer at Veda Scientific, they came together with the purpose of unlocking possibilities in cannabis. From the beginning, they set out with a heavy scientific interest in furthering the industry from a perspective of innovation and research.

Through discussing their clients’ needs and understanding their complex problems, the two realized they wanted to start a lab that goes well beyond the normal regulatory compliance testing. Innovation in cannabis looks like a lot of things: new formulations for infused products, better designs for vaping technology or new blends of genetics creating unique strains, to name a few. For the folks at Veda Scientific, innovation is about rigorous and concentrated research and development testing.

With the help of some very sophisticated analytical chemistry instruments, their team is working on better understanding how volatile compounds play a part in the chemometrics of cannabis. From varietals and appellations to skunky smells, their research in the chemistry of cannabis is astounding – and they’ve only begun to scratch the surface.

In this two-part series, we discuss their approach to cannabis testing, their role in the greater industry as a whole and we go down a few cannabis chemistry rabbit holes and find out that what we don’t know is a lot more than what we do know. In part one, we get into their backgrounds, how they came into the cannabis industry and how they are carving out their niche. Stay tuned for part two next week where we delve deep into the world of volatile compounds, winemaking, the tastes and smells of cannabis and chicken adobo.

Aaron G. Biros: Tell me about how you and your team came to launch Veda, how you entered the cannabis space and what Veda’s approach is to the role of testing labs in the broader cannabis industry. 

Leo Welder, CEO of Veda Scientific

Leo Welder: I’m an entrepreneur. This is my third significant venture in the last fifteen years or so. So, I was intrigued by cannabis legalization broadly, because it is such a unique time in our history. I was always interested in participating in the industry in some way, but I didn’t see where would be a good fit for me. I used to meet monthly with a group of friends and fellow entrepreneurs for dinner and discussions and one member started working on the software side of the industry. He mentioned the testing element of cannabis in one of our meetings. I latched on to that and was intrigued by the concept of testing cannabis. I began to research it and found the role that testing plays in the cannabis industry is really significant. I found out that regulators rely pretty heavily on labs to make sure that products are safe, labels are accurate and that consumers have some protections. So, I thought that this is a space that I thought I could really find a calling in.

So, from that point I knew I needed to find a subject matter expert, because I am not one. I have business skills and experience in some technical fields but I am not a cannabis testing expert by any means. So, with that I started to look at a few different markets that I thought may have opportunity for a new lab, and I came across Aldwin’s business; he had a cannabis testing lab in Illinois at that time. I reached out to him, talked to him about my vision for the space and his thoughts and his vision and we really started to come together. From there, we researched various markets and ultimately chose to approach Santa Barbara County as our first foray together into the cannabis testing market.

Aldwin M. Anterola: As Leo mentioned, he was looking for a subject matter expert and I am very much interested in plant biochemistry. Which means I like to study how plants make these compounds that are very useful to us. For my PhD [in plant physiology], I was studying how cell cultures of loblolly pine produce lignin. Our lab was interested in how pine trees produce lignin, which is what makes up wood. Wood comes from phenolic compounds. You’ve probably heard of antioxidants and flavonoids – those are phenolic compounds. After my PhD, I wanted to do something different so I decided to work with terpenes.

I picked a very important terpene in our field, an anti-cancer compound called Taxol, produced from the bark of the yew tree. You have to cut trees to harvest it. We have ways of synthesizing it now. But at that time, we were trying to figure out how the tree produces that terpene. Of course, I’m interested in any compound that plants make. My interest in terpenes led me to cannabinoids which turn out to be terpenophenolics, thus combining the two interests in my professional field.

Aldwin M. Anterola, PhD, Co-Founder and Chief Science Officer at Veda Scientific,

So that’s the scientific and intellectual side of why I became interested in cannabis, but practically speaking I got into cannabis because of a consulting offer. A company was applying for a cultivation license, wanted to have a laboratory component of their business in their application, and hired me to write that part of their application. I was very familiar with HPLC, and had a GC/MS in the lab. I also have a background in microbiology and molecular biology so I can cover every test required at that time, and I knew I could research the other analytical techniques if necessary.

So, they did not get the license, but I figured I’d take what I wrote, once I received permission, and set up an independent laboratory together. But it’s hard to run a lab and be a professor at the same time. Also, the busines side of running a lab is something that I am not an expert in. Fortunately, Leo found me. Before that, I really got excited about this new industry. The concept of cannabis being now accessible to more people is so interesting to me because of how new everything is. I wanted to be involved in an industry like this and help in making it safe while satisfying my curiosity in this new field of research. As a scientist, those are the things that excite us: the things we didn’t have access to, we can now do. It opens up a whole new room that we want to unlock. It was my intellectual curiosity that really drove me. This opened up new research avenues for me as well as other ventures if you will. How can I be more involved? I thought to myself.

SIU boasts an impressive cannabis program, thanks largely to Dr. Anterola’s work there.

Back in 2014, I introduced cannabis research to our university [Southern Illinois University] and set up an industrial hemp program, which was DEA-licensed I gathered faculty that would be interested in studying hemp and cannabis and we now have a whole cannabis science center at the university. I teach a course in cannabis biology and because I also teach medical botany to undergraduate students, I was able to introduce [premed] students to the endocannabinoid system. Anyway, I can go on and on.

Outside of that I became involved with the AOAC and ASTM, and became a qualified assessor for ISO 17025:2017. I have been a member of the American Chemical Society since 2000 but there were no cannabis related activities there yet until relatively recently. But when they had the new cannabis chemistry subdivision, I am happy to participate in there as well . There are many avenues that I took to begin dabbling with cannabis, be it research, nonprofits, teaching, testing and more. Cannabis has basically infiltrated all areas of what I do as an academic.

Leo: I read his resume and I was like this is the guy! So back to your question, what’s Veda’s role as a testing lab in this space? What are we trying to build? We spent a lot of time trying to figure out what we wanted to be in this space. We came to understand that labs are not the tip of the spear for the market; that would be the growers, the retailers and the processors. We are a support, a service. We see ourselves as a humble, but competent guide. We provide the data for the tip of the spear, the people pushing the industry forward with support, data and the services to make sure they have the tools they need to build these great companies and great products with good cultivation practices and more, leading everyone to the next level of the cannabis industry. Our job is to support innovation, to provide quality compliance testing, to of course ensure safety, while also providing great R&D to these innovative companies.

Aldwin: I’d like to add a bit to that thought. Okay so that’s who we are, but what are we not? Because as Leo said I had a testing lab before we met [Advanced Herbal Analytics]. From there, I approach it as safety testing, making sure that before it gets to the end consumer, we are sort of like gate keepers keeping consumers safe. That’s one side to it, but we are not the people who are trying to make sure that none of the products get to the market. For some, that’s how we’re treated as.

People often look at testing labs like the police. We are not the people trying to limit products to market. Our approach is not to find faults. There is another way of being a testing lab that is less about finding faults in products and more about finding uniqueness. What makes your product different? With this new approach, we are much more focused on helping the best products make it to the shelves.

Aaron: Given that all state licensed labs have to provide the same tests as the other labs in that state, how does Veda differentiate itself?

Leo: Location was the first thing. We picked Santa Barbara County intentionally. We knew that some of the biggest operators, some of the most forward-thinking innovators were setting up shop here. Looking down the road, not just this year or next year but very long term, we wanted to start building a great, sustainable company. We wanted to build a brand that those kinds of companies would be receptive to. Building better and greater products. There’s one other lab in the county and that’s it. Whereas there are clusters of labs in other parts of the state. Part of the draw to Santa Barbara for us was that it is such a small, tight-knit community. We have worked very hard to build relationships in our community and to understand their challenges, helping them however we can.

Location and relationships. Getting to know the challenges that different size customers face, be it our greenhouse customers versus outdoor customers, or large-scale operations versus smaller manufacturing operations, the challenges are all different. Some people care about turnaround times, some more about R&D. If we understand our client’s problems, then we can provide better service. We see ourselves as problem solvers. We lean heavily on our technical team members like Aldwin, who not only have tremendous amounts of experience and education, but also great networks to utilize when a customer needs help, even when it falls outside of our local expertise.

The GCxGC/MS instrument, used for Veda’s advanced R&D testing

Last but certainly not least is the advanced R&D testing that we do. When we first started, we started talking to farmers and manufacturers trying to understand their challenges. What data were they not getting? How would a testing lab better serve them? So, we started investing strategically in certain instruments that would allow us to better serve them. We’ll get into this later as well, but we invested in a GCxGC/MS, which allows us to get more visibility into things beyond the typical panels, like more terpenes and other volatile compounds including thiols and esters. We did that because we knew there is value in that. The data our customers were getting prior just wasn’t enough to put together really great breeding programs or to manufacture really consistent products, you know, to move toward that next level of innovation in the industry.

Aldwin: Leo mentioned advanced R&D and it’s basically the same approach that I mentioned before. It’s not just telling you what you can and cannot do. It’s about asking them what do you want to do and what do you want from a lab? If we have a problem, let’s see if we can solve it. That’s how the GCxGC/MS came into play because we knew there was a need to test for many terpenes and other volatile compounds. The common complaint we received was why two terpene profiles differ so much from each other, even from the same genetics.

This is something that would actually give the customer, the cultivator or the manufacturer: data about their product that they can actually use. For consistency, for better marketing and other reasons. We are trying to help them answer the questions of ‘how can I make my product better?’

You know, for example, clients would tell us they want something that has a specific taste or smells a certain way. Nobody is telling them what makes the flavor or smell. There is a need there that we can fill. We are trying to provide data that they, the customers, need so that they can improve their breeding programs or their formulations. Data they can use, not just data they need in order to comply with regulations. They would ask us what we can do. We listen to our customers and we try and help as best we can. We don’t know every answer. We are discovering there is a lot more to terpenes than what you can find on a traditional one dimensional gas chromatogram. Some of the terpene data that our clients had previously is not really actionable data, which is where the GCxGC/MS is helping us.


In part two, we delve deep into the world of volatile compounds, winemaking, the tastes and smells of cannabis and chicken adobo. Click here to read part two. 

amandarigdon
The Practical Chemist

Internal Standards– Turning Good Data Into Great Data

By Amanda Rigdon
2 Comments
amandarigdon

Everyone likes to have a safety net, and scientists are no different. This month I will be discussing internal standards and how we can use them not only to improve the quality of our data, but also give us some ‘wiggle room’ when it comes to variation in sample preparation. Internal standards are widely used in every type of chromatographic analysis, so it is not surprising that their use also applies to common cannabis analyses. In my last article, I wrapped up our discussion of calibration and why it is absolutely necessary for generating valid data. If our calibration is not valid, then the label information that the cannabis consumer sees will not be valid either. These consumers are making decisions based on that data, and for the medical cannabis patient, valid data is absolutely critical. Internal standards work with calibration curves to further improve data quality, and luckily it is very easy to use them.

So what are internal standards? In a nutshell, they are non-analyte compounds used to compensate for method variations. An internal standard can be added either at the very beginning of our process to compensate for variations in sample prep and instrument variation, or at the very end to compensate only for instrument variation. Internal standards are also called ‘surrogates’, in some cases, however, for the purposes of this article, I will simply use the term ‘internal standard.’

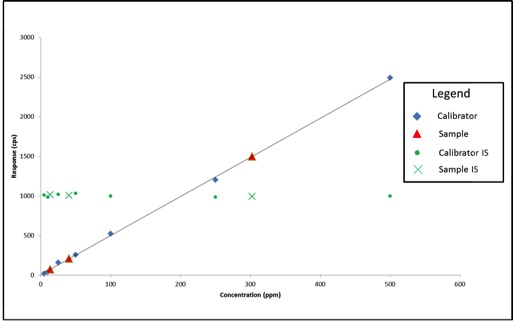
Now that we know what internal standards are, lets look at how to use them. We use an internal standard by adding it to all samples, blanks, and calibrators at the same known concentration. By doing this, we now have a single reference concentration for all response values produced by our instrument. We can use this reference concentration to normalize variations in sample preparation and instrument response. This becomes very important for cannabis pesticide analyses that involve lots of sample prep and MS detectors. Figure 1 shows a calibration curve plotted as we saw in the last article (blue diamonds), as well as the response for an internal standard added to each calibrator at a level of 200ppm (green circles). Additionally, we have three sample results (red triangles) plotted against the calibration curve with their own internal standard responses (green Xs).

Figure 1: Calibration Curve with Internal Standard Responses and Three Sample Results

In this case, our calibration curve is beautiful and passes all of the criteria we discussed in the previous article. Lets assume that the results we calculate for our samples are valid – 41ppm, 303ppm, and 14ppm. Additionally, we can see that the responses for our internal standards make a flat line across the calibration range because they are present at the same concentration in each sample and calibrator. This illustrates what to expect when all of our calibrators and samples were prepared correctly and the instrument performed as expected. But lets assume we’re having one of those days where everything goes wrong, such as:

  • We unknowingly added only half the volume required for cleanup for one of the samples
  • The autosampler on the instrument was having problems and injected the incorrect amount for the other two samples

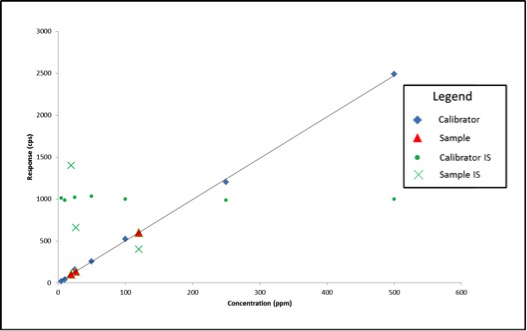
Figure 2 shows what our data would look like on our bad day.

Figure 2: Calibration Curve with Internal Standard Responses and Three Sample Results after Method Errors

We experienced no problems with our calibration curve (which is common when using solvent standard curves), therefore based on what we’ve learned so far, we would simply move on and calculate our sample results. The sample results this time are quite different: 26ppm, 120ppm, and 19ppm. What if these results are for a pesticide with a regulatory cutoff of 200ppm? When measured accurately, the concentration of sample 2 is 303ppm. In this example, we may have unknowingly passed a contaminated product on to consumers.

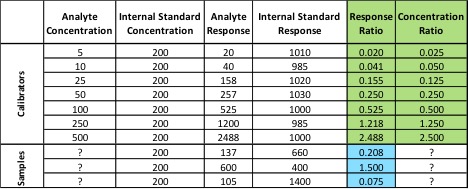
In the first two examples, we haven’t been using our internal standard – we’ve only been plotting its response. In order to use the internal standard, we need to change our calibration method. Instead of plotting the response of our analyte of interest versus its concentration, we plot our response ratio (analyte response/internal standard response) versus our concentration ratio (analyte concentration/internal standard concentration). Table 1 shows the analyte and internal standard response values for our calibrators and samples from Figure 2.


Table 1: Values for Calibration Curve and Samples Using Internal Standard

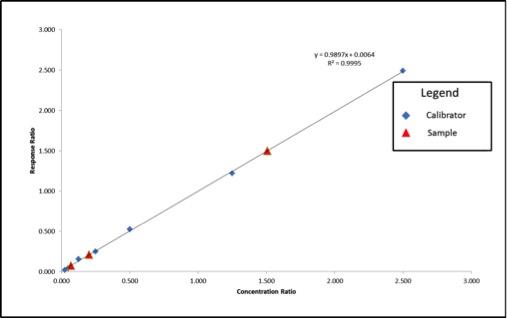
The values highlighted in green are what we will use to build our calibration curve, and the values in blue are what we will use to calculate our sample concentration. Figure 3 shows what the resulting calibration curve and sample points will look like using an internal standard.

Figure 3: Calibration Curve and Sample Results Calculated Using Internal Standard Correction

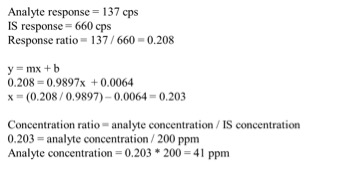
We can see that our axes have changed for our calibration curve, so the results that we calculate from the curve will be in terms of concentration ratio. We calculate these results the same way we did in the previous article, but instead of concentrations, we end up with concentration ratios. To calculate the sample concentration, simply multiply by the internal standard amount (200ppm). Figure 4 shows an example calculation for our lowest concentration sample.

Figure 4: Example Calculation for Sample Results for Internal-Standard Corrected Curve

Using the calculation shown in Figure 4, our sample results come out to be 41ppm, 302ppm, and 14ppm, which are accurate based on the example in Figure 1. Our internal standards have corrected the variation in our method because they are subjected to that same variation.

As always, there’s a lot more I can talk about on this topic, but I hope this was a good introduction to the use of internal standards. I’ve listed couple of resources below with some good information on the use of internal standards. If you have any questions on this topic, please feel free to contact me at amanda.rigdon@restek.com.


Resources:

When to use an internal standard: http://www.chromatographyonline.com/when-should-internal-standard-be-used-0

Choosing an internal standard: http://blog.restek.com/?p=17050

CannaGrow: Education on the Science of Cultivation

By Aaron G. Biros
No Comments

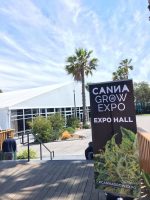
The CannaGrow Conference & Expo, held in San Diego on May 7th and 8th, educated attendees on the science of cannabis cultivation. The conference brought subject matter experts from around the country to discuss cannabis breeding and genetics, soil science and cultivation facility design.rsz_img_5038

Discussions at the conference delved deep into the science behind growing while providing some expert advice. Drew Plebani, chief executive officer of Commercial Cultivator, Inc., gave a comprehensive review of soil ecology and how understanding soil fertility is crucial to successfully growing consistent cannabis. “Soil fertility is measured by laboratories in terms of soil minerals, plant-available nutrients, percent of organic materials, pH levels and most importantly the balance of the soil’s chemical makeup,” says Plebani. “There is no silver bullet in soil ecology; increasing your soil fertility comes down to understanding the composition of soil with analytical testing.” Plebani went on to add that soil systems for cannabis need to be slightly fungal-dominant in developing an endomycorrhizal system, which is optimal for cannabis plant growth.

Plebani notes that growth and viability are reliant on maximum root mass.

Tom Lauerman, colloquially known as Farmer Tom and founder of Farmer Tom Organics, kicked off the conference with an introduction to cultivation techniques. Lauerman also delved into his experience working with federal agencies in conducting the first ever health hazard evaluation (HHE) for cannabis with the National Institute for Occupational Safety and Health (NIOSH). Through the HHE program, NIOSH responds to requests for evaluations of workplace health hazards, which are then enforced by the Occupational Safety & Health Administration (OSHA). Lauerman worked with those federal agencies, allowing them to tour his cultivation facilities to perform an HHE for cannabis processing worker safety. “I was honored to introduce those federal agencies to cannabis and I think this is a great step toward normalizing cannabis by getting the federal government involved on the ground level,” says Lauerman. Through the presentation, Lauerman emphasized the importance of working with NIOSH and OSHA to show federal agencies how the cannabis production industry emerged from the black market, branding itself with a sense of legitimacy.

Attendees flocked to Jacques and his team after the presentation to meet them.

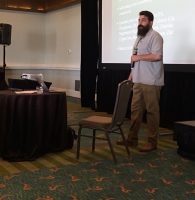
Adam Jacques, award-winning cultivator and owner of Grower’s Guild Gardens, discussed his success in breeding CBD-dominant strains and producing customized whole-plant extractions for specific patients’ needs. “I find higher percentages of CBD in plants harvested slightly earlier than you would for a high-THC strain,” says Jacques. “Using closed-loop carbon dioxide extraction equipment, we can use multiple strains to homogenize an oil dialed in for each patient’s specific needs.” As a huge proponent of the Entourage Effect, Jacques stressed the importance of full plant extraction using fractionation with carbon dioxide. He also stressed the importance of analytical testing at every step during processing.

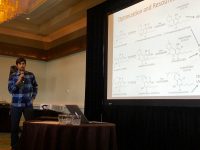
Hildenbrand discussing some of the lesser-known terpenoids yet to be studied.

Zacariah Hildenbrand, Ph.D., chief scientific officer at C4 Laboratories, provided the 30,000-foot view of the science behind compounds in cannabis, their interactions and his research. With the help of their DEA license, he started the C4 Cannabinomics Collaborative, where they are working with Dr. Kevin Schug at the University of Texas-Arlington to screen various cannabis strains to discover new molecules and characterize their structure. “Secondarily, we are using gene expression profiles and analysis to understand the human physiological response and the mechanism through which they elicit that response,” says Hildenbrand. “As this research evolves, we should look to epigenetics and understanding how genes are expressed.” His collaborative effort uses Shimadzu’s Vacuum Ultraviolet Spectroscopy (VUV), and they use the only VUV instrument in an academic laboratory in the United States. “Pharmaceuticals are supposed to be a targeted therapy and that is where we need to go with cannabis,” says Hildenbrand. Him and his team at C4 Laboratories want to work on the discovery of new terpenes and analyze their potential benefits, which could be significant research for cannabis medicine.

Other important topics at the conference included facility design and optimization regarding efficient technologies such as LED lighting and integrated pest management.

AOCS Highlights Cannabis Lab Standards, Extraction Technology

By Aaron G. Biros
No Comments

The American Oil Chemists’ Society (AOCS) held its annual conference in Salt Lake City this week, with a track focused on cannabis testing and technology. Cynthia Ludwig, director of technical services at AOCS and member of the advisory panel to The Emerald Test, hosted the two-day event dedicated to all things extraction technology and analytical testing of cannabis.

Highlights in the discussion surrounding extraction technologies for the production of cannabis concentrates included the diversity of concentrate products, solvent selection for different extraction techniques and the need for cleaning validation in extraction equipment. Jerry King, Ph.D., research professor at the University of Arkansas, began the event with a brief history of cannabis processing, describing the physical morphologies in different types of extraction processes.

J. Michael McCutcheon presents a history of cannabis in medicine

Michael McCutcheon, research scientist at Eden Labs, laid out a broad comparison of different extraction techniques and solvents in use currently. “Butane is a great solvent; it’s extremely effective at extracting active compounds from cannabis, but it poses considerable health, safety and environmental concerns largely due to its flammability,” says McCutcheon. He noted it is also very difficult to get USP-grade butane solvents so the quality can be lacking. “As a solvent, supercritical carbon dioxide can be better because it is nontoxic, nonflammable, readily available, inexpensive and much safer.” The major benefit of using supercritical carbon dioxide, according to McCutcheon, is its ability for fine-tuning, allowing the extractor to be more selective and produce a wider range of product types. “By changing the temperature or pressure, we can change the density of the solvent and thus the solubility of the many different compounds in cannabis.” He also noted that, supercritical carbon dioxide exerts tremendous pressure, as compared to hydrocarbon solvents, so the extraction equipment needs to be rated to a higher working pressure and is generally more expensive.

John A. Mackay, Ph.D., left at the podium and Jerry King, Ph.D., on the right

John A. Mackay, Ph.D., senior director of strategic technologies at Waters Corporation, believes that cannabis processors using extraction equipment need to implement cleaning SOPs to prevent contamination. “There is currently nothing in the cannabis industry like the FDA CMC draft for the botanical industry,” says Mackay. “If you are giving a child a high-CBD extract and it was produced in equipment that was previously used for another strain that contains other compounds, such as CBG, CBD or even traces of THC extract, there is a high probability that it will still contain these compounds as well as possibly other contaminants unless it was properly cleaned.” Mackay’s discussion highlighted the importance of safety and health for workers throughout the workflow as well as the end consumer.

Jeffrey Raber, Ph.D., chief executive officer of The Werc Shop, examined different testing methodologies for different applications, including potency analyses with liquid chromatography. His presentation was markedly unique in proposing a solution to the currently inconsistent classification system for cannabis strains. “We really do not know what strains cause what physiological responses,” says Raber. “We need a better classification system based on chemical fingerprints, not on baseless names.” Raber suggests using a chemotaxonomic system to identify physiological responses in strains, noting that terpenes could be the key to these responses.

Cynthia Ludwig welcomes attendees to the event.

Dylan Wilks, chief scientific officer at Orange Photonics, discussed the various needs in sample preparation for a wide range of products. He focused on sample prep and variation for on-site potency analysis, which could give edibles manufacturers crucial quality assurance tools in process control. Susan Audino, Ph.D., chemist and A2LA assessor, echoed Wilks’ concerns over sample collection methods. “Sampling can be the most critical part of the analysis and the sample size needs to be representative of the batch, which is currently a major issue in the cannabis industry,” says Audino. “I believe that the consumer has a right to know that what they are ingesting is safe.” Many seemed to share her sentiment about the current state of the cannabis testing industry. “Inadequate testing is worse than no testing at all and we need to educate the legislators about the importance of consumer safety.”

46 cannabis laboratories participated in The Emerald Test’s latest round of proficiency testing for potency and residual solvents. Cynthia Ludwig sits on the advisory panel to give direction and industry insights, addressing specific needs for cannabis laboratories. Kirsten Blake, director of sales at Emerald Scientific, believes that proficiency testing is the first step in bringing consistency to cannabis analytics. “The goal is to create some level of industry standards for testing,” says Blake. Participants in the program will be given data sets, judged by a consensus mean, so labs can see their score compared to the rest of the cannabis testing industry. Proficiency tests like The Emerald Test give labs the ability to view how consistent their results are compared to the industry’s results overall. According to Ludwig, the results were pleasantly surprising. “The results were better than expected across the board; the vast majority of labs were within the acceptable range,” says Ludwig. The test is anonymous so individual labs can participate freely.

The AOCS cannabis working groups and expert panels are collaborating with Emerald Scientific to provide data analytics reports compliant with ISO 13528. “In the absence of a federal program, we are trying to provide consistency in cannabis testing to protect consumer safety,” says Ludwig. At the AOCS annual meeting, many echoed those concerns of consumer safety, proposing solutions to the current inconsistencies in testing standards.

The Practical Chemist

Calibration – The Foundation of Quality Data

By Amanda Rigdon
1 Comment

This column is devoted to helping cannabis analytical labs generate valid data right now with a relatively small amount of additional work. The topic for this article is instrument calibration – truly the foundation of all quality data. Calibration is the basis for all measurement, and it is absolutely necessary for quantitative cannabis analyses including potency, residual solvents, terpenes, and pesticides.

Just like a simple alarm clock, all analytical instruments – no matter how high-tech – will not function properly unless they are calibrated. When we set our alarm clock to 6AM, that alarm clock will sound reproducibly every 24 hours when it reads 6AM, but unless we set the correct current time on the clock based on some known reference, we can’t be sure when exactly the alarm will sound. Analytical instruments are the same. Unless we calibrate the instrument’s signal (the response) from the detector to a known amount of reference material, the instrument will not generate an accurate or valid result.

Without calibration, our result may be reproducible – just like in our alarm clock example – but the result will have no meaning unless the result is calibrated against a known reference. Every instrument that makes a quantitative measurement must be calibrated in order for that measurement to be valid. Luckily, the principle for calibration of chromatographic instruments is the same regardless of detector or technique (GC or LC).

Before we get into the details, I would like to introduce one key concept:

Every calibration curve for chromatographic analyses is expressed in terms of response and concentration. For every detector the relationship between analyte (e.g. a compound we’re analyzing) concentration and response is expressible mathematically – often a linear relationship.

Now that we’ve introduced the key concept behind calibration, let’s talk about the two most common and applicable calibration options.

Single Point Calibration

This is the simplest calibration option. Essentially, we run one known reference concentration (the calibrator) and calculate our sample concentrations based on this single point. Using this method, our curve is defined by two points: our single reference point, and zero. That gives us a nice, straight line defining the relationship between our instrument response and our analyte concentration all the way from zero to infinity. If only things were this easy. There are two fatal flaws of single point calibrations:

  1. We assume a linear detector response across all possible concentrations
  2. We assume at any concentration greater than zero, our response will be greater than zero

Assumption #1 is never true, and assumption #2 is rarely true. Generally, single point calibration curves are used to conduct pass/fail tests where there is a maximum limit for analytes (i.e. residual solvents or pesticide screening). Usually, quantitative values are not reported based on single point calibrations. Instead, reports are generated in relation to our calibrator, which is prepared at a known concentration relating to a regulatory limit, or the instrument’s LOD. Using this calibration method, we can accurately report that the sample contains less than or greater than the regulatory limit of an analyte, but we cannot report exactly how much of the analyte is present. So how can we extend the accuracy range of a calibration curve in order to report quantitative values? The answer to this question brings us to the other common type of calibration curve.

Multi-Point Calibration:

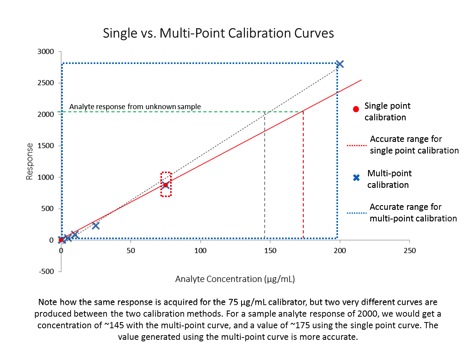
A multi-point calibration curve is the most common type used for quantitative analyses (e.g. analyses where we report a number). This type of curve contains several calibrators (at least 3) prepared over a range of concentrations. This gives us a calibration curve (sometimes a line) defined by several known references, which more accurately expresses the response/concentration relationship of our detector for that analyte. When preparing a multi-point calibration curve, we must be sure to bracket the expected concentration range of our analytes of interest, because once our sample response values move outside the calibration range, the results calculated from the curve are not generally considered quantitative.

The figure below illustrates both kinds of calibration curves, as well as their usable accuracy range:

Calibration Figure 1

This article provides an overview of the two most commonly used types of calibration curves, and discusses how they can be appropriately used to report data. There are two other important topics that were not covered in this article concerning calibration curves: 1) how can we tell whether or not our calibration curve is ‘good’ and 2) calibrations aren’t permanent – instruments must be periodically re-calibrated. In my next article, I’ll cover these two topics to round out our general discussion of calibration – the basis for all measurement. If you have any questions about this article or would like further details on the topic presented here, please feel free to contact me at amanda.rigdon@restek.com.

amandarigdon
The Practical Chemist

Easy Ways to Generate Scientifically Sound Data

By Amanda Rigdon
1 Comment
amandarigdon

I have been working with the chemical analysis side of the cannabis industry for about six years, and I have seen tremendous scientific growth on the part of cannabis labs over that time. Based on conversations with labs and the presentations and forums held at cannabis analytical conferences, I have seen the cannabis analytical industry move from asking, “how do we do this analysis?” to asking “how do we do this analysis right?” This change of focus represents a milestone in the cannabis industry; it means the industry is growing up. Growing up is not always easy, and that is being reflected now in a new focus on understanding and addressing key issues such as pesticides in cannabis products, and asking important questions about how regulation of cannabis labs will occur.

While sometimes painful, growth is always good. To support this evolution, we are now focusing on the contribution that laboratories make to the safety of the cannabis consumer through the generation of quality data. Much of this focus has been on ensuring scientifically sound data through regulation. But Restek is neither a regulatory nor an accrediting body. Restek is dedicated to helping analytical chemists in all industries and regulatory environments produce scientifically sound data through education, technical support and expert advice regarding instrumentation and supplies. I have the privilege of supporting the cannabis analytical testing industry with this goal in mind, which is why I decided to write a regular column detailing simple ways analytical laboratories can improve the quality of their chromatographic data right now, in ways that are easy to implement and are cost effective.

Anyone with an instrument can perform chromatographic analysis and generate data. Even though results are generated, these results may not be valid. At the cannabis industry’s current state, no burden of proof is placed on the analytical laboratory regarding the validity of its results, and there are few gatekeepers between those results and the consumer who is making decisions based on them. Even though some chromatographic instruments are super fancy and expensive, the fact is that every chromatographic instrument – regardless of whether it costs ten thousand or a million dollars – is designed to spit out a number. It is up to the chemist to ensure that number is valid.

In the first couple of paragraphs of this article, I used terms to describe ‘good’ data like ‘scientifically-sound’ or ‘quality’, but at the end of the day, the definition of ‘good’ data is valid data. If you take the literal meaning, valid data is justifiable, logically correct data. Many of the laboratories I have had the pleasure of working with over the years are genuinely dedicated to the production of valid results, but they also need to minimize costs in order to remain competitive. The good news is that laboratories can generate valid scientific results without breaking the bank.

In each of my future articles, I will focus on one aspect of valid data generation, such as calibration and internal standards, explore it in practical detail and go over how that aspect can be applied to common cannabis analyses. The techniques I will be writing about are applied in many other industries, both regulated and non-regulated, so regardless of where the regulations in your state end up, you can already have a head start on the analytical portion of compliance. That means you have more time to focus on the inevitable paperwork portion of regulatory compliance – lucky you! Stay tuned for my next column on instrument calibration, which is the foundation for producing quality data. I think it will be the start of a really good series and I am looking forward to writing it.