Tag Archives: hplc

amandarigdon
The Nerd Perspective

‘Instant’ Cannabis Potency Testing: Different Approaches from Different Manufacturers

By Amanda Rigdon
5 Comments
amandarigdon

This is the first piece of a regular column that CIJ has been so kind to allow me to write for their publication. Some readers might recognize my name from The Practical Chemist column in this publication. Since the inception of that column, I’ve finally taken the plunge into the cannabis industry as chief technical officer of Emerald Scientific. Unlike The Practical Chemist, I will not spend the entire first article introducing the column. The concept is simple: while I find the textbook-esque content of The Practical Chemist scintillating, I have a feeling that the content is a little too heavy to spring on someone who is looking for engaging articles over their precious coffee break. Instead, The Nerd Perspective will consist of less-technical writing focusing on my experience and insights for the cannabis industry as a whole. But don’t worry – I’m sure I will not be able to refrain from technical jargon altogether.

To kick off the column, I want to talk about instrumentation for ‘instant’ cannabis potency testing. At this point, it’s common knowledge in the cannabis analytics industry that the most accurate way to test cannabis potency is through extraction then analysis by HPLC-UV. I agree wholeheartedly with that sentiment, but HPLC analyses have one drawback: they can be either inexpensive or fast – not both. There are some instruments entering the market now that– while not as directly quantitative as HPLC-UV – promise to solve the inexpensive/fast conundrum. During my most recent trip to California, I was able to spend some quality time with two well-known instrument manufacturers: SRI Instruments and PerkinElmer, both of whom manufacture instruments that perform fast, inexpensive cannabis potency analyses. From my previous home at the heights of The Ivory Tower of Chromatography: Home of the Application Chemists, SRI and PE couldn’t be more different. But as seen through the eyes of a company who deals with a wide range of customers and analytical needs, it turns out that SRI and PE are much the same – not only in their open and honest support of the cannabis industry, but also in terms of their love of all things technical.

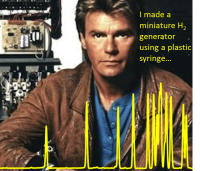
My first stop was SRI Instruments. They are a relatively small company located in an unassuming building in Torrance, CA. Only a few people work in that location, and I spent my time with Hugh Goldsmith (chief executive officer) and Greg Benedict (tech service guru). I have worked with these guys for a few years now, and since the beginning, I have lovingly referred to them as the MacGyvers of chromatography. Anyone familiar with SRI GCs knows that what they lack in aesthetics, they make up for in practicality – these instruments truly reflect Hugh and Greg’s character (that’s meant as a compliment).

SRI specializes in relatively inexpensive portable and semi-portable instruments that are easy to set up, easy to operate, and most importantly – engineered for a purpose. It’s actually really hard to manufacture an instrument that meets all three of these criteria, and the folks at SRI accomplish this with their passionate and unique approach to problem solving. What I love about these guys is that for them, nothing is impossible. Here’s an example: the price of the portable GC-FID instruments SRI builds is inflated because the instruments require separate – and pricey – hydrogen generators. That’s a big problem – hydrogen generators are all pretty much the same, and none of them are cheap. This didn’t faze SRI: they just decided to design their own super small on-board hydrogen generator capable of supplying hydrogen to a simple GC macgyversystem for six hours with just 20mL of distilled water from the grocery store! I’m not kidding – I saw it in action on their new Model 420 GC (more on that in some future pieces). Was the final product pretty? Not in the least. Did it work? Absolutely. This kind of MacGyver-esque problem solving can only be done successfully with a deep understanding of the core principles behind the problem. What’s more, in order to engineer instruments like these, SRI has to have mastery over the core principles of not only chromatographic separation, but also of software development, electrical engineering, and mechanical engineering – just to name a few. These quirky, unassuming guys are smart. SRI is a company that’s been unapologetically true to themselves for decades; they’ll never be a contender for beauty queen, but they get the job done.
On the surface, PerkinElmer (PE) contrasts with SRI in almost every way possible. With revenue measured in billions of dollars and employees numbering in the thousands, PE is a behemoth that plays not only in the analytical chemistry industry but also in clinical diagnostics and other large industries. Where SRI instruments have a characteristic look of familiar homeliness, PE instruments are sleek and sexy. However, PerkinElmer and SRI are more alike than it would seem; just like the no-frills SRI, the hyper-technical PE instruments are engineered for a purpose by teams of very smart, passionate people.
DoogieWith its modest price tag and manual sample introduction, the SRI Model 420 is engineered for lower throughput users to be a fast, simple, and inexpensive approach to semi-quantitative process control. The purpose of the instruments manufactured by PE is to produce the highest-quality quantitative results as quickly as possible for high-throughput labs. PE instruments are built using the best technology available in order to eke out every last ounce of quantitative accuracy and throughput possible. Fancy technology is rarely inexpensive, and neither is rigorous product development that can last years in some cases. In a way, PE is Doogie Howser to SRI’s MacGyver. Like MacGyver, Doogie is super smart, and his setting is a sterile hospital rather than a warzone.

I had a wonderful conversation with Tim Ruppel, PE’s headspace-GC specialist, on the sample introduction technology incorporated into the TurboMatrix Headspace Sampler, where I also learned that the basic technology for all PerkinElmer headspace-GC instruments was designed by the men who wrote The Book on headspace gas chromatography: Bruno Kolb and Leslie Ettre**. Later, I was able to get a much-needed lesson on FT-IR and the Spectrum Two IR Spectrometer from Brian Smith, PE’s spectroscopy expert, who actually wrote the book on quantitative spectroscopy***. Tim and Brian’s excitement over their technology mirrored that of Hugh and Greg. It turns out that SRI and PerkinElmer are more alike than I thought.

These two instrument manufacturers have addressed the fast/inexpensive conundrum of cannabis potency testing in two different ways: SRI’s instrument is extremely inexpensive, easy to operate, and will provide semi-quantitative values for THC, CBD, and CBN in just a few minutes; PE’s instrument is more expensive up front, but provides quantitative (though not directly quantitative) values for all of the major cannabinoids almost instantly, and requires almost no maintenance or consumables. These two instruments were designed for specific uses: one for inexpensive, easy use, and the other for more comprehensive results with a higher initial investment. The question consumers have to ask themselves is “Who do I need to solve my problem?” For some, the answer will be MacGyver, and for others, Doogie Howser will provide the solution – after all, both are heroes.


** B. Kolb, L. Ettre, Static Headspace-Gas Chromatography: Theory and Practice, John Wiley & Sons, Hoboken, NJ, 2006.

*** Brian C. Smith, Quantitative Spectroscopy: Theory and Practice, Elsevier, Boston, MA, 2002.

From The Lab

HPLC Column Selection for Cannabis Chromatographers

By Danielle Mackowsky
2 Comments

If your laboratory utilizes an HPLC system for cannabinoid and pesticide analysis, it can be a daunting task to select a stationary phase that is both practical and sufficient for the separation at hand. Typically, when developing a new method, an analyst will either evaluate a column they already have in house or seek out a referenced phase/dimension in the literature before exploring other available alternatives.

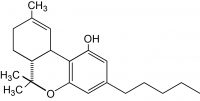
Tetrahydrocannabinol (THC)
Chemical structure of Tetrahydrocannabinol (THC)

A C18 phase is an excellent first choice for non-polar or slightly polar compounds. If the analyte in question has a minimum ratio of three carbon atoms for every heteroatom, it will be sufficiently retained on this phase. THC and other relative cannabinoids are prime candidates for separation via C18 due to their non-polar nature and structural components.

In addition to a universal C18 phase, alternative selectivity options do exist for laboratories concerned with the analysis of cannabinoid content. Another prevalent column choice features an aromatic or poly-aromatic stationary phase. Compatible with highly aqueous mobile phases, aromatic and poly-aromatic columns primarily rely on hydrophobic and π-π interactions as their main analyte retention mechanisms. Poly-aromatic phases provide enhanced retention and are more hydrophobic when compared to a single phenyl ring structure. While C18 phases are not ideal for resolving structural isomers, poly-aromatic columns are capable of separating these ring-based compounds. Chromatographers with a background in forensic analysis may be very familiar with this type of HPLC column due to its extensive use in drug testing applications.

Chemical structure of chlormequat, a hazardous polar pesticide commonly banned for use in cannabis cultivation

Besides cannabinoid content, many cannabis scientists are equally concerned with accurate quantitation of pesticides within a given sample. Many pesticides that have found themselves on regulatory lists in states such as Massachusetts, Washington or Nevada are extremely polar. In order to increase retention of these compounds, and thus improve your overall chromatographic method, it can be extremely advantageous to select a column that allows you to start your gradient at 100% aqueous mobile phase. An aqueous or polar modified C18 column contains an embedded polar group, polar side chain or polar end-capping to allow for separation of polar compounds, while still retaining and resolving non-polar analytes. For laboratories that necessitate the use of only one analytical column, an aqueous C18 phase will allow for separation of monitored pesticides without compromising the quality of cannabinoid data produced.

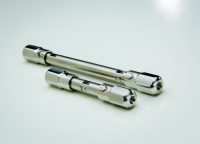
One must also take into account column length, pore size and particle size when purchasing a column. For the purposes of any cannabis related analysis, a pore size of 100-120Å will suffice. Larger pore columns are typically reserved for large peptides, proteins and polymers. Depending on the sensitivity and resolution needed within your laboratory, particle size can range from 1.8-5um, with the highest sensitivity and resolution coming from the smaller particle size. Core shell technology is also a popular option for laboratories who want to keep the pressure of their HPLC system low, without sacrificing any quality of their resolution. Column lengths of 50 or 100 mm are common for chromatographers who want to achieve sufficient sample separation while keeping their run times relatively short.UCTcolumns

Regardless of the HPLC phase selected, it is very important that a guard cartridge is also used. Guard cartridges are traditionally the same phase and particle size of the HPLC column choice and help to prolong analytical column life. They provide additional sample clean up and are widely recommended by the majority of chromatography experts. Upon reviewing one’s options for HPLC phases and acquiring the necessary guard column, your cannabis laboratory will be ready to get the most out of your HPLC system for your analysis needs.

amandarigdon
The Practical Chemist

Calibration Part II – Evaluating Your Curves

By Amanda Rigdon
No Comments
amandarigdon

Despite the title, this article is not about weight loss – it is about generating valid analytical data for quantitative analyses. In the last installment of The Practical Chemist, I introduced instrument calibration and covered a few ways we can calibrate our instruments. Just because we have run several standards across a range of concentrations and plotted a curve using the resulting data, it does not mean our curve accurately represents our instrument’s response across that concentration range. In order to be able to claim that our calibration curve accurately represents our instrument response, we have to take a look at a couple of quality indicators for our curve data:

  1. correlation coefficient (r) or coefficient of determination (r2)
  2. back-calculated accuracy (reported as % error)

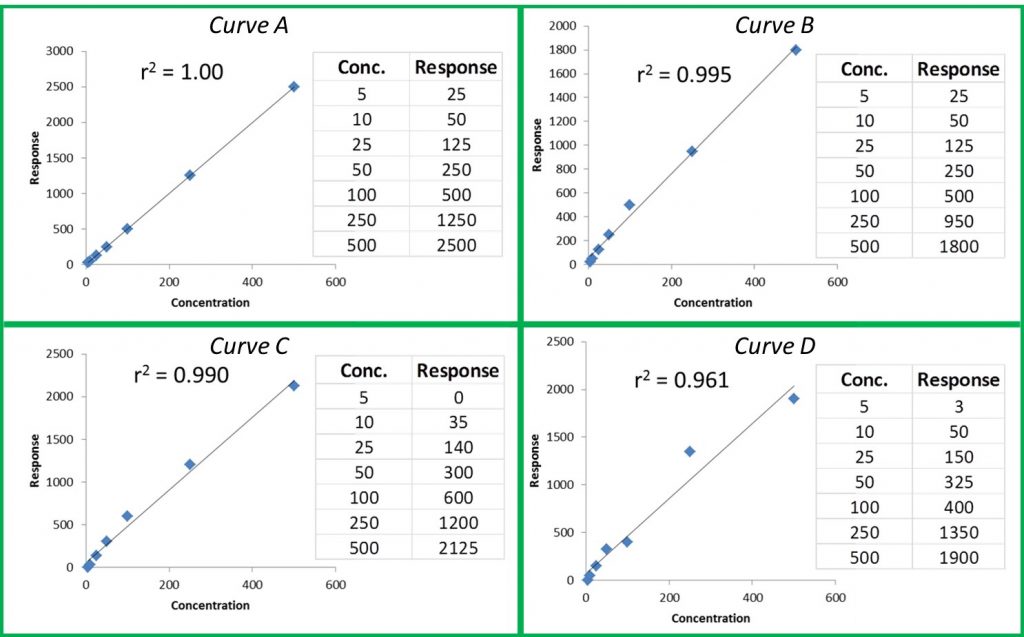
The r or r2 values that accompany our calibration curve are measurements of how closely our curve matches the data we have generated. The closer the values are to 1.00, the more accurately our curve represents our detector response. Generally, r values ≥0.995 and r2 values ≥ 0.990 are considered ‘good’. Figure 1 shows a few representative curves, their associated data, and r2 values (concentration and response units are arbitrary).

Figure 1: Representative Curves and r2 values

Let’s take a closer look at these curves:

Curve A: This represents a case where the curve perfectly matches the instrument data, meaning our calculated unknown values will be accurate across the entire calibration range.

Curve B: The r2 value is good and visually the curve matches most of the data points pretty well. However, if we look at our two highest calibration points, we can see that they do not match the trend for the rest of the data; the response values should be closer to 1250 and 2500. The fact that they are much lower than they should be could indicate that we are starting to overload our detector at higher calibration levels; we are putting more mass of analyte into the detector than it can reliably detect. This is a common problem when dealing with concentrated samples, so it can occur especially for potency analyses.

Curve C: We can see that although our r2 value is still okay, we are not detecting analytes as we should at the low end of our curve. In fact, at our lowest calibration level, the instrument is not detecting anything at all (0 response at the lowest point). This is a common problem with residual solvent and pesticide analyses where detection levels for some compounds like benzene are very low.

Curve D: It is a perfect example of our curve not representing our instrument response at all. A curve like this indicates a possible problem with the instrument or sample preparation.

So even if our curve looks good, we could be generating inaccurate results for some samples. This brings us to another measure of curve fitness: back-calculated accuracy (expressed as % error). This is an easy way to determine how accurate your results will be without performing a single additional run.

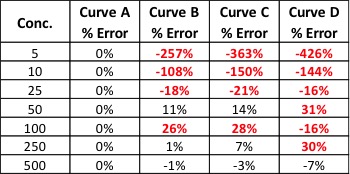
Back-calculated accuracy simply plugs the area values we obtained from our calibrators back into the calibration curve to see how well our curve will calculate these values in relation to the known value. We can do this by reprocessing our calibrators as unknowns or by hand. As an example, let’s back-calculate the concentration of our 500 level calibrator from Curve B. The formula for that curve is: y = 3.543x + 52.805. If we plug 1800 in for y and solve for x, we end up with a calculated concentration of 493. To calculate the error of our calculated value versus the true value, we can use the equation: % Error = [(calculated value – true value)/true value] * 100. This gives us a % error of -1.4%. Acceptable % error values are usually ±15 – 20% depending on analysis type. Let’s see what the % error values are for the curves shown in Figure 1.

practical chemist table 1
Table 1: % Error for Back-Calculated Values for Curves A – D

Our % error values have told us what our r2 values could not. We knew Curve D was unacceptable, but now we can see that Curves B and C will yield inaccurate results for all but the highest levels of analyte – even though the results were skewed at opposite ends of the curves.

There are many more details regarding generating calibration curves and measuring their quality that I did not have room to mention here. Hopefully, these two articles have given you some tools to use in your lab to quickly and easily improve the quality of your data. If you would like to learn more about this topic or have any questions, please don’t hesitate to contact me at amanda.rigdon@restek.com.

AOCS Highlights Cannabis Lab Standards, Extraction Technology

By Aaron G. Biros
No Comments

The American Oil Chemists’ Society (AOCS) held its annual conference in Salt Lake City this week, with a track focused on cannabis testing and technology. Cynthia Ludwig, director of technical services at AOCS and member of the advisory panel to The Emerald Test, hosted the two-day event dedicated to all things extraction technology and analytical testing of cannabis.

Highlights in the discussion surrounding extraction technologies for the production of cannabis concentrates included the diversity of concentrate products, solvent selection for different extraction techniques and the need for cleaning validation in extraction equipment. Jerry King, Ph.D., research professor at the University of Arkansas, began the event with a brief history of cannabis processing, describing the physical morphologies in different types of extraction processes.

J. Michael McCutcheon presents a history of cannabis in medicine

Michael McCutcheon, research scientist at Eden Labs, laid out a broad comparison of different extraction techniques and solvents in use currently. “Butane is a great solvent; it’s extremely effective at extracting active compounds from cannabis, but it poses considerable health, safety and environmental concerns largely due to its flammability,” says McCutcheon. He noted it is also very difficult to get USP-grade butane solvents so the quality can be lacking. “As a solvent, supercritical carbon dioxide can be better because it is nontoxic, nonflammable, readily available, inexpensive and much safer.” The major benefit of using supercritical carbon dioxide, according to McCutcheon, is its ability for fine-tuning, allowing the extractor to be more selective and produce a wider range of product types. “By changing the temperature or pressure, we can change the density of the solvent and thus the solubility of the many different compounds in cannabis.” He also noted that, supercritical carbon dioxide exerts tremendous pressure, as compared to hydrocarbon solvents, so the extraction equipment needs to be rated to a higher working pressure and is generally more expensive.

John A. Mackay, Ph.D., left at the podium and Jerry King, Ph.D., on the right

John A. Mackay, Ph.D., senior director of strategic technologies at Waters Corporation, believes that cannabis processors using extraction equipment need to implement cleaning SOPs to prevent contamination. “There is currently nothing in the cannabis industry like the FDA CMC draft for the botanical industry,” says Mackay. “If you are giving a child a high-CBD extract and it was produced in equipment that was previously used for another strain that contains other compounds, such as CBG, CBD or even traces of THC extract, there is a high probability that it will still contain these compounds as well as possibly other contaminants unless it was properly cleaned.” Mackay’s discussion highlighted the importance of safety and health for workers throughout the workflow as well as the end consumer.

Jeffrey Raber, Ph.D., chief executive officer of The Werc Shop, examined different testing methodologies for different applications, including potency analyses with liquid chromatography. His presentation was markedly unique in proposing a solution to the currently inconsistent classification system for cannabis strains. “We really do not know what strains cause what physiological responses,” says Raber. “We need a better classification system based on chemical fingerprints, not on baseless names.” Raber suggests using a chemotaxonomic system to identify physiological responses in strains, noting that terpenes could be the key to these responses.

Cynthia Ludwig welcomes attendees to the event.

Dylan Wilks, chief scientific officer at Orange Photonics, discussed the various needs in sample preparation for a wide range of products. He focused on sample prep and variation for on-site potency analysis, which could give edibles manufacturers crucial quality assurance tools in process control. Susan Audino, Ph.D., chemist and A2LA assessor, echoed Wilks’ concerns over sample collection methods. “Sampling can be the most critical part of the analysis and the sample size needs to be representative of the batch, which is currently a major issue in the cannabis industry,” says Audino. “I believe that the consumer has a right to know that what they are ingesting is safe.” Many seemed to share her sentiment about the current state of the cannabis testing industry. “Inadequate testing is worse than no testing at all and we need to educate the legislators about the importance of consumer safety.”

46 cannabis laboratories participated in The Emerald Test’s latest round of proficiency testing for potency and residual solvents. Cynthia Ludwig sits on the advisory panel to give direction and industry insights, addressing specific needs for cannabis laboratories. Kirsten Blake, director of sales at Emerald Scientific, believes that proficiency testing is the first step in bringing consistency to cannabis analytics. “The goal is to create some level of industry standards for testing,” says Blake. Participants in the program will be given data sets, judged by a consensus mean, so labs can see their score compared to the rest of the cannabis testing industry. Proficiency tests like The Emerald Test give labs the ability to view how consistent their results are compared to the industry’s results overall. According to Ludwig, the results were pleasantly surprising. “The results were better than expected across the board; the vast majority of labs were within the acceptable range,” says Ludwig. The test is anonymous so individual labs can participate freely.

The AOCS cannabis working groups and expert panels are collaborating with Emerald Scientific to provide data analytics reports compliant with ISO 13528. “In the absence of a federal program, we are trying to provide consistency in cannabis testing to protect consumer safety,” says Ludwig. At the AOCS annual meeting, many echoed those concerns of consumer safety, proposing solutions to the current inconsistencies in testing standards.