Tag Archives: laboratory

amandarigdon
The Practical Chemist

Internal Standards– Turning Good Data Into Great Data

By Amanda Rigdon
2 Comments
amandarigdon

Everyone likes to have a safety net, and scientists are no different. This month I will be discussing internal standards and how we can use them not only to improve the quality of our data, but also give us some ‘wiggle room’ when it comes to variation in sample preparation. Internal standards are widely used in every type of chromatographic analysis, so it is not surprising that their use also applies to common cannabis analyses. In my last article, I wrapped up our discussion of calibration and why it is absolutely necessary for generating valid data. If our calibration is not valid, then the label information that the cannabis consumer sees will not be valid either. These consumers are making decisions based on that data, and for the medical cannabis patient, valid data is absolutely critical. Internal standards work with calibration curves to further improve data quality, and luckily it is very easy to use them.

So what are internal standards? In a nutshell, they are non-analyte compounds used to compensate for method variations. An internal standard can be added either at the very beginning of our process to compensate for variations in sample prep and instrument variation, or at the very end to compensate only for instrument variation. Internal standards are also called ‘surrogates’, in some cases, however, for the purposes of this article, I will simply use the term ‘internal standard.’

Now that we know what internal standards are, lets look at how to use them. We use an internal standard by adding it to all samples, blanks, and calibrators at the same known concentration. By doing this, we now have a single reference concentration for all response values produced by our instrument. We can use this reference concentration to normalize variations in sample preparation and instrument response. This becomes very important for cannabis pesticide analyses that involve lots of sample prep and MS detectors. Figure 1 shows a calibration curve plotted as we saw in the last article (blue diamonds), as well as the response for an internal standard added to each calibrator at a level of 200ppm (green circles). Additionally, we have three sample results (red triangles) plotted against the calibration curve with their own internal standard responses (green Xs).
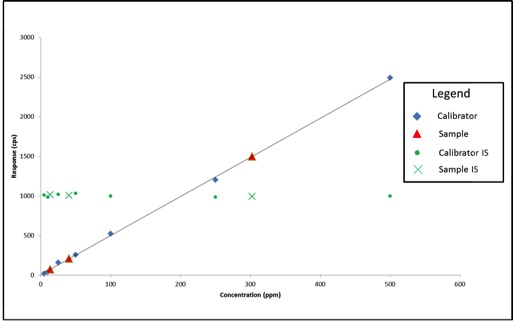
Figure 1: Calibration Curve with Internal Standard Responses and Three Sample Results

In this case, our calibration curve is beautiful and passes all of the criteria we discussed in the previous article. Lets assume that the results we calculate for our samples are valid – 41ppm, 303ppm, and 14ppm. Additionally, we can see that the responses for our internal standards make a flat line across the calibration range because they are present at the same concentration in each sample and calibrator. This illustrates what to expect when all of our calibrators and samples were prepared correctly and the instrument performed as expected. But lets assume we’re having one of those days where everything goes wrong, such as:

  • We unknowingly added only half the volume required for cleanup for one of the samples
  • The autosampler on the instrument was having problems and injected the incorrect amount for the other two samples

Figure 2 shows what our data would look like on our bad day.
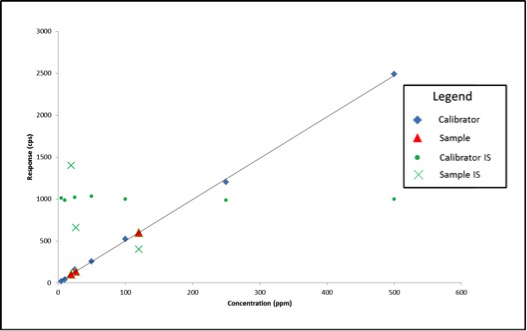
Figure 2: Calibration Curve with Internal Standard Responses and Three Sample Results after Method Errors

We experienced no problems with our calibration curve (which is common when using solvent standard curves), therefore based on what we’ve learned so far, we would simply move on and calculate our sample results. The sample results this time are quite different: 26ppm, 120ppm, and 19ppm. What if these results are for a pesticide with a regulatory cutoff of 200ppm? When measured accurately, the concentration of sample 2 is 303ppm. In this example, we may have unknowingly passed a contaminated product on to consumers.

In the first two examples, we haven’t been using our internal standard – we’ve only been plotting its response. In order to use the internal standard, we need to change our calibration method. Instead of plotting the response of our analyte of interest versus its concentration, we plot our response ratio (analyte response/internal standard response) versus our concentration ratio (analyte concentration/internal standard concentration). Table 1 shows the analyte and internal standard response values for our calibrators and samples from Figure 2.
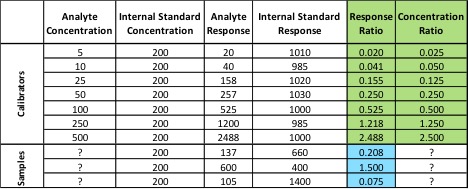
 

Table 1: Values for Calibration Curve and Samples Using Internal Standard

The values highlighted in green are what we will use to build our calibration curve, and the values in blue are what we will use to calculate our sample concentration. Figure 3 shows what the resulting calibration curve and sample points will look like using an internal standard.
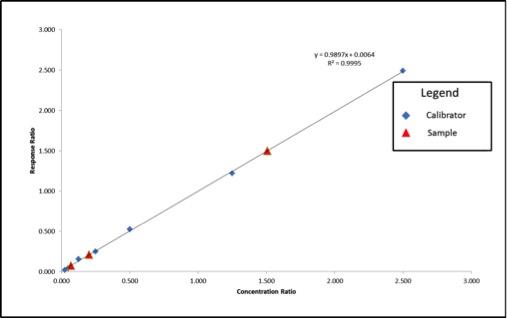
Figure 3: Calibration Curve and Sample Results Calculated Using Internal Standard Correction

We can see that our axes have changed for our calibration curve, so the results that we calculate from the curve will be in terms of concentration ratio. We calculate these results the same way we did in the previous article, but instead of concentrations, we end up with concentration ratios. To calculate the sample concentration, simply multiply by the internal standard amount (200ppm). Figure 4 shows an example calculation for our lowest concentration sample.
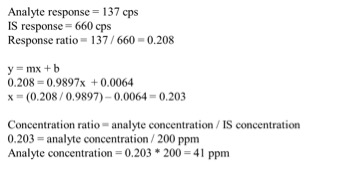
Figure 4: Example Calculation for Sample Results for Internal-Standard Corrected Curve

Using the calculation shown in Figure 4, our sample results come out to be 41ppm, 302ppm, and 14ppm, which are accurate based on the example in Figure 1. Our internal standards have corrected the variation in our method because they are subjected to that same variation.

As always, there’s a lot more I can talk about on this topic, but I hope this was a good introduction to the use of internal standards. I’ve listed couple of resources below with some good information on the use of internal standards. If you have any questions on this topic, please feel free to contact me at amanda.rigdon@restek.com.


Resources:

When to use an internal standard: http://www.chromatographyonline.com/when-should-internal-standard-be-used-0

Choosing an internal standard: http://blog.restek.com/?p=17050

amandarigdon
The Practical Chemist

Calibration Part II – Evaluating Your Curves

By Amanda Rigdon
No Comments
amandarigdon

Despite the title, this article is not about weight loss – it is about generating valid analytical data for quantitative analyses. In the last installment of The Practical Chemist, I introduced instrument calibration and covered a few ways we can calibrate our instruments. Just because we have run several standards across a range of concentrations and plotted a curve using the resulting data, it does not mean our curve accurately represents our instrument’s response across that concentration range. In order to be able to claim that our calibration curve accurately represents our instrument response, we have to take a look at a couple of quality indicators for our curve data:

  1. correlation coefficient (r) or coefficient of determination (r2)
  2. back-calculated accuracy (reported as % error)

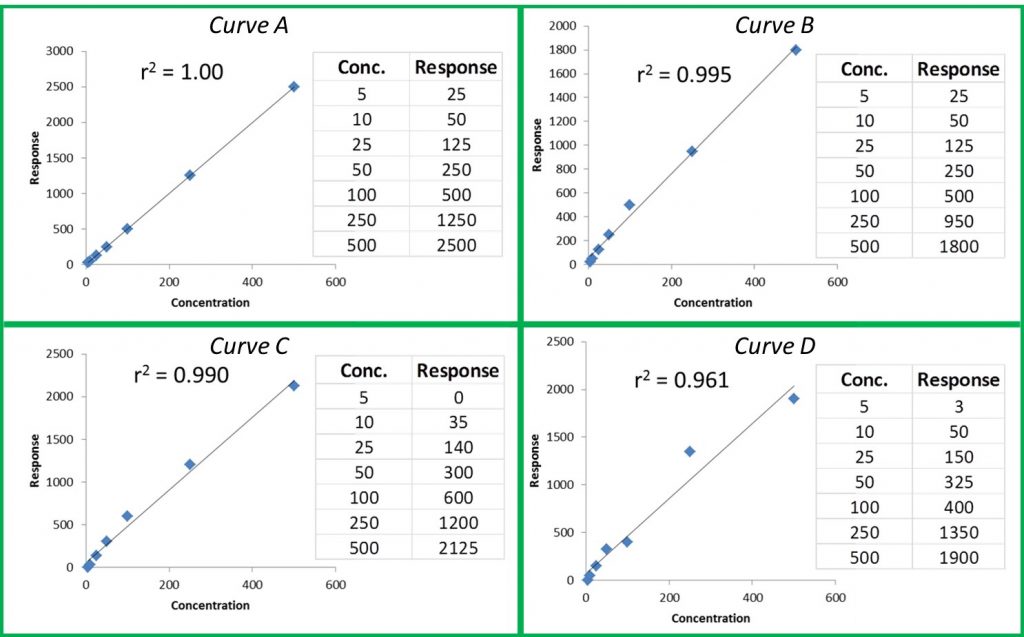
The r or r2 values that accompany our calibration curve are measurements of how closely our curve matches the data we have generated. The closer the values are to 1.00, the more accurately our curve represents our detector response. Generally, r values ≥0.995 and r2 values ≥ 0.990 are considered ‘good’. Figure 1 shows a few representative curves, their associated data, and r2 values (concentration and response units are arbitrary).

Figure 1: Representative Curves and r2 values

Let’s take a closer look at these curves:

Curve A: This represents a case where the curve perfectly matches the instrument data, meaning our calculated unknown values will be accurate across the entire calibration range.

Curve B: The r2 value is good and visually the curve matches most of the data points pretty well. However, if we look at our two highest calibration points, we can see that they do not match the trend for the rest of the data; the response values should be closer to 1250 and 2500. The fact that they are much lower than they should be could indicate that we are starting to overload our detector at higher calibration levels; we are putting more mass of analyte into the detector than it can reliably detect. This is a common problem when dealing with concentrated samples, so it can occur especially for potency analyses.

Curve C: We can see that although our r2 value is still okay, we are not detecting analytes as we should at the low end of our curve. In fact, at our lowest calibration level, the instrument is not detecting anything at all (0 response at the lowest point). This is a common problem with residual solvent and pesticide analyses where detection levels for some compounds like benzene are very low.

Curve D: It is a perfect example of our curve not representing our instrument response at all. A curve like this indicates a possible problem with the instrument or sample preparation.

So even if our curve looks good, we could be generating inaccurate results for some samples. This brings us to another measure of curve fitness: back-calculated accuracy (expressed as % error). This is an easy way to determine how accurate your results will be without performing a single additional run.

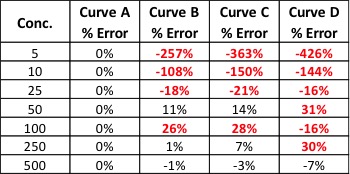
Back-calculated accuracy simply plugs the area values we obtained from our calibrators back into the calibration curve to see how well our curve will calculate these values in relation to the known value. We can do this by reprocessing our calibrators as unknowns or by hand. As an example, let’s back-calculate the concentration of our 500 level calibrator from Curve B. The formula for that curve is: y = 3.543x + 52.805. If we plug 1800 in for y and solve for x, we end up with a calculated concentration of 493. To calculate the error of our calculated value versus the true value, we can use the equation: % Error = [(calculated value – true value)/true value] * 100. This gives us a % error of -1.4%. Acceptable % error values are usually ±15 – 20% depending on analysis type. Let’s see what the % error values are for the curves shown in Figure 1.

practical chemist table 1
Table 1: % Error for Back-Calculated Values for Curves A – D

Our % error values have told us what our r2 values could not. We knew Curve D was unacceptable, but now we can see that Curves B and C will yield inaccurate results for all but the highest levels of analyte – even though the results were skewed at opposite ends of the curves.

There are many more details regarding generating calibration curves and measuring their quality that I did not have room to mention here. Hopefully, these two articles have given you some tools to use in your lab to quickly and easily improve the quality of your data. If you would like to learn more about this topic or have any questions, please don’t hesitate to contact me at amanda.rigdon@restek.com.

derekpeterson

Terra Tech Expands, Maintains Quality: A Q&A with CEO Derek Peterson

By Aaron G. Biros
No Comments
derekpeterson
derekpeterson
Derek Peterson, chief executive officer of Terra Tech

Terra Tech, with the recent acquisition of Blum, a dispensary in Oakland, and the line of concentrates, IVXX, is sweeping the cannabis industry by setting standards for safety and quality. Terra Tech, publicly traded in the Over-The-Counter market, is well known as an agricultural company, with the subsidiary brand, Edible Garden, selling produce to Whole Foods, Wal-Mart and Kroger’s. In December of last year, we covered Terra Tech’s entrance into the cannabis marketplace and their experience with large-scale, sustainable agriculture. We sit down with Derek Peterson, chief executive officer of Terra Tech, to get an update on their progress and quality controls.

CannabisIndustryJournal: In January, Terra Tech announced revenue guidance of $20-22 million for 2016. Can you share some of your strategy going forward to meet your goals?

rsz_img_2343
Terra Tech is taking organic and GFSI-certified agricultural practices to growing cannabis

Derek Peterson: We have always played both a long game as well as a short game, meaning while we are building our longer term business, like in Nevada, we are also focusing on short term accretive acquisitions, like we did with Blum in Oakland. We want to make sure we capture short-term revenue growth while we plan our future revenue production. We feel confident about achieving those results.

CIJ: How big of a role does the acquisition of Blum and IVXX brand expansion play in meeting those goals?

Blumoakland
The Oakland location of Blum dispensary

Derek: Blum is a significant factor even though we are only capturing three quarters of revenue considering we closed the deal on March 31st of this year. So for the full year of 2017 we will have growth from this level considering we will be able to report a full year of Blum revenue. IVXX presents us with the best opportunity for growth in the coming years. As the market in California and Nevada grows we can continue to expand our IVXX footprint throughout the state. Being able to wholesale to thousands of other retail facilities affords us a significant opportunity to grow our sales.

CIJ: How do you think the brand of Edible Garden positions you well for expansion in the cannabis industry? 

Poinsettias ready for distribution at Edible Garden facility in Belvidere, New Jersey
Produce ready for distribution at Edible Garden facility in Belvidere, New Jersey

Derek: One of the reasons we were so successful in the Nevada market was because regulators and legislators felt a high degree of confidence in our abilities considering we are USDA organic, Kosher and GFSI-certified. Our traditional agricultural experience has been very synergistic with our cannabis division from both an optics and operational perspective.

CIJ: Could you give us an update on progress in Medifarm LLC in Nevada? And on your distribution plan for IVXX in California?

IVXXconcentrates
IVXX concentrates

Derek: We are continuing to expand our IVXX line throughout the state and increasing our sales force. In addition we will continue to develop new products to distribute into our existing supply chain, like we just did with our new pre filled cartridge line.

We are opening our Decatur location in Las Vegas in early July and Reno and Desert Inn towards the end of August. Our cultivation and extraction facilities should be complete no later than January 2017. We will have our entire infrastructure in place if the recreational bill passes in Nevada this November.

Blum Las Vegas location will open in July

CIJ: Tell us about the role of laboratory testing in your business.

Derek: Laboratories play a significant role, as they are becoming a mandated step in most new legislation around the company. Independent lab testing is extremely important to maintain safe access for consumers and patients. We work primarily with Steep Hill Labs and CW analytics.

CIJ: Can you expand on your integrated pest management and your growing practices?

stickerscannabis
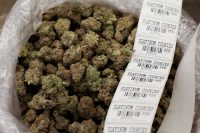
Platinum Cookies ready for packaging and labelling

Derek: Well we cannot say organic, however we do cultivate all naturally. We also cultivate traditional produce that we sell to major retailers. We are USDA organic-certified and we implement similar processes in our cannabis cultivation. Pest control is extremely challenging for any farmer but we rely primarily on bio control, meaning the good bugs eat the bad bugs. This has been very effective for us in the cultivation of all our products.

CIJ: How is your business different from the slew of other dispensaries and growers in California?

Consistency in quality standards requires meticulous SOPs

Derek: Service and consistency; we have over 42,000 registered patients and our operations team has over 19 years of experience in California. One of the reasons we have become one of the largest dispensaries in the state is because of that experience. In addition, consistency is extremely important. Consumers expect the same product in every other business and ours is no different. If they come in for our Platinum Cookies one month and the next month it has different characteristics you are going to lose patient confidence. So in the front of the house, we are focused on pairing patients’ needs with the correct product and in the back of the house we are focused on providing a meticulously cultivated product, produced at the highest standards.

CIJ: Can you delve into some of the processing for concentrates? How do you meet such rigorous quality standards?

IVXX processing
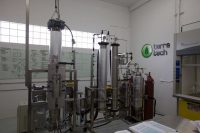
Extraction equipment in one of the processing facilities for IVXX

Derek: Through research and development, we have engineered a proprietary process in which our solvent profiles used under our proprietary conditions ensures solvent residual levels which are not detected by instrumentation at 3rd party testing agencies such as Steep Hill Labs. In addition, any good scientific method requires repetition and corroboration of results. In order to accomplish this we also rely on random routine testing in which we send out extracts out to other 3rd party testing labs. Proprietary conditions include, but are not limited to, heat, vacuum, agitation, etc. By utilizing the correct amalgamation of solvent profiles, extraction conditions, purging conditions, as well as rigorous quality control standards, we are able to ensure a product that is void of any residual solvents, without sacrificing potency or identity of the cannabinoids and terpenes. Cannabinoids and terpenes are of chief interest when extracting cannabis for patients so that they have access to these essential oils without any of the actual leaf and bud.

All solvents used are the highest grade available to us, which ensures a truly medical product for the patient. In addition, all of our extraction equipment is routinely cleaned and sterilized using medical grade cleaning agents.

teganheadshot
Quality From Canada

Secure Software Monitoring — Two Keys to Success

By Tegan Adams
No Comments
teganheadshot

We have two key software platforms at our laboratory that help us stay compliant with our standard operating procedures. Saif Al-Dujaili, quality manager at Eurofins-Experchem, oversees quality assurance in our laboratory. As we like to say, you are safe with Saif.

A Customized Sample Tracking System

Sample-tracking software consists of four main modules:

Tracking samples in our facility: When a sample is booked by our tracking system, a unique identification number is generated by the system and printed on a sticker, which is placed on the sample. When a sample is booked, department heads then have the ability to assign work orders to the analysts through the tracking system.

When testing is complete, results are entered by the analyst into the tracking system and reviewed by the quality assurance (QA) department. QA reviewers are responsible for approving results entered in the system before they are sent to the client. A certificate of analysis is then generated and e-mailed to the client for their review.

Controlling stability studies conducted in our facility: Stability studies are scheduled and controlled on different samples pulled for analysis. Within our facility’s sample-tracking system we have different chamber names with different conditions where products can be placed. Which chamber we place samples in depends on protocols and requests from our client. The software used also generates a unique study number for each stability study that occurs. The stability schedule that includes each study is reviewed every week by the stability coordinator to schedule what samples need to be pulled for testing.

Controlling methods used for tests: Methods are entered into the tracking system after department heads have reviewed them and it is approved by QA. The tracking system generates a unique ID number for each method as well as each sample. The method can now be tracked in our laboratory’s system. Within the software you can enter the name of the method, client name and effective date and any revisions applied to the method.

Controlling inventory of columns and electrodes: Sample tracking also helps us with our purchasing patterns to make sure we have supplies for our client’s testing needs. Every time that columns and electrodes are received, they are entered into our tracking system for inventory purposes.

REES Environmental Monitoring Software

REES is used to monitor the environmental conditions of our testing facility. Key inputs measured include temperature, humidity, differential pressure and elimination or intensity of light. REES is linked to the QA department’s computers. An audible alarm is sounded as well as e-mails sent to QA personnel to notify them if anything is out of specification. REES also phones related personnel’s cell phones to notify them of any alarms. No alarms are missed, even if they occur after working hours. Having a 24-hour environmental monitoring system in place helps Eurofins-Experchem ensure integrity in operations of stability, microbiological and other environmental conditions essential for accuracy in testing results.

gummyquechersdspE

How Potent is Your Product: Getting Educated on Edibles Analysis

By Danielle Mackowsky
No Comments
gummyquechersdspE

As a result of the rapidly developing cannabis industry, many forensic toxicology labs are looking for fast, reliable and cost-effective methods to determine cannabis potency and pesticide residue in edibles. Although the pros and cons of legalization are still heavily debated throughout the country, all scientists agree that uniform testing policies and procedures need to be established as soon as possible.

Within environmental and food testing laboratories, the use of QuEChERS (Quick, Easy, Cheap, Effective, Rugged, and Safe) has been practiced widely for the past 15 years. In 2003, Dr.’s Michelangelo Anastassiades and Steven Lehotay published the first QuEChERS application, which detailed the determination of pesticide residues in produce. Since then, QuEChERS has become the gold standard for the testing and analysis of a wide variety of edible matrices. United Chemical Technologies (UCT) was the first company to commercialize the product and it became apparent that the application of this technology to cannabis edibles was a natural solution to pesticide residue testing. All of the data from the QuEChERS cannabis edibles pesticide and potency analyses can be found here.

Sample preparation

mixeddropsUCTarticle
Hard candy before freezer mill grinding

Preparation of a sample for QuEChERS analysis varies depending on the type of edible product being tested. Baked goods, chocolate bars and hard candies should be ground into a fine powder prior to analysis. Although this can be achieved using a product such as a SPEX 6770 freezer mill, a blender can suffice when analyzing typical plant-based samples. Liquid samples, such as sodas or teas, should be degassed prior to analysis, whereas any gummy-based candies should be cut into fine pieces. With the exception of the liquid samples, all other matrices should then be hydrated for one hour within a QuEChERS extraction tube.

UCTarticle
Hard candy after freezer mill grinding

Following sample preparation, acetonitrile is added to all samples along with a proprietary blend of QuEChERS extraction salts. These salts remove water from the organic phase, help to facilitate solvent partitioning and protect base-sensitive analytes from degradation. After shaking and centrifuging the sample, three distinct layers are formed. The top layer, which is the organic phase, can then be aliquoted off for further sample clean-up or dilution.

querchersUCTsample
A mint milk chocolate sample after QuEChERS extraction

For pesticide analysis, an aliquot of the organic layer was subjected to dispersive solid phase extraction (dSPE). This process utilizes an additional blend of proprietary sorbents that remove chlorophyll, sugars, organic acids and fatty compounds from the sample. The resulting extract is free of pigmentation and is ready for analysis on the LC-MS/MS. All samples that were analyzed for cannabinoids did not undergo dSPE; rather, a serial dilution was carried out due to the high concentration of cannabinoids in the original organic layer. The original QuEChERS extract required a dilution of 100-200x in order to have a sample that was ultimately suitable for analysis on LC-MS/MS. A UCT Selectra Aqueous C18 HPLC Column and Guard Column were used in a Thermo Scientific Dionex UltiMate 3000 LC System. An aqueous C18 column was selected due to the extreme polarity of the pesticides being analyzed.

gummyquechersdspE
Comparison of QuEChERS extracts before and after dSPE cleanup (gummy sample)

Summary

This application utilizes the advantages of  UCT’s proprietary QuEChERS combination to extract 35 pesticides and 3 cannabinoids, including tetrahydrocannabinol (THC), cannabidiol (CBD) and cannabinol (CBN) in edibles, followed by either serial dilutions for cannabis potency analysis, or a dSPE cleanup for pesticide residue analysis. This hybrid method allows QuEChERs, which are extensively used in the food testing industry, to be utilized in a forensic setting.

TeganAdams_Eurofinsexperchem
Quality From Canada

Following a Cannabis Sample Through the Lab: 9 Important Steps

By Tegan Adams
No Comments
TeganAdams_Eurofinsexperchem

Anytime a cannabis sample enters a laboratory, the sample is received, handled, weighed, identified and traced throughout the testing and disposal process. Laboratories working with cannabis must have quality systems in place to ensure every action taken to test the cannabis sample is documented and in compliance with good manufacturing practices. Eurofins-Experchem’s sample receipt and handling SOPs includes the following key elements.

  1. Purpose: The purpose of the SOP is outlined to make sure it’s outcome is understood
  2. Scope: The Scope of the SOP explains what events the SOP is intended to avoid and which events the SOP is intended to encourage
  3. Responsibilities: All positions that the SOP affects are outlined
  4. Initial Receipt of the Sample: Samples are submitted to Eurofins Experchem Laboratories with a Sample Information Form. In Canada, cannabis is regulated as a controlled substance. Controlled substances come with a special shipping document and must be weighed upon receipt to the lab to make sure the weight is the same as the client has indicated. Cannabis samples received are inspected to ensure no tampering or damage has occurred to the sample before it is tested. Any temperature and/or storage requirements are noted and followed. If any conditions are not understood the client is contacted for clarification immediately. Pending the sample’s conditions are met, the sample is placed into the laboratory.
  5. Procedure: Eurofins Experchem uses its own sample tracking software to track a sample across the lab. A unique project number and date of entry is given to the sample.  Client name, product name, condition of sample, test(s) performed, ID or lot number and size of samples are all recorded. A sticker is attached to the sample to clarify.
  6. Rush Samples: Rush samples are stamped “RUSH” in red and are placed in a priority sequence. The sample is placed in the safe until required for testing. If the product is not cannabis, the sample is placed on a shelf corresponding with the actual day of the month it was received and entered into sample tracking. If the sample requires cold temperatures it is placed in a refrigerated area and monitored in a similar way.
  7. Discrepancies: Any discrepancies in information found on the sample that may differentiate from what the client requests will be communicated to the client upon finding.
  8. Controlled Documents: Stickers, original lab specification sheets, sample submission forms, and SOP training evaluation questionnaires.
  9. Results: As soon as testing is completed, lab results are approved by quality assurance reviewers. A Certificate of Analysis (COA) is electronically and automatically sent through the sample tracking system to the client’s email.
amandarigdon
The Practical Chemist

Easy Ways to Generate Scientifically Sound Data

By Amanda Rigdon
1 Comment
amandarigdon

I have been working with the chemical analysis side of the cannabis industry for about six years, and I have seen tremendous scientific growth on the part of cannabis labs over that time. Based on conversations with labs and the presentations and forums held at cannabis analytical conferences, I have seen the cannabis analytical industry move from asking, “how do we do this analysis?” to asking “how do we do this analysis right?” This change of focus represents a milestone in the cannabis industry; it means the industry is growing up. Growing up is not always easy, and that is being reflected now in a new focus on understanding and addressing key issues such as pesticides in cannabis products, and asking important questions about how regulation of cannabis labs will occur.

While sometimes painful, growth is always good. To support this evolution, we are now focusing on the contribution that laboratories make to the safety of the cannabis consumer through the generation of quality data. Much of this focus has been on ensuring scientifically sound data through regulation. But Restek is neither a regulatory nor an accrediting body. Restek is dedicated to helping analytical chemists in all industries and regulatory environments produce scientifically sound data through education, technical support and expert advice regarding instrumentation and supplies. I have the privilege of supporting the cannabis analytical testing industry with this goal in mind, which is why I decided to write a regular column detailing simple ways analytical laboratories can improve the quality of their chromatographic data right now, in ways that are easy to implement and are cost effective.

Anyone with an instrument can perform chromatographic analysis and generate data. Even though results are generated, these results may not be valid. At the cannabis industry’s current state, no burden of proof is placed on the analytical laboratory regarding the validity of its results, and there are few gatekeepers between those results and the consumer who is making decisions based on them. Even though some chromatographic instruments are super fancy and expensive, the fact is that every chromatographic instrument – regardless of whether it costs ten thousand or a million dollars – is designed to spit out a number. It is up to the chemist to ensure that number is valid.

In the first couple of paragraphs of this article, I used terms to describe ‘good’ data like ‘scientifically-sound’ or ‘quality’, but at the end of the day, the definition of ‘good’ data is valid data. If you take the literal meaning, valid data is justifiable, logically correct data. Many of the laboratories I have had the pleasure of working with over the years are genuinely dedicated to the production of valid results, but they also need to minimize costs in order to remain competitive. The good news is that laboratories can generate valid scientific results without breaking the bank.

In each of my future articles, I will focus on one aspect of valid data generation, such as calibration and internal standards, explore it in practical detail and go over how that aspect can be applied to common cannabis analyses. The techniques I will be writing about are applied in many other industries, both regulated and non-regulated, so regardless of where the regulations in your state end up, you can already have a head start on the analytical portion of compliance. That means you have more time to focus on the inevitable paperwork portion of regulatory compliance – lucky you! Stay tuned for my next column on instrument calibration, which is the foundation for producing quality data. I think it will be the start of a really good series and I am looking forward to writing it.

A2LA Accredits First Cannabis Laboratory to ISO/IEC 17025

By Aaron G. Biros
No Comments

Frederick, MD– The American Association for Laboratory Accreditation (A2LA) completed its first cannabis testing accreditation for Legend Technical Services, Inc., based in St. Paul, Minnesota. A2LA assessed the laboratory to ISO/IEC 17025 which include the general requirements for the competence of testing and calibration laboratories. The laboratory is now able to test medical cannabis in compliance with Minnesota’s Medical Cannabis Registry Program.

The American Assocation for Laboratory Accreditation (A2LA)

Their scope of accreditation (certificate 2950.01) will include testing for cannabinoid potency and profile, terpenes, pesticides, residual solvents, Mycotoxins, heavy metals and analyzing aerobic bacteria, yeast and mold, E. coli, Salmonella and gram-negative bacteria in medical cannabis products.

roger_headshot
Roger Brauninger, biosafety program manager at A2LA

According to Roger Brauninger, biosafety program manager at A2LA, this bodes well for cannabis laboratory standards in the future. “We are pleased to provide accreditation to cannabis testing laboratories and recognize the potential international standards have to help ensure safety of all legal products entering the marketplace,” says Brauninger. “Legend Technical Services, Inc.’s accreditation with A2LA recognizes their commitment to providing the highest quality laboratory services and confidence in the safety of cannabis products that they test.”

A2LA’s cannabis accreditation program aims to establish a set of standards for quality in testing for cannabis edibles, concentrates and flower. Many states where cannabis is legal require ISO/IEC 17025 for cannabis laboratories as a baseline standard.

Researching Cannabis Genetics: A Q&A with CJ Schwartz, Ph.D.

By Aaron G. Biros
3 Comments

Studying cannabis genetics is a convoluted issue. Strain classification, medicinal effects and plant breeding are particular areas in the science of cannabis that still require heavy research. Marigene, a company researching cannabis genetics, is currently working with universities and research institutes to help map the cannabis genome and catalog genetic variation.

cjschwartzmarigene
CJ Schwartz, Ph.D.

According to CJ Schwartz, Ph.D., chief executive officer and founder of Marigene, their mission is to “to classify, certify, and improve cannabis.” After studying genetics and cellular biology at the University of Minnesota, Schwartz received his Ph.D. in biochemistry from the University of Wisconsin. His research in the past decade has focused on genetic variations that control flowering time, discovering the expression of a gene called Flowering Locus T leads to differential flowering time of plants and is dependent on their native locations. We sat down with Schwartz to learn more about his research and collaborative efforts.


Cannabis Industry Journal: Why are you researching mapping the cannabis genome?

CJ Schwartz, Ph.D: We seek to identify the genetic differences among cannabis strains and the genes responsible for these differences. Genetic differences are what cause different strains to have different effects. DNA allows reproducibility, consistency, and transparency for your cannabis strains.

The more information we gather about cannabis genetics, the more tools we have available to create tailored strains. Cannabis is a targeted compound. It interacts with a very specific system in the human body, similar to hormones, such as insulin. Understanding the cannabis genome will help bring legitimacy and integrity to cannabis products, and allow us to better understand how chemicals from cannabis interact with the human brain. Genetic identification can provide a method of certification to more comprehensively describe plant material.

Schwartz doing sample preparation on the lab bench.

CIJ: How did you get involved in cannabis research?

Schwartz: My interest in cannabis guided my research career. Cannabis may not be a cure-all, but it has significant and measurable medicinal effects for many patients.

To allow true development of cannabis products, we need more science! Our genetic analysis is required for normalization and acceptance of cannabis products, but also essential for future breeding efforts to develop better and more useful plants.

Our sister company, Hempgene, is applying all of the same technology and techniques for hemp research. One focus of Hempgene is to manipulate flowering time in select hemp cultivars so that they mature at the appropriate time in different environments.

CIJ: What do you hope to accomplish with your research?

Schwartz: We can develop or stabilize a plant that produces a very specific chemical profile for a specific condition, such as seizures, nausea or pain. By breeding plants tailored to a patient’s specific ailment, a patient can receive exactly the medicine that they need and minimize negative side effects.

The current term describing the interaction of cannabis compounds is called the entourage effect. Interactions among compounds can be additive or synergistic. The entourage effect describes synergistic effects, where small amounts of compound A (e.g. Myrcene) vastly increase the effects of compound B (e.g. THC). Instead of flooding one’s body with an excessive amount of chemicals to get a non-specific effect, cannabis plants can be bred to produce a very specific effect.

labmarigene
A view of some of the work stations inside the laboratory at Marigene.

Currently our goal is to catalog the natural genetic variation of cannabis, and to identify DNA changes that affect a trait of interest. Once superior variants of a gene are identified, those variants can be combined, by marker-assisted breeding, to produce new combinations of genes. How different cannabis chemicals interact to produce a desired effect, and how different human genetics influence the efficacy of those chemicals should be the ultimate goal of medical marijuana research.

We are working closely with academic institutions and chemical testing labs to gather data for establishing correlations between specific cannabis strains and desirable chemical profiles. Our closest collaborator, Dr. Nolan Kane at UC-Boulder, is working to complete the Cannabis genomic sequence and generate the first high- resolution cannabis genetic map.

We are currently accepting samples and we produce a report in roughly two to three months. For one sequencing run, we identify 125 million pieces of DNA that are 100 base pairs long. We get so much information so there is a considerable time commitment.

Seth_Wong_headshot
From The Lab

What to Consider When Selecting a Laboratory

By Seth Wong
No Comments
Seth_Wong_headshot

There are many factors to consider when selecting a third party analytical laboratory:

  • Why are you testing?
  • Does a governing body require it?
  • Are you testing to meet compliance with industry trends?
  • Are you testing as supplemental protection to an in house laboratory operation?
  • Are your results being used to help you market your product?
  • Are the results being utilized for internal R&D?
  • What are you looking to get out of testing?

Perhaps it is a combination of all these things. Regardless, whomever you contract with for whatever reasons, it is important to understand what you are getting, know what you are entitled to, understand your results, and understand where you and your company remain vulnerable. You must also be prepared with a plan to handle adverse results. Testing at a third party analytical contract laboratory does not mean they assume all of your product’s or company’s liability, regardless of the lab’s reputation.

Ask your third party laboratory about any accreditations, certifications, and licenses that the lab should be accredited and/or certified for. Each state has different certifications and licensing requirements; make sure the entity you are using is licensed or certified for the services you need. Additionally, there is an accreditation called International Standards Organization (ISO) 17025 that is the pinnacle of third party laboratory accreditation. ISO 17025 is a set of protocols that your third party lab should follow to do everything it can to ensure your data is accurate and produced with reliable standards, control samples, matrix control samples and proficiency tests to verify the accuracy of the lab’s employees and methods, among a number of other criteria included in the standard. A number of different entities offer accreditation to ISO 17025 but it is important that the the accrediting body is also accredited to their ISO standard. Simply buying ISO 17025 compliant materials or standards does not mean that the vendor service or product is accredited to ISO 17025. Cannabis laboratories are just starting to implement and build systems around ISO 17025 but it has been prevalent in the third party lab business in many industries for decades and should be applied to the cannabis industry.

Visit your lab and understand their background and experience. Start by requesting a tour of the laboratory you choose; you want to know how things look behind the scenes. Is the lab orderly and doing its best to protect sample integrity? There may be a lot of things going on in the laboratory and it may look chaotic but it should be relatively clean. This prevents contamination and sample mix-ups. Further your relationship with your laboratory by understanding the laboratory’s experience and getting to know your laboratory staff. Consider the lab staff as part of your extended team, they are there to help you and help bring your product to market. The more they understand your goals, the more they can help.

Understand your lab’s history and background: Have they worked with products and/or analytes similar to yours? Have they worked with your sample matrix or one similar to it before? Their prior knowledge and laboratory experience, as it relates to your product, will help provide accurate data and navigate complex matrices.

Most importantly, a laboratory should be willing to release the data packet that is used to generate test results to the client. Releasing this data does not divulge any proprietary information of the lab. It is the laboratory’s job to provide you with the data upon request. It is important to note, looking at your raw data is not the same as looking at the laboratory method, also known as a work instruction or operating procedure. The lab most likely won’t give you the method as those are typically trade secrets, but there is no reason not to share with you the chromatography that the HPLC, GC, GC/MS, or LC/MS generated. This will demonstrate the lab’s sound analytical data and increase your confidence in the analysis you are receiving. When you pay for the results, you are also paying for your data and if your laboratory is not releasing that information to you at your request, you should be skeptical. This data needs to be able to stand up to audits and legal action.

Finally, confidentiality: your data is your data. Yes, you may have to report results to a governing body, but your laboratory should not be sharing your name and your data with anyone but your authorized list of contacts without your permission. They should not even disclose that you are their client without your prior authorization. Confidentiality is not just applicable to a few key employees at the laboratory, it is pertinent to everyone from the sample pickup driver, if you have one, to the chemists and upper level management.

Understanding your contract laboratory’s certifications, licenses, and accreditations, requesting and receiving raw data packages, and ensuring that you feel comfortable with the laboratory, its staff and their practices are key elements to ensuring a successful relationship with your laboratory.