Tag Archives: methodology

Lara Fordis, Fordis Consulting

Data-Driven Decision Making: Mastering Methodologies for Cannabis Market Research

By Lara Fordis
No Comments
Lara Fordis, Fordis Consulting

In any industry that is labeled as the “Wild West,” the ability to discern your target market, collect accurate data and strategically drive success has become paramount. With factors such as invisible shoppers, anyone who is a customer of a brand or dispensary and does not personally purchase what they consume, it’s critical to understand how and where the data an organization is using to make decisions is sourced. Effective market research is the cornerstone upon which cannabis brands can build their trajectory to growth, armed with a diverse array of methodologies designed to provide insightful data-driven insights. Through leveraging the power of dependable data, organizations can navigate the intricacies of the cannabis industry across a wide variety of markets, develop solutions that address actual pain points and position themselves as leaders in their niche.

Not to mention, in an industry where competition is fierce and resources have become increasingly scarce, market research emerges as the North Star guiding businesses along their decision-making path. The era of relying on intuition and gut feelings alone is behind us. As this industry matures, making decisions based on inadequate syndicated data has proven detrimental. This is where robust market research steps in, instilling confidence in decision-makers by offering comprehensive and intelligent data for well-informed and defensible choices. Market research naturally falls into two overarching categories: qualitative and quantitative methodologies. Within these categories, various research approaches can be employed to collect actionable insights across the industry.

Your research can hone in on consumers’ preferences, perceptions, motivations and pain points.

Qualitative research delves deep into the intricacies of human behavior, motivations and preferences. Techniques like in-depth interviews and focus groups—whether conducted virtually or in person—unearth nuanced insights that transcend mere numerical data. This type of research is particularly invaluable for discerning the human side of B2B interactions within the cannabis industry.

On the other hand, quantitative research focuses on the collection and analysis of numerical data. Through surveys, questionnaires and statistical analysis, companies can glean valuable insights into demographics, preferences and market trends. This data can be powerfully visualized through charts, tables and infographics, providing a clear picture of the market landscape.

A wide spectrum of methodologies can be put in place to garner actionable insights across various aspects:

Precision Product Testing: This methodology empowers businesses to amass authentic feedback regarding product quality, user experience and overall satisfaction. By employing a hybrid approach of qualitative and quantitative methods, companies can refine and develop their offerings, ensuring alignment with the expectations of customers. This approach ensures not only a product’s efficacy, but also its appeal in the context of the consumer’s interaction with the product.

In-Home Usage Tests (IHUTs): IHUTs involve providing cannabis products to customers for testing within their operational or natural environments. Often conducted as “diary studies” over a designated time frame, IHUTs provide invaluable insights into aspects like usability, practicality and long-term effects. For instance, conducting an IHUT study on cannabis-infused products designed to aid sleep can assess factors like taste, texture and efficacy, thereby tailoring products to meet specific needs.

Hands-On Collaboration Sessions: Site-based, central location or mobile product testing enables real-time observation of product trials, enabling an immediate evaluation of sensory attributes and practical effects. These collaborative sessions can involve consumers directly engaging with the products, such as the scenario where consumers grind, roll and smoke their joints. This hands-on approach fosters deeper understanding and involvement, leading to more actionable insights for product enhancement.

Strategic Online Surveys: While online surveys are a well-established approach for capturing quantitative data from a broad consumer base, by designing targeted questionnaires tailored for specific market segments, companies can assess preferences, satisfaction levels, brand perceptions, and even purchasing intentions. These insights are invaluable in engineering products and services to specific consumer needs.

Focus groups can provide unique insights from many different perspectives.

Nuanced Focus Groups (FGs): Focus groups bring together a small group of individuals for facilitated discussions. These discussions can be conducted in a central location or even virtually, allowing geographically diverse participants to contribute insights. This approach is perfect for delving into perceptions, motivations and pain points. For instance, a focus group centered on testing prototypes for cannabis-related accessories can provide valuable input for refining products catering to specific needs.

Tailored In-Depth Interviews (IDIs): In-depth interviews, conducted either in person or virtually, provide an opportunity for one-on-one engagements. These interviews are particularly useful for exploring sensitive or controversial topics. For example, assessing the suitability of a prototype product for budtenders through in-depth interviews ensures candid feedback without the influence of group dynamics.

When embarking on cannabis market research, it’s imperative to navigate the intricate landscape of state regulations, especially when dealing with THC-based products. The cannabis industry operates within a patchwork of regulations, which vary from state to state, impacting the feasibility and logistics of product testing. Adhering to and understanding these regulations ensures compliant product testing, upholds participant safety and generates indispensable insights for product development.

At the end of the day, market research is actively emerging as the linchpin for the short- and long-term prosperity of our industry. Leveraging a blend of qualitative and quantitative approaches, such as surveys, focus groups and product testing, equips businesses with a profound understanding of preferences, motivations, and feedback. By embracing data-driven decision-making, cannabis companies position themselves at the vanguard of data-driven achievement, fortified with confidence and assurance.

Reducing Cross Contamination in Your Lab

By Nathan Libbey
No Comments

Cross Contamination

Cross Contamination – noun – “inadvertent transfer of bacteria or other contaminants from one surface, substance, etc., to another especially because of unsanitary handling procedures. – (Mariam Webster, 2021). Cross contamination is not a new concept in the clinical and food lab industries; many facilities have significant design aspects as well as SOPs to deliver the least amount of contaminants into the lab setting. For cannabis labs, however, often the exponential growth leads to a circumstance where the lab simply isn’t large enough for the number of samples processed and number of analytical instruments and personnel needed to process them. Cross contamination for cannabis labs can mean delayed results, heightened occurrences of false positives, and ultimately lost customers – why would you pay for analysis of your clean product in a dirty facility? The following steps can save you the headaches associated with cross contamination:

Wash (and dry) your hands properly

Flash back to early pandemic times when the Tik Tok “Ghen Co Vy” hand washing song was the hotness – we had little to no idea that the disease would be fueled mostly by aerosol transmission, but the premise is the same, good hand hygiene is good to reduce cross contamination. Hands are often the source of bacteria, both resident (here for the long haul; attached to your hands) and transient (easy to remove; just passing through), as they come into contact with surfaces from the bathroom to the pipettor daily (Robinson et al, 2016). Glove use coupled with adequate hand washing are good practices to reduce cross contamination from personnel to a product sample. Additionally, the type of hand drying technique can reduce the microbial load on the bathroom floors and, subsequently tracked into the lab. A 2013 study demonstrated almost double the contamination from air blade technology versus using a paper towel to dry your hands (Margas et al, 2013).

Design Your Lab for Separation

Microbes are migratory. In fact, E. coli can travel at speeds up to 15 body lengths per second. Compared to the fastest Olympians running the 4X100m relay, with an average speed of 35 feet per second or 6 body lengths, this bacterium is a gold medal winner, but we don’t want that in the lab setting (Milo and Phillips, 2021). New lab design keeps this idea of bacterial travel in mind, but for those labs without a new build, steps can be made to prevent contamination:

  • Try to keep traffic flow moving in one direction. Retracing steps can lead to contamination of a previous work station
  • Use separate equipment (e.g. cabinets, pipettes) for each process/step
  • Separate pre- and post-pcr areas
  • Physical separation – use different rooms, add walls, partitions, etc.

Establish, Train and Adhere to SOPs

Design SOPs that include everything- from hygiene to test procedures and sanitation.

High turnover for personnel in labs causes myriad issues. It doesn’t take long for a lab that is buttoned up with cohesive workflows to become a willy-nilly hodgepodge of poor lab practices. A lack of codified Standard Operating Procedures (SOPs) can lead to a lab rife with contaminants and no clear way to troubleshoot the issue. Labs should design strict SOPs that include everything from hand hygiene to test procedures and sanitation. Written SOPs, according to the WHO, should be available at all work stations in their most recent version in order to reduce biased results from testing (WHO, 2009). These SOPs should be relayed to each new employee and training on updated SOPs should be conducted on an ongoing basis. According to Sutton, 2010, laboratory SOPs can be broken down into the following categories:

  • Quality requirements
  • Media
  • Cultures
  • Equipment
  • Training
  • Sample handling
  • Lab operations
  • Testing methodology
  • Data handling/reporting/archiving
  • Investigations

Establish Controls and Monitor Results

Scanning electron micrograph shows a colony of Salmonella typhimurium bacteria. Photo courtesy of CDC, Janice Haney Carr

It may be difficult for labs to keep tabs on positivity and fail rates, but these are important aspects of a QC regimen. For microbiological analysis, labs should use an internal positive control to validate that 1) the method is working properly and 2) positives are a result of target analytes found in the target matrix, not an internal lab contamination strain. Positive controls can be an organism of choice, such as Salmonella Tranoroa, and can be tagged with a marker, such as Green Fluorescent Protein in order to differentiate the control strain. These controls will allow a lab tech to discriminate between a naturally contaminated specimen vs. a positive as a result of cross-contamination.

Labs should, in addition to having good QC practices, keep track of fail rates and positivity rates. This can be done as total lab results by analysis, but also can be broken down into customers. For instance, a lab fail rate for pesticides averages 4% for dried flower samples. If, during a given period of review, this rate jumps past 6% or falls below 2%, their may be an issue with instrumentation, personnel or the product itself. Once contamination is ruled out, labs can then present evidence of spikes in fail rates to growers who can then remediate in their own facilities. These efforts in concert will inherently drive down fail rates, increase lab capacity and efficiency, and result in cost savings for all parties associated.

Continuous Improvement is the Key

Cannabis testing labs are, compared to their food and clinical counterparts, relatively new. The lack of consistent state and federal regulation coupled with unfathomable growth each year, means many labs have been in the “build the plane as you fly” mode. As the lab environment matures, simple QC, SOP and hygiene changes can make an incremental differences and drive improvements for labs as well as growers and manufacturers they support. Lab management can, and should, take steps to reduce cross contamination, increase efficiency and lower costs; The first step is always the hardest, but continuous improvement cannot begin until it has been taken.


References

Margas, E, Maguire, E, Berland, C. R, Welander, F, & Holah, J. T. (2013). Assessment of the environmental microbiological cross contamination following hand drying with paper hand towels or an air blade dryer. Journal of Applied Microbiology, 115(2), 572-582.

Mariam Webster (2021. Cross contamination. Retrieved from https://www.merriam-webster.com/dictionary/cross%20contamination

Milo, M., and Phillips, R. (2021). How fast do cells move? Cell biology by the numbers. Retrieved from http://book.bionumbers.org/how-fast-do-cells-move/

Robinson, Andrew L, Lee, Hyun Jung, Kwon, Junehee, Todd, Ewen, Perez Rodriguez, Fernando, & Ryu, Dojin. (2016). Adequate Hand Washing and Glove Use Are Necessary To Reduce Cross-Contamination from Hands with High Bacterial Loads. Journal of Food Protection, 79(2), 304–308. https://doi.org/10.4315/0362-028X.JFP-15-342

Sutton, Scott. (2010). The importance of a strong SOP system in the QC microbiology lab. Journal of GXP Compliance, 14(2), 44.

World Health Organization. (2009). Good Laboratory Practice Handbook. Retrieved from https://www.who.int/tdr/publications/documents/glp-handbook.pdf

The Brand Marketing Byte

The Hottest Edibles Brands in the United States Right Now

By Cannabis Industry Journal Staff
2 Comments

The Brand Marketing Byte showcases highlights from Pioneer Intelligence’s Cannabis Brand Marketing Snapshots, featuring data-led case studies covering marketing and business development activities of U.S. licensed cannabis companies.

In this week’s Byte, we’re taking a look at the top edibles companies in the country. Using a scoring methodology that factors in a wide variety of data sets, Pioneer’s algorithm tracks brand awareness, audience growth and engagement. Using more than 80,000 relevant data points per week, they analyze business activity across social media, earned media and web-related activities.

For April 2020, here are the top 25 hottest U.S. edibles brands:

  1. Kiva Connections
  2. Wyld
  3. Tyson Ranch
  4. Wana Brands
  5. Serra
  6. STIIIZY
  7. 1906
  8. Kushy Punch
  9. Coda Signature
  10. Kush Queen
  11. PLUS
  12. Theory Wellness
  13. Incredibles
  14. Kikoko
  15. Dixie Elixirs
  16. Fairwinds
  17. Deep Roots Harvest
  18. Willie’s Reserve
  19. Chalice Farms
  20. Care By Design
  21. Beboe
  22. District Edibles
  23. Bhang
  24. Satori
  25. Betty’s Eddies

Multi-Element Analysis Using ICP-MS: A Look at Heavy Metals Testing

By Cannabis Industry Journal Staff
No Comments

Across the country and across the world, governments that legalize cannabis implement increasingly rigorous requirements for laboratory testing. Helping to protect patients and consumers from contaminants, these requirements involve a slew of lab tests, including quantifying the levels of microbial contaminants, pathogens, mold and heavy metals.

Cannabis and hemp have a unique ability to accumulate elements found in soil, which is why these plants can be used as effective tools for bioremediation. Because cannabis plants have the ability to absorb potentially toxic and dangerous elements found in the soil they grow in, lab testing regulations often include the requirement for heavy metals testing, such as Cadmium, Lead, Mercury, Arsenic and others.

In addition to legal cannabis markets across the country, the USDA announced the establishment of the U.S. Domestic Hemp Production Program, following the enactment of the 2018 Farm Bill, essentially legalizing hemp. This announcement comes with information for hemp testing labs, including testing and sampling guidelines. While the information available on the USDA’s website only touches on testing for THC, required to be no greater than 0.3% dry weight concentration, more testing guidelines in the future are sure to include a discussion of heavy metals testing.

Table 1. ICP-MS operating conditions (shaded parameters were automatically optimized during start up for the HMI conditions).

In an application note produced by Agilent Technologies, Inc., the Agilent 7800 ICP-MS was used to analyze 25 elements in a variety of cannabis and hemp-derived products. The study was conducted using that Agilent 7800 ICP-MS, which includes Agilent’s proprietary High Matrix Introduction (HMI) system. The analysis was automated  by using the Agilent SPS 4 autosampler.

Instrumentation

The instrument operating conditions can be found in Table 1. In this study, the HMI dilution factor was 4x and the analytes were all acquired in the Helium collision mode. Using this methodology, the Helium collision mode consistently reduces or completely eliminates all common polyatomic interferences using kinetic energy discrimination (KED).

Table 2. Parameters for microwave digestion.

As a comparison, Arsenic and Selenium were also acquired via the MassHunter Software using half-mass correction, which corrects for overlaps due to doubly charged rare earth elements. This software also collects semiquantitative or screening data across the entire mass region, called Quick Scan, showing data for elements that may not be present in the original calibration standards.

SRMs and Samples

Standard reference materials (SRMs) analyzed from the National Institute of Standards and Technology (NIST) were used to verify the sample prep digestion process. Those included NIST 1547 Peach Leaves, NIST 1573a Tomato Leaves and NIST 1575 Pine Needles. NIST 1640a Natural Water was also used to verify the calibration.

Figure 1. Calibration curves for As, Cd, Pb, and Hg.

Samples used in the study include cannabis flower, cannabis tablets, a cannabidiol (CBD) tincture, chewable candies and hemp-derived cream.

Sample Preparation

Calibration standards were prepared using a mix of 1% HNO3 and 0.5% HCl. Sodium, Magnesium, Potassium, Calcium and Iron were calibrated from 0.5 to 10 ppm. Mercury was calibrated from 0.05 to 2 ppb. All the other elements were calibrated from 0.5 to 100 ppb.

Table 3. Calibration summary data acquired in He mode. Data for As and Se in shaded cells was obtained using half mass correction tuning.

After weighing the samples (roughly 0.15 g of cannabis plant and between 0.3 to 0.5 g of cannabis product) into quartz vessels, 4 mL HNO3 and 1 mL HCl were added and the samples were microwave digested using the program found in Table 2.

HCI was included to ensure the stability of Mercury and Silver in solution. They diluted the digested samples in the same acid mix as the standards. SRMs were prepared using the same method to verify sample digestion and to confirm the recovery of analytes.

Four samples were prepared in triplicate and fortified with the Agilent Environmental Mix Spike solution prior to the analysis. All samples, spikes and SRMs were diluted 5x before testing to reduce the acid concentration.

Calibration

Table 4. ICV and CCV recovery tests. Data for As and Se in shaded cells was obtained using half mass correction tuning.

The calibration curves for Arsenic, Cadmium, Lead and Mercury can be found in Figure 1 and a summary of the calibration data is in Table 3. For quality control, the SRM NIST 1645a Natural Water was used for the initial calibration verification standard.  Recoveries found in Table 4 are for all the certified elements present in SRM NIST 1640a. The mean recoveries and concentration range can also be found in Table 4. All the continuing calibration solution recoveries were within 10% of the expected value.

Internal Standard Stability

Figure 2 highlights the ISTD signal stability for the sequence of 58 samples analyzed over roughly four hours. The recoveries for all samples were well within 20 % of the value in the initial calibration standard.

Figure 2. Internal standard signal stability for the sequence of 58 samples analyzed over ~four hours.

Results

In Table 5, you’ll find that three SRMs were tested to verify the digestion process. The mean results for most elements agreed with the certified concentrations, however the results for Arsenic in NIST 1547 and Selenium in both NIST 1547 and 1573a did not show good agreement due to interreferences formed from the presence of doubly-charged ions

Table 5. Mean concentrations (ppm) of three repeat measurements of three SRMs, including certified element concentrations, where appropriate, and % recovery.

Some plant materials can contain high levels of rare earth elements, which have low second ionization potentials, so they tend to form doubly-charged ions. As the quadrupole Mass Spec separates ions based on their mass-to-charge ratio, the doubly-charged ions appear at half of their true mass. Because of that, a handful of those doubly-charged ions caused overlaps leading to bias in the results for Arsenic and Selenium in samples that have high levels of rare earth elements. Using half mass correction, the ICP-MS corrects for these interferences, which can be automatically set up in the MassHunter software. The shaded cells in Table 5 highlight the half mass corrected results for Arsenic and Selenium, demonstrating recoveries in agreement with the certified concentrations.

In Table 6, you’ll find the quantitative results for cannabis tablets and the CBD tincture. Although the concentrations of Arsenic, Cadmium, Lead and Cobalt are well below current regulations’ maximum levels, they do show up relatively high in the cannabis tablets sample. Both Lead and Cadmium also had notably higher levels in the CBD tincture as well.

Table 6. Quantitative data for two cannabis-related products and two cannabis samples plus mean spike recovery results. All units ppb apart from major elements, which are reported as ppm.

A spike recovery test was utilized to check the accuracy of the method for sample analysis. The spike results are in Table 6.

Using the 7800 ICP-MS instrument and the High Matrix Introduction system, labs can routinely analyze samples that contain high and very variable matrix levels. Using the automated HMI system, labs can reduce the need to manually handle samples, which can reduce the potential for contamination during sample prep. The MassHunter Quick Scan function shows a complete analysis of the heavy metals in the sample, including data reported for elements not included in the calibration standards.

The half mass correction for Arsenic and Selenium allows a lab to accurately determine the correct concentrations. The study showed the validity of the microwave sample prep method with good recovery results for the SRMs. Using the Agilent 7800 ICP-MS in a cannabis or hemp testing lab can be an effective and efficient way to test cannabis products for heavy metals. This test can be used in various stages of the supply chain as a tool for quality controls in the cannabis and hemp markets.


Disclaimer: Agilent products and solutions are intended to be used for cannabis quality control and safety testing in laboratories where such use is permitted under state/country law.

Spotlight on AOAC: New Leadership, New Initiatives In Cannabis & Food

By Aaron G. Biros
No Comments

AOAC INTERNATIONAL is an independent, third party, not-for-profit association and voluntary consensus standards developing organization. Founded in 1884, AOAC INTERNATIONAL was originally coined the Association of Official Agricultural Chemists. Later on, they changed their name to the Association of Official Analytical Chemists. Now that their members include microbiologists, food scientists as well as chemists, the organization officially changed its name to just AOAC INTERNATIONAL.

Much of AOAC’s work surrounds promoting food safety, food security and public health. Their work generally encompasses setting scientific standards for testing methodology, evaluating and adopting test methods and evaluating laboratory proficiency of test methods. The organization provides a forum for scientists to develop microbiological and chemical standards.

In December of 2018, they appointed Dr. Palmer Orlandi as deputy executive director and chief science officer. Dr. Orlandi has an extensive background at the U.S. Food and Drug Administration (FDA), serving the regulatory agency for more than 20 years. Most recently, he was the CSO and research director in the Office of Food and Veterinary Medicine at the FDA. He earned the rank of Rear Admiral and Assistant Surgeon General in 2017.

Dr. Palmer Orlandi is the new Deputy Executive Director and Chief Science Officer at AOAC.

Where It All Began With Cannabis

As recently as three years ago, AOAC began getting involved in the cannabis laboratory testing community, with a working group dedicated to developing standard method performance requirements for AOAC Official MethodsSM for cannabis testing. We sat down with Dr. Palmer Orlandi and a number of AOAC’s leaders to get an update on their progress working with cannabis testing as well as food security and food fraud.

According to Scott Coates, senior director of the AOAC Research Institute, they were approached three years ago to set up a working group for cannabis testing. “We created standards that we call the standard method performance requirements (SMPR®), which are detailed descriptions of what analytical methods should be able to do,” says Coates. “Using SMPRs, we issued a series of calls for methods and looked for methods that meet our standards. So far, we’ve completed four SMPRs- cannabinoids in plant material, cannabinoids in plant extracts, cannabinoids in chocolate (edibles), and one for pesticides in cannabis plant material.” AOAC doesn’t develop methods themselves, but they perform a comprehensive review of the methods and if they deem them acceptable, then the methods can be adopted and published in the AOAC compendium of methods, the Official Methods of Analysis of AOAC INTERNATIONAL.

Deborah McKenzie, senior director of Standards and Official Methods at AOAC

Deborah McKenzie, senior director of Standards and Official MethodsSM at AOAC, says the initial working group set the stage for really sinking their teeth into cannabis testing. “It started with methods for testing cannabinoids in plant dried material and plant extract,” says McKenzie. “That’s where our previous work has started to mold into the current effort we are launching.” McKenzie says they are looking forward to getting more involved with methods regarding chemical contaminants in cannabis, cannabinoids in various foods and consumables, as well as microbial organisms in cannabis. “We are pretty focused on testing labs having reliable and validated analytical solutions as our broad goal right now.”

Moving Forward, Expanding Their Programs

Coates says the work they’ve done over the past few years was more of a singular project, developed strictly for creating standards and to review methods. Now they are currently developing their Cannabis Analytical Science Program (CASP), which is expected to be an ongoing program. “We are looking to fully support the cannabis analytical community as best we can, which will potentially include working on reference materials, proficiency testing, education, training and ISO 17025 accreditation, all particularly as it applies to lab testing in the cannabis industry,” says Coates. “So, this CASP work is a much bigger and broader effort to cover more and to provide more support for labs doing the analysis of cannabis and its constituents, as well as hemp.”

According to Dr. Orlandi, they want this program to have a broad reach in the cannabis testing community. “As Scott pointed out, it’s not just strictly developing standards and methods,” says Dr. Orlandi. “It is going to be as all-encompassing as possible and will lead to training programs, a proficiency testing program and other areas.” Arlene Fox, senior director of AOAC’s Laboratory Proficiency Testing Program, says they are actively engaging in proficiency testing. “We are in the process of evaluating what is out there, what is possible and what’s needed as far as expanding proficiency testing for cannabis labs,” says Fox.

Regulatory Challenges & Obstacles

The obvious roadblock to much of AOAC’s work is that cannabis is still considered a controlled substance. “That creates some challenges for the work that we do in certain areas,” says Dr. Orlandi. “That is why this isn’t just a one-year project. We will work with these challenges and our stakeholders to address them.” AOAC had to put some limits on participation- for example, they had to decide that they cannot look for contributions or collaborations with producers and distributors, so long as cannabis is still a Schedule I controlled substance in the US.

Arlene Fox, senior director of AOAC’s Laboratory Proficiency Testing Program

Muddying the waters even further, the recent signing of the Farm Bill puts a clear distinction between most types of cannabis and industrial hemp. David Schmidt, executive director of AOAC realizes they need to be realistic with their stakeholders and in the eye of federal law.

While scientifically speaking, it’s pretty much the same plant just with slightly different chemical constituents, AOAC INTERNATIONAL has to draw a line in the sand somewhere. “As Palmer suggests, because of the Farm Bill being implemented and hemp being defined now as a legal substance from a controlled substance standpoint, industrial hemp has been given this exclusion,” says Schmidt. “So, we are trying to be realistic now, working with our stakeholders that work with hemp, trying to understand the reality of the federal law. We want to make clear that we can meet stakeholder needs and we want to distinguish hemp from cannabis to remain confident in the legality of it.” Schmidt says this is one of a number of topics they plan on addressing in detail at their upcoming 9thannual 2019 Midyear Meeting, held March 11-14 in Gaithersburg, Maryland.

Uniformity in Methodology: The Future of Cannabis Testing

Dr. Orlandi says his experience at the FDA has prepared him well for the work being done at AOAC. “The role that I served at the FDA prior to joining my colleagues here at AOAC was very similar: And that is to bring together stakeholders to accomplish or to solve a common problem.” Some of their stakeholders in the CASP program include BC Testing, Inc., the Association of Food and Drug Officials (AFDO), Bia Diagnostics, Bio-Rad, Industrial Laboratories, Materia Medica Labs, PerkinElmer, R-Biopharm AG, Supra R & D, TEQ Analytical Laboratories, Titan Analytical and Trilogy Analytical, among others.

David Schmidt, executive director of AOAC

“The underlying reason behind this effort is to create some level of harmonization for standards and methods,” says Dr. Orlandi. “They can be used in the near future to stay ahead of the curve for when regulatory agencies become involved. The idea is that these standards for analytical methods will already be established and as uniform as possible.”

When comparing cannabis to other industries in the US, Scott Coates mentions that most standards are signed off by the federal government. “When we started looking at pesticides in cannabis, it became really clear that we have a number of states doing things differently with different limits of quantification,” says Coates. “Each state, generally speaking, is setting their own standards. As Palmer was saying, one thing we are trying to do with this CASP program eventually will be to have some harmonization, instead of 30 different states having 30 different standards and methods.” So, on a much broader level, their goal for the CASP program is to develop a common set of standard methods, including hemp testing and even the Canadian market. “Hopefully this will be an international collaboration for standards for the methodology,” says Coates. They want to create a common set of standards, setting limits of quantification that will be accepted internationally, that will be accurate and repeatable and for the entire cannabis industry, not just state by state.

Food Authenticity & Fraud

One of the other activities that AOAC just launched recently is the food authenticity and fraud program. As the name implies, the goal is to start developing standards and methods and materials to look at economically adulterated foods, says Dr. Orlandi. That includes non-targeted analyses looking at matrices of food products that may be adulterated with an unknown target, as well as targeted analytes, identifying common adulterants in a variety of food products. “One example in the food industry is fraudulent olive oil,” says Dr. Orlandi. “Honey is another commodity that has experienced adulteration.” He says that in most cases these are economically motivated instances of fraud.

AOAC INTERNATIONAL is working in a large variety of other areas as well. All of these topics will be explored in much greater detail at their upcoming 9thannual 2019 Midyear Meeting, held March 11-14 in Gaithersburg, Maryland.

Swetha Kaul, PhD

Colorado vs. California: Two Different Approaches to Mold Testing in Cannabis

By Swetha Kaul, PhD
8 Comments
Swetha Kaul, PhD

Across the country, there is a patchwork of regulatory requirements that vary from state to state. Regulations focus on limiting microbial impurities (such as mold) present in cannabis in order for consumers to receive a safe product. When cultivators in Colorado and Nevada submit their cannabis product to laboratories for testing, they are striving to meet total yeast and mold count (TYMC) requirements.In a nascent industry, it is prudent for state regulators to reference specific testing methodologies so that an industry standard can be established.

TYMC refers to the number of colony forming units present per gram (CFU/g) of cannabis material tested. CFU is a method of quantifying and reporting the amount of live yeast or mold present in the cannabis material being tested. This number is determined by plating the sample, which involves spreading the sample evenly in a container like a petri dish, followed by an incubation period, which provides the ideal conditions for yeast and mold to grow and multiply. If the yeast and mold cells are efficiently distributed on a plate, it is assumed that each live cell will give rise to a single colony. Each colony produces a visible spot on the plate and this represents a single CFU. Counting the numbers of CFU gives an accurate estimate on the number of viable cells in the sample.

The plate count methodology for TYMC is standardized and widely accepted in a variety of industries including the food, cosmetic and pharmaceutical industries. The FDA has published guidelines that specify limits on total yeast and mold counts ranging from 10 to 100,000 CFU/g. In cannabis testing, a TYMC count of 10,000 is commonly used. TYMC is also approved by the AOAC for testing a variety of products, such as food and cosmetics, for yeast and mold. It is a fairly easy technique to perform requiring minimal training, and the overall cost tends to be relatively low. It can be utilized to differentiate between dead and live cells, since only viable living cells produce colonies.

Petri dish containing the fungus Aspergillus flavus
Petri dish containing the fungus Aspergillus flavus.
Photo courtesy of USDA ARS & Peggy Greb.

There is a 24 to 48-hour incubation period associated with TYMC and this impedes speed of testing. Depending on the microbial levels in a sample, additional dilution of a cannabis sample being tested may be required in order to count the cells accurately. TYMC is not species-specific, allowing this method to cover a broad range of yeast and molds, including those that are not considered harmful. Studies conducted on cannabis products have identified several harmful species of yeast and mold, including Cryptococcus, Mucor, Aspergillus, Penicillium and Botrytis Cinerea. Non-pathogenic molds have also been shown to be a source of allergic hypersensitivity reactions. The ability of TYMC to detect only viable living cells from such a broad range of yeast and mold species may be considered an advantage in the newly emerging cannabis industry.

After California voted to legalize recreational marijuana, state regulatory agencies began exploring different cannabis testing methods to implement in order to ensure clean cannabis for the large influx of consumers.

Unlike Colorado, California is considering a different route and the recently released emergency regulations require testing for specific species of Aspergillus mold (A. fumigatus, A. flavus, A. niger and A. terreus). While Aspergillus can also be cultured and plated, it is difficult to differentiate morphological characteristics of each species on a plate and the risk of misidentification is high. Therefore, positive identification would require the use of DNA-based methods such as polymerase chain reaction testing, also known as PCR. PCR is a molecular biology technique that can detect species-specific strains of mold that are considered harmful through the amplification and analysis of DNA sequences present in cannabis. The standard PCR testing method can be divided into four steps:

  1. The double stranded DNA in the cannabis sample is denatured by heat. This refers to splitting the double strand into single strands.
  2. Primers, which are short single-stranded DNA sequences, are added to align with the corresponding section of the DNA. These primers can be directly or indirectly labeled with fluorescence.
  3. DNA polymerase is introduced to extend the sequence, which results in two copies of the original double stranded DNA. DNA polymerases are enzymes that create DNA molecules by assembling nucleotides, the building blocks of DNA.
  4. Once the double stranded DNA is created, the intensity of the resulting fluorescence signal can uncover the presence of specific species of harmful Aspergillus mold, such as fumigatus.

These steps can be repeated several times to amplify a very small amount of DNA in a sample. The primers will only bind to the corresponding sequence of DNA that matches that primer and this allows PCR to be very specific.

PCR testing is used in a wide variety of applications
Photo courtesy of USDA ARS & Peggy Greb.

PCR is a very sensitive and selective method with many applications. However, the instrumentation utilized can be very expensive, which would increase the overall cost of a compliance test. The high sensitivity of the method for the target DNA means that there are possibilities for a false positive. This has implications in the cannabis industry where samples that test positive for yeast and mold may need to go through a remediation process to kill the microbial impurities. These remediated samples may still fail a PCR-based microbial test due to the presence of the DNA. Another issue with the high selectivity of this method is that other species of potentially harmful yeast and mold would not even be detected. PCR is a technique that requires skill and training to perform and this, in turn, adds to the high overall cost of the test.

Both TYMC and PCR have associated advantages and disadvantages and it is important to take into account the cost, speed, selectivity, and sensitivity of each method. The differences between the two methodologies would lead to a large disparity in testing standards amongst labs in different states. In a nascent industry, it is prudent for state regulators to reference specific testing methodologies so that an industry standard can be established.

Designing Your Continuing Cannabis Education Program

By RJ Starr
No Comments

As many states’ medical cannabis programs are already in full swing and several are launching or nearing their one-year or biennial maturation periods, medical cannabis dispensaries and cannabis cultivation and processing facilities should be fine-tuning their Continuing Cannabis Education Program, or CCEP, and be ready for inspection by state agencies.

While states with medical cannabis programs administer them through various agencies such as Department of Medicine/Health, Department of Pharmacy, Department of Commerce, Alcoholic Beverage Control, each has their own minimum requirements for continuing education in the medical cannabis space, and each structures their program in the direction within which that particular regulatory agency leans. Each state’s personality also brings an influential component as well; for example, a state with a highly visible opioid crisis may place greater emphasis on substance abuse training.

Suffice it to say that while there is certainly insight to be gained from knowing your particular state, there are certain elements of an ongoing professional development program that should be considered in each CCEP. This article will explore a few of the elements integral to any successful human capital and professional development plan from a vantage of compliance, and will offer some insight into the exceptional training methodology designed by Midwest Compassion Center and Bloom Medicinals.

There are a number of key considerations in developing a Continuing Cannabis Education Program, and a thoughtful CCEP should be developed specifically to meet the needs of both the organization and its employees. This can be done by a needs assessment consisting of three levels: organizational, occupational, and individual assessments.

  1. Needs assessment and learning objectives. This part of the framework development asks you to consider what kind of training is needed in your organization. Once you have determined the training needed, you can set learning objectives to measure at the end of the training.
    1. Organizational assessment. In this type of needs assessment, we can determine the skills, knowledge and abilities our cannabis dispensaries need in order to meet their strategic objectives. This type of assessment considers things such as changing laws, demographics and technology trends. Overall, this type of assessment looks at how the organization as a whole can handle its weaknesses while promoting strengths.
    2. Occupational (task) assessment. This type of assessment looks at the specific tasks, skills, knowledge and abilities required of our employees to do the jobs necessary within our dispensaries.
    3. Individual assessment. An individual assessment looks at the performance of an individual employee and determines what training should be accomplished for that individual.
  2. Consideration of learning styles. Making sure to teach to a variety of learning styles is important to development of training programs.
  3. Delivery mode. What is the best way to get your message across? Is classroom or web-based training more appropriate, or should one-on-one mentoring be used? Successful training programs should incorporate a variety of delivery methods.
  4. How much money do you have to spend on this training? This does not only include the cost of materials, but the cost of time. Consideration should also be given to the costs associated with not investing in training: CFO asks CEO, “What happens if we invest in developing our people and then they leave us?” CEO: “What happens if we don’t, and they stay?”
  5. Delivery style. Will the training be self-paced or instructor led? What kinds of discussions and interactions can be developed in conjunction with this training? The delivery style must take into account people’s individual learning styles. A balance of lectures, discussions, role-playing, and activities that solidify concepts are considered part of delivery style.
  6. Audience. Who will be part of this training? Do you have a mix of roles, such as accounting people and marketing people? What are the job responsibilities of these individuals, and how can you make the training relevant to their individual jobs? The audience for the training is an important aspect when developing your CCEP. This can allow the training to be better developed to meet the needs and the skills of a particular group of people.
  7. Content. What needs to be taught? How will you sequence the information? The content obviously is an important consideration. Learning objectives and goals for the training should be established and articulated before content is developed.
  8. Timelines. How long will it take to develop the training? Is there a deadline for training to be completed, and if so, what risk analysis can be used to determine the consequences of not meeting that deadline? After content is developed, understanding time constraints is an important aspect. Will the training take one hour or a day to deliver? What is the timeline consideration in terms of when people should take the training?
  9. Communication. How will employees know the training is available to them? Letting people know when and where the training will take place is part of communication.
  10. Measuring effectiveness. How will you know if your training worked? What ways will you use to measure this? The final aspect of developing a training framework is to consider how it will be measured. At the end, how will you know if the trainees learned what they needed to learn?

A thorough review of your state’s rules and regulations should take place quarterly, with one or more specific employees designated to stay abreast of changes. If your regulatory authority has implemented requirements that trainings must be approved in advance, know that as well, and keep your Continuous Cannabis Education Program up-to-date and ready for inspection.

The Practical Chemist

Instrumentation for Heavy Metals Analysis in Cannabis

By Chris English
2 Comments

Determination of Toxic Metals in Cannabis

Heavy metals are common environmental contaminants often resulting from mining operations, industrial waste, automotive emissions, coal fired power plants, amount other sources. Several remediation strategies exist that are common for the reduction/elimination of metals in the environment. Phytoremediation is one method for removing metals from soil, utilizing plants to uptake metals which then bioaccumulate in the plant matter. In one study, cesium concentrations were found to be 8,000 times greater in the plant roots compared to the surrounding water in the soil. In 1998, cannabis was specifically tested at the Chernobyl nuclear disaster site for its ability to remediate the contaminated soil. These examples demonstrate that cannabis must be carefully cultivated to avoid the uptake of toxic metals. Possible sources would not only include the growing environment, but also materials such as fertilizers. Many states publish metal content in fertilizer products allowing growers to select the cleanest product for their plants. For cannabis plant material and concentrates several states have specific limits for cadmium (Cd), Lead (Pb), Arsenic (As) and Mercury (Hg), based on absolute limits in product or daily dosage by body weight.

Analytical Approaches to Metals Determination

Inductively Coupled Plasma, Ionized Argon gas stream. Photo Courtesy: Sigma via Wikimedia Commons

Flame Atomic Absorption Spectroscopy (Flame AA) and Graphite Furnace Atomic Absorption Spectroscopy (GFAA) are both techniques that determine both the identity and quantity of specific elements. For both of these techniques, the absorption in intensity of a specific light source is measured following the atomization of the sample digestate using either a flame or an electrically heated graphite tube. Reference standards are analyzed prior to the samples in order to develop a calibration that relates the concentration of each element relative to its absorbance. For these two techniques, each element is often determined individually, and the light source, most commonly a hollow cathode lamp (HLC) or electrodeless discharge lamp (EDL) are specific for each element. The two most common types of Atomic Emission Spectroscopy (AES) are; Inductively Coupled Plasma Optical Emission Spectroscopy (ICP-OES) and ICP-Mass Spectrometry (ICP-MS). Both of these techniques use an argon plasma for atomization of the sample digestates. This argon plasma is maintained using a radio frequency generator that is capable of atomization and excitation of the majority of the elements on the periodic table. Due to the considerably higher energy of the plasma-based instruments, they are more capable than the flame or furnace based systems for measurement of a wide range of elements. Additionally, they are based on optical emission, or mass spectrometric detection, and are capable of analysis of all elements at essentially the same time.

Technique Selection

Flame AA is easy to use, inexpensive and can provide reasonable throughput for a limited number of elements. However, changes to light sources and optical method parameters are necessary when determining different metals. GFAA is also limited by similar needs to change the light sources, though it is capable of greater sensitivity for most elements as compared to flame AA. Runtimes are on the order of three minutes per element for each sample, which can result in lower laboratory throughput and greater sample digestate consumption. While the sensitivity of the absorption techniques is reasonable, the dynamic range can be more limited requiring re-analyses and dilutions to get the sample within the calibration range. ICP-OES allows the simultaneous analysis of over 70 elements in approximately a minute per sample with a much greater linear dynamic range. ICP-OES instruments cost about 2-5 times more than AA instruments. ICP-MS generally has the greatest sensitivity (sub-parts-per-trillion, for some elements) with the ability to determine over 70 elements per minute. Operator complexity, instrument expense and MS stability, as well as cost are some of the disadvantages. The US FDA has a single laboratory validated method for ICP-MS for elements in food using microwave assisted digestion, and New York State recently released a method for the analysis of metals in medical cannabis products by ICP-MS (NYS DOH LINC-250).

The use of fertilizers, and other materials, with low metal content is one step necessary to providing a safe product and maintaining customer confidence. The state-by-state cannabis regulations will continue to evolve which will require instrumentation that is flexible enough to quickly accommodate added metals to the regulatory lists, lower detection limits while adding a high level of confidence in the data.

Shimadzu Launches Cannabis Analyzer for Potency

By Aaron G. Biros
2 Comments

On Monday, March 6th, Shimadzu Scientific Instruments, a leading laboratory analytical instrumentation manufacturer, announced the launch of a new product focused on cannabis, according to a press release. Their Cannabis Analyzer for Potency is essentially a high-performance liquid chromatograph (HPLC) packaged with integrated hardware, software, workflows and all the supplies. The supplies include an analytical column, guard columns, mobile phase and a CRM standard mixture.canAnalyzerImg1

The instrument is designed to test for 11 cannabinoids in less time and with greater ease than traditional HPLC instruments. In the press release, they claim “operators are now able to produce accurate results with ease, regardless of cannabis testing knowledge or chromatography experience.” One very unique aspect of the instrument is the lack of experience required to run it, according to Bob Clifford, general manager of marketing at Shimadzu. “We have our typical chromatography software [LabSolutions] with an overlay that allows the user to analyze a sample in three simple steps,” says Clifford. Those in the cannabis industry that have a background in plant science, but not analytical chemistry, could run potency analyses on the instrument with minimal training. “This overlay allows ease of use for those not familiar with chromatography software,” says Clifford.

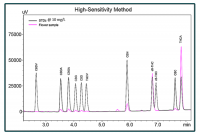
An overlay of a flower sample with the standards supplied in the High-Sensitivity Method package.

The instrument can determine cannabinoid percentages per dry weight in flower concentrates and edibles. “Once you open the software, it will get the flow rate started, heat the column up and automatically begin to prep for analysis,” says Clifford. Before the analysis begins, information like the sample ID number, sample name, sample weight, extraction volume and dilution volume are entered. After the analysis is complete all the test results are reported for each sample.

Because laboratories wouldn’t have to develop quantitative testing methodology, they argue this instrument would save a lot of time in the lab. “After one day of installation and testing, users are equipped with everything they need to obtain cannabis potency results,” states the press release. According to Clifford, method development for potency analysis in-house can take some labs up to three months. “We can bring this instrument to the lab and have it ready for testing almost immediately,” says Clifford. “The methods for this instrument were developed by a team of twenty scientists working on different platforms at our Innovation Center and was tested for ruggedness, repeatability and quantitative accuracy.”

Screenshots from the software on the instrument

The instrument’s workflow is designed to meet three methods of analysis depending on testing needs. The High Throughput method package can determine quantities of ten cannabinoids with less than eight minutes per sample. The method was developed in collaboration with commercial testing laboratories. The High Sensitivity method package adds THCV to that target analyte list with ten minutes per analysis. The method provides the sharpest chromatographic peaks and best sensitivity. The High Resolution method package offers full baseline resolution for those 11 cannabinoids in less than 30 minutes per analysis and the ability to add cannabinoids to that target list if regulations change.

The press release states the interface should allow users to reduce the number of steps needed in the analysis and simplify the workflow. The instrument comes with a three-year warranty, preventative maintenance plan and lifetime technical support.

From The Lab

QuEChERS 101

By Danielle Mackowsky
No Comments

Sample preparation experts and analytical chemists are quick to suggest QuEChERS (Quick, Easy, Cheap, Effective, Rugged and Safe) to cannabis laboratories that are analyzing both flower and edible material for pesticides, mycotoxins and cannabinoid content. Besides having a quirky name, just what makes QuEChERS a good extraction technique for the complicated matrices of cannabis products? By understanding the chemistry behind the extraction and the methodology’s history, cannabis laboratories can better implement the technology and educate their workforce.

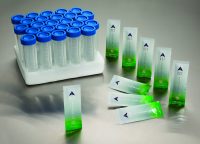
QuEChERS salt blends can be packed into mylar pouches for use with any type of centrifuge tubes

In 2003, a time when only eight states had legalized the use of medical cannabis, a group of four researchers published an article in the Journal of AOAC International that made quite the impact in the residue monitoring industry. Titled Fast and Easy Multiresidue Method Employing Acetonitrile Extraction/Partitioning and “Dispersive Solid-Phase Extraction” for the Determination of Pesticide Residues in Produce, Drs. Michael Anastassiades, Steven Lehotay, Darinka Štajnbaher and Frank Schenck demonstrate how hundreds of pesticides could be extracted from a variety of produce samples through the use of two sequential steps: an initial phase partitioning followed by an additional matrix clean up. In the paper’s conclusion, the term QuEChERS was officially coined. In the fourteen years that have followed, this article has been cited over 2800 times. Subsequent research publications have demonstrated its use in matrices beyond food products such as biological fluids, soil and dietary supplements for a plethora of analytes including phthalates, pharmaceutical compounds and most recently cannabis.

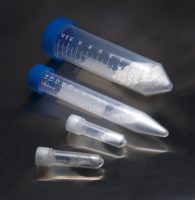
QuEChERS salts can come prepacked into centrifuge tubes

The original QuEChERS extraction method utilized a salt blend of 4 g of magnesium sulfate and 1 g of sodium chloride. A starting sample volume of 10 g and 10 mL of acetonitrile (ACN) were combined with the above-mentioned salt blend in a centrifuge tube. The second step, dispersive solid phase extraction (dSPE) cleanup, included 150 mg of magnesium sulfate and 25 mg of primary secondary amine (PSA). Subsequent extraction techniques, now known as AOAC and European QuEChERS, suggested the use of buffered salts in order to protect any base sensitive analytes that may be critical to one’s analysis. Though the pH of the extraction solvent may differ, all three methods agree that ACN should be used as the starting organic phase. ACN is capable of extracting the broadest range of analytes and is compatible with both LC-MS/MS and GC-MS systems. While ethyl acetate has also been suggested as a starting solvent, it is incompatible with LC-MS/MS and extracts a larger amount of undesirable matrix components in the final aliquot.

All laboratories, including cannabis and food safety settings, are constantly looking for ways to decrease their overhead costs, batch out the most samples possible per day, and keep their employees trained and safe. It is not a stretch to say that QuEChERS revolutionized the analytical industry and made the above goals tangible achievements. In the original publication, Anastassiades et al. established that recoveries of over 85% for pesticides residues were possible at a cost as low as $1 per ten grams of sample. Within forty minutes, up to twelve samples were fully extracted and ready to be analyzed by GC-MS, without the purchase of any specialized equipment. Most importantly, no halogenated solvents were necessary, making this an environmentally conscious concept. Due to the nature of the cannabis industry, laboratories in this field are able to decrease overall solvent usage by a greater amount than what was demonstrated in 2003. The recommended starting sample for cannabis laboratories is only one gram of flower, or a tenth of the starting volume that is commonly utilized in the food safety industry. This reduction in sample volume then leads to a reduction in acetonitrile usage and thus QuEChERS is a very green extraction methodology.

The complexity of the cannabis matrix can cause great extraction difficulties if proper techniques are not used

As with any analytical method, QuEChERS is not perfect or ideal for every laboratory setting. Challenges remain in the cannabis industry where the polarity of individual pesticides monitored in some states precludes them from being amenable to the QuEChERS approach. For cannabis laboratories looking to improve their pesticide recoveries, decrease their solvent usage and not invest their resources into additional bench top equipment, QuEChERS is an excellent technique to adopt. The commercialization of salt blends specific for cannabis flowers and edibles takes the guesswork out of which products to use. The growth of cannabis technical groups within established analytical organizations has allowed for better communication among scientists when it comes to best practices for this complicated matrix. Overall, it is definitely worth implementing the QuEChERS technique in one’s cannabis laboratory in order to streamline productivity without sacrificing your results.