Tag Archives: profile

The Inflated THC Crisis Plaguing California Cannabis

By Erik Paulson, Josh Swider, Zachary Eisenberg
5 Comments

Fraud

The THC content you see on a label when you walk into a dispensary? There is a very good chance the number is false.

In every state with regulated cannabis, there is a requirement to label the potency of products so consumers can make informed purchasing and medicating decisions. The regulations usually state that the THC/cannabinoid content on the label must be within a particular relative percent difference of the actual tested results for the product to be salable. In California, that threshold is +/- 10%.

The problem is, with all the focus on THC percentage in flower and concentrate products, enormous pressure has been placed on cultivators and manufacturers to push their numbers up. Higher numbers = higher prices. But unfortunately, improving their growing, extraction and formulation processes only gets companies so far. So, they proceed to ‘lab shop’: giving their business to whichever lab provides them the highest potency.

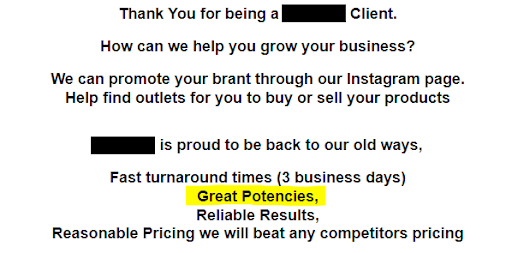
There are roughly 50 Department of Cannabis Control (DCC) licensed labs in the state, and competition is fierce to maintain market share in a maturing and plateauing industry. Whereas competition used to be healthy and revolved around quality, turnaround time and customer service, now it’s essentially become a numbers game. As a result, many labs have sacrificed their scientific integrity to chase what the clients want: higher THC potency results without contaminant failures. The practice has become so prevalent that labs openly advertise their higher potency values to gain customers without fear of recourse. Here are two examples:


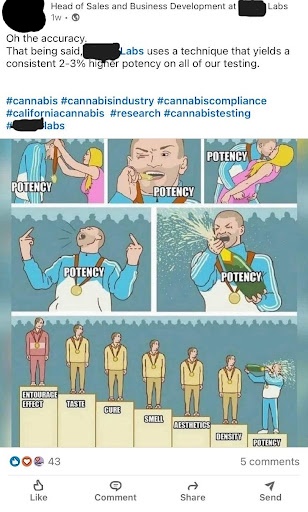
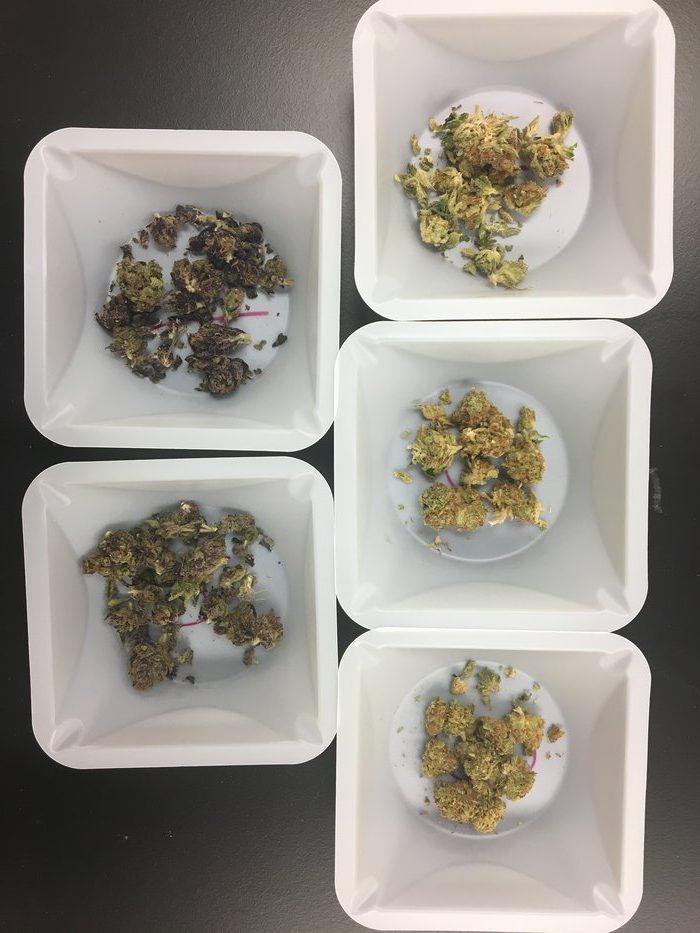
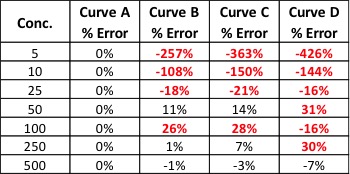
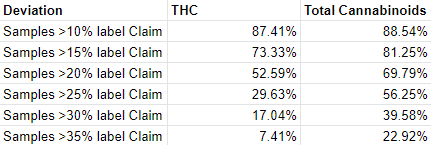
Over a year ago, a few labs fed up with what was happening got together to determine the extent of the potency inflation issue. We proactively purchased and tested over 150 randomly chosen flower samples off dispensary shelves. The results were staggering. Eighty-seven percent of the samples failed their label claims (i.e., were >10% deviant of their labeled values), with over half of the samples >20% deviant of their labeled THC values (i.e., over 2x the legal permitted variance). Additionally, our labs found multiple cases of unreported category 1 pesticides in some of the analyzed samples at multiple times the legal limit – a significant public health concern. The deceit was not limited to small cultivators trying to get by but also some of the industry’s biggest brands.

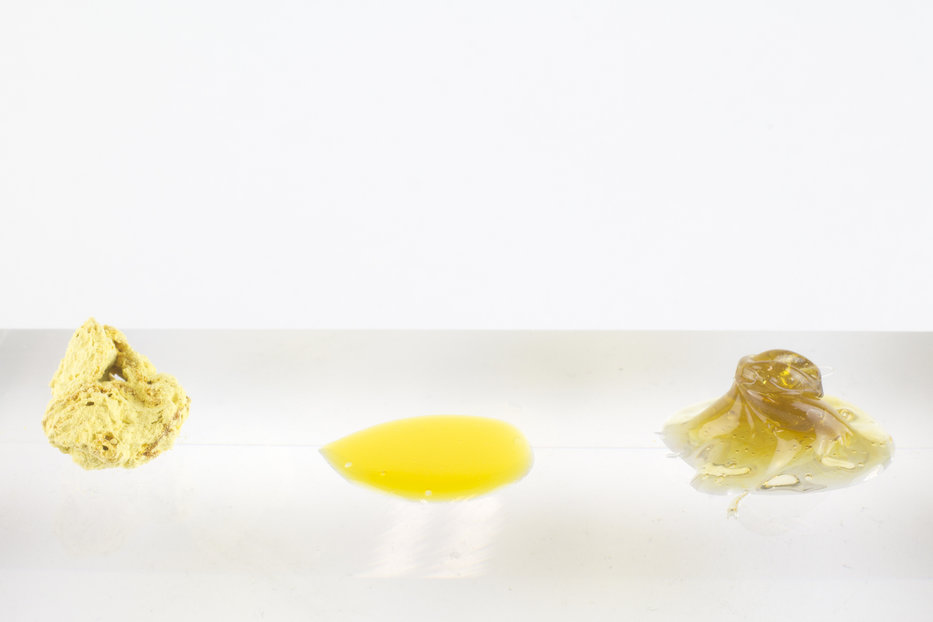
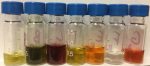
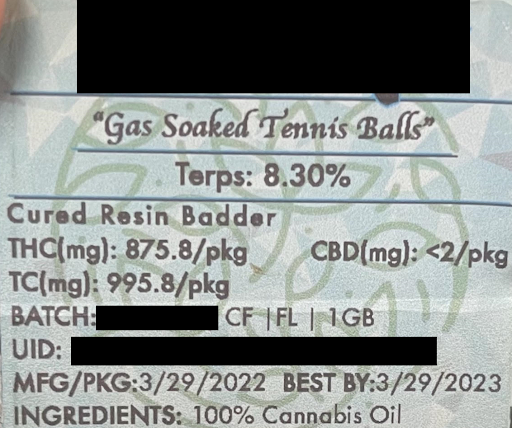
The same issues and economic conditions are in play for concentrates. Manufacturers of these products also hunt for the highest D9 THC values because wholesale prices for distillate are determined by THC content: <86% for the lowest value, 86-88%, 88-90% and >90%, with a new price point for over 94%. As a result, consumers can walk into a dispensary and find concentrates like the one shown below that report>99% total cannabinoids (>990mg/g) and contains almost 10% additional terpenes. You don’t have to be an analytical chemist to realize those numbers add up to well over 100%, which is physically impossible.

Blame

Everyone can agree that the system is broken, but who is at fault? Should the blame be placed on dispensaries, many of whom use THC % as their only purchasing or marketing metric? Or on cultivators, manufacturers and distributors, who seek the highest results possible rather than the most accurate ones? Or on the labs themselves, who are knowingly reporting inflated results?

Ultimately, the individual businesses are acting in their own self-interest, and many are participating in this practice simply to stay afloat. Dispensaries can’t reasonably be expected to know which results are inflated and which are not. Cultivators and manufacturers feel obligated to use labs that provide them with the highest results; otherwise, they’re putting themselves at a disadvantage relative to their competitors. Likewise, labs that aren’t willing to inflate their numbers have to be ready to watch customers walk out the door to maintain their principles – an existential dilemma for many.

The primary reason why potency inflation has become so prevalent is that there have been no negative repercussions for those that are cheating.  

The axiom is true – don’t hate the player, hate the game. Unlike most businesses, testing labs operating with integrity want meaningful regulations and oversight to assure a level playing field. Without them, the economics force a race to the bottom where labs either have to inflate more and more or go out of business. Since 2016, the DCC (formerly BCC) has taken zero meaningful actions to discourage or crackdown on potency inflation— not a single recall of an inflated product or license suspension of an inflating lab— so predictably, the problem has gotten progressively worse over time.

So, to answer the question above – who is at fault for our broken system? The answer is simple: the DCC.

Inaction

In the Fall of 2021, we began engaging with the DCC to address the industry’s potency inflation concerns. The DCC requested we provide them with direct evidence of our accusations, so we collected and shared the flower data mentioned above. The Department tested the same batches off the shelf and confirmed our results. Somehow not a single recall was issued – even for the batches containing category 1 pesticides.

We pushed for more accountability, and DCC Director Nicole Elliott assured us steps were being taken: “The Department is in the process of establishing a number of mechanisms to strengthen compliance with and accountability around the testing methods required of labs and will be sharing more about that in the near future.”

Instead, we got a standardized cannabinoid potency method (mandated by SB 544) that all labs will be required to use. On the surface, a standardized methodology sounds like a good thing to level the playing field by forcing suspect labs into accepting generally accepted best practices. In reality, however, most labs already use the same basic methodology for flower and concentrate cannabinoid profiling and inflate their results using a variety of other mechanisms: selective sampling, using advantageous reference materials, manipulating data, etc. Furthermore, the method mandated is outdated and will flatly not work for various complex matrices such as gummies, topicals, beverages, fruit chews and more. If adopted without changes, it would be a disaster for manufacturers of these products and the labs that test them. Nevertheless, the press release issued by the DCC reads as though they’ve earned a pat on the back and delivered the silver bullet to the potency inflation issue.

Here are a few more meaningful actions the DCC could take that would help combat potency inflation:

  • Perform routine surveillance sampling and testing of products off of store shelves either at the DCC’s internal lab or by leveraging DCC licensed private labs.
  • Recall products found to be guilty of extreme levels of potency inflation.
  • Conduct in-person, unannounced audits of all labs, perhaps focusing on those reporting statistically higher THC results.
  • Conduct routine round-robin studies where every lab tests the same sample and outliers are identified.
  • Shutdown labs that are unable or unwilling to remediate their potency inflation issues.

For some less disciplinary suggestions:

  • Remove incentives for potency inflation, like putting a tax on THC percentage
  • Set up routine training sessions for labs to address areas of concern and improve communication with the DCC

Fight

Someone might retort – who cares if the number is slightly higher than it should be? No one will notice a little less THC in their product. A few counterpoints:

  1. Consumers are being lied to and paying more for less THC.
  2. Medical cannabis users depend on specific dosages for intended therapeutic effects.
  3. Ethical people who put their entire lives into cultivating quality cannabis, manufacturing quality products and accurately testing cannot compete with those willing to cheat. If things get worse, only the unethical actors will be left.
  4. Labs that inflate potency are more likely to ignore the presence of contaminants, like the category 1 pesticides we found in our surveillance testing.
  5. This single compound, delta-9 THC, is the entire reason why this industry is so highly regulated. If we are not measuring it accurately, why regulate it at all?

We will continue to fight for a future where quality and ethics in the cannabis industry are rewarded rather than penalized. And consumers can have confidence in the quality and safety of the products they purchase. Our labs are willing to generate additional surveillance data, provide further suggestions for improvement in regulations/enforcement, and bring further attention to this problem. But there is a limit to what we can do. In the end, the health and future of our industry are entirely in the hands of the DCC. We hope you will join us in calling on them to enact meaningful and necessary changes that address this problem.

AOAC Launches Cannabis Proficiency Testing Program

By Cannabis Industry Journal Staff
2 Comments

In a press release published this week, AOAC International announced it has partnered with Signature Science, LLC as the test material provider for the new AOAC Cannabis/Hemp Proficiency Testing program. What makes this proficiency testing (PT) program so unique is that AOAC will be the only PT provider to offer actual cannabis flower as the matrix.

This month, the pilot round with twenty cannabis testing labs begins with hemp-only samples being shipped in early May. The first live round of the PT program is scheduled for November of this year and will offer participating labs the choice of cannabis flower samples or hemp samples.

The program will include one sample for cannabinoid and terpene profiles, moisture and heavy metals, as well as a second sample for pesticide residue testing. According to the press release, mycotoxins will be added to the mix soon.

The new PT program was developed by stakeholders involved with the AOAC Cannabis Analytical Science Program (CASP), including state regulatory labs, industry labs, state and federal agencies and accreditation bodies. Shane Flynn, senior director of AOAC’s PT program, says the program is a result of scientists coming to them with concerns about testing in the cannabis space. “AOAC has a long history of bringing scientists together to address emerging topics, so when stakeholders came to AOAC with their concerns and need for quality proficiency testing in the cannabis industry, AOAC acted,” says Flynn. “Stakeholders noted the analytical differences in testing cannabis versus hemp and had specific concerns around it and asked for a program that would provide actual cannabis samples in addition to hemp. This is truly a program that was created by the stakeholders, for the stakeholders.”

AOAC says they plan on introducing microbiology to the PT program, with microbial contamination tests in both cannabis and hemp samples. They are also considering adding additional matrices, like chocolate and gummies.

Signature Science is an ISO 17043 accredited proficiency test provider that also has a DEA-licensed controlled substances lab, making them an ideal candidate to partner with AOAC for the PT Program. They entered into a 3-year MoU with AOAC for the program. Their team developed and validated methods used to create the samples for the PT program at their DEA-licensed lab in Austin, Texas.

Busting the THC Myth: When it Comes to the Best User Experience, Terpenes Reign Supreme

By Mark Lange, PhD
No Comments

The scent of pine from your Christmas tree. The fragrance of a ripe summer peach at the farmer’s market. The whiff of eucalyptus and lavender that greets you when you enter a spa.

Aroma is a keystone in how we experience the world. In any given environment, aroma can help shape your mood, solidify memories and instantly transport you to another place or time.

I have focused my career on studying the fascinating compounds that are often behind these powerful aromas: terpenes. They form the largest class of natural products (compounds produced by living organisms), found in nearly all living beings. There are around 50,000 currently known terpenes in nature — with potentially thousands yet to be discovered.

Terpene-rich plants you might be most familiar with are lavender, mint, oranges (in the peel), and yes, cannabis. In recent years, terpenes have rightfully become a central discussion in the recreational cannabis world. This is because terpenes — not THC level, not “Indica-Sativa” classification — are a key determinant of cannabis’s effect, both psychoactive and non-psychoactive. But the current lack of prioritization and understanding of the crucial role terpenes play may put the collective quality of U.S. cannabis at risk.

At this crucial inflection point for legal cannabis, on its path to becoming a $70 billion dollar global industry by 2028, we need to ensure that everyone across the cannabis space, from breeders to testers, growers and consumers, understands which traits to prioritize for a cannabis world brimming with diversity and predictable effects.

What the cannabis industry has to lose 

What do we lose if the cannabis industry continues to scale without a clear understanding of the compounds that define the uniqueness of each variety?

There is a ripple effect across the ecosystem. For cannabis testing labs, focusing on only twenty of the most dominant terpenes means we are missing out on tapping into potentially over a hundred of less common terpenes in cannabis. For the cannabis consumer, lack of understanding on the breeding and testing side may make it difficult to find cannabis that delivers on its promised effect time and time again. And, most detrimentally for breeders, not understanding the direct correlation between genetics and the formation of terpenes means we will have increasingly fewer terpene profiles and combinations to work with, especially when the industry-dominant focus has been on cannabinoid potency.

Let’s explore some misconceptions related to potency. In recent years, many breeders have prioritized high THC levels over genetic diversity. Consumers often associate high THC levels and that telltale strong “skunky” aroma with a strain’s quality and effect, when in reality, these are poor indicators of potency. (In fact, recent research indicates that this specific cannabis aroma is caused by a family of sulfur compounds.) Terpene profiling is a much more accurate way to determine a variety’s given effect. In focusing too much on increasing THC, breeders miss out on the true potency powerhouse: tapping into the terpene diversity that’s out there.

Terpenes are responsible for giving flowers (including cannabis), fruits and spices their distinctive flavors and aromas. Common terpenes include limonene, linalool, pinene and myrcene.

To illustrate the impact of breeding practices that prioritize crop yield over product quality, I first have a question for you: When was the last time you enjoyed a really good tomato?

If you’re lucky enough to have a great farmer’s market nearby, maybe you purchased an heirloom tomato at peak freshness last August. It was likely fragrant, flavorful and didn’t need much preparation to be enjoyable.

Or maybe you can’t remember the last time you’ve eaten a good tomato, as the last standard grocery store tomato you purchased was watery, tasteless and essentially scentless.

Tomatoes are a prime example of what is unfortunately true for a whole host of traditional crop plants in the U.S. When yield is the goal, flavor and aroma profiles often suffer. The culprit: lack of genetic diversity in the breeding process. The tragedy of the tomato serves as a harbinger for the cannabis industry — and we can draw parallels to what we’ve seen happen to cannabis.

What the cannabis industry should do: Tap into the diversity that’s out there

An important aspect of preventing cannabis from going the way of the tomato is to better understand the genes that generate these different terpene profiles. Different cultivars with varying aromas will hold different collections of genes. We as an industry must learn more about which terpenes correlate with desirable aromas, and then access already existing genetic diversity.

We have just begun to scratch the surface of the potential of terpenes in cannabis. With the right alignment across the industry and a stronger focus on genetics in breeding, we will see the rise of completely unique cannabis varieties. They will smell like lavender, lilac, orange peel or even brand-new aromas that have yet to be discovered. To ensure this future, we need to prioritize the right traits and the right genetics.

Advancements in Extraction & the Growth of the Concentrate Category

By Dr. Dominick Monaco
No Comments

Due to quick progressions in legalization, today’s cannabis industry bears little resemblance to the industry of five years ago. As the cannabis space gains mainstream acceptance, it resembles more “traditional” industries closely. In turn, how we consume cannabis has changed dramatically within this novel legal framework.

A brief visit to a cannabis dispensary quickly illuminates just how much the industry has changed in the past few years.

Within the dynamic of modern cannabis, perhaps no vertical has seen the same advancements as cannabis extracts. It’s precisely the growth of the concentrate category that has given rise to the many branded products that define the legal market.

To give a clear picture of how advancements in extraction have stimulated the concentrate category’s growth, we put together this brief exploration.

Standards & Technology

extraction equipmentBefore legalization, the production of cannabis extracts was a shady affair done in clandestine and often dangerous ways. Especially concerning BHO (Butane Hash Oil), home-based laboratories have long since been notorious fire hazards. Even more, with a total lack of regulation, black-market extracts are infamous for containing harmful impurities.

In the few short years that cannabis has been legal in Nevada, Washington and other states, extract producers have adopted standards and technology from more professional arenas. By borrowing from the food and pharmaceutical industries, concentrate companies have achieved excellence undreamed of a decade ago.

Good Manufacturing Practices

One of the essential elements in the extracts vertical advancements is the adoption of good manufacturing practices. According to the World Health Organization website, “Good Manufacturing Practice (GMP) is that part of quality assurance which ensures that products are consistently produced and controlled to the quality standards appropriate to their intended use.”

When adult-use cannabis was legalized in markets such as Colorado, cannabis companies were able to come out of the shadows and discuss GMPs with legit businesses. In doing so, they implemented professional controls on extract manufacturing in accordance with “quality standards” of state regulatory agencies.

Supercritical CO2 Extraction

As cannabis businesses adopted GMP from other industries, extract producers also embraced more sophisticated technology. Of these, supercritical CO2 has pushed the cannabis concentrates vertical into the future.

IVXX processingAccording to the equipment manufacturer Apeks Supercritical, “CO2 is considered to be a safer method of extraction because the solvent is non-volatile. The extract is purer because no trace of the solvent is left behind. It is also versatile and helps protect sensitive terpenes, by allowing cold separation.” By deriving methods from food production, supercritical equipment manufacturers have given cannabis companies a viable option for the commercial production of extracts.

Supercritical technology has helped push the concentrates vertical forward by providing a clean and efficient way to produce cannabis extracts. Nonetheless, supercritical CO2 equipment is highly sophisticated and carries a hefty price tag. Producers can expect to pay well over $100,000 for commercial supercritical CO2 extraction setup.

Products

Just as standards and technology have evolved in the cannabis extracts vertical, we have also seen products rapidly mature. Notably, the legal environment has allowed manufacturers to exchange ideas and methods for the first time. In turn, this dialogue has led to the development of new products, like isolates and live resin.

Isolates

Just as the name implies, isolates are concentrates made from a singular, pure cannabinoid. In today’s market, CBD isolates have grown increasingly popular because people can consume pure CBD without ingesting other cannabinoids or plant materials, including the legal 0.3% THC found in hemp.

Isolates are made by further purifying cannabis extracts in the process of purification, filtration and crystallization. As seen with other concentrates, isolates are used as the base for many cannabis products, such as gummies.

There is also growing interest in CBG isolate, which is another non-psychoactive cannabinoid when consumed orally.

Live Resin

The cannabis concentrate live resin has taken the industry by storm over the past few years. Live resin is a form of extract that is originally sourced from freshly harvested and frozen cannabis plants. The primary selling point behind this extract is the fact that fresh flowers produce much more vibrant aromas and flavors than dried cannabis. Interestingly, this pungency is tied to the preservation of terpenes in live resin.

Just a few of the dozens of various products types on the market today.

To make live resin, producers “flash freeze” fresh cannabis plants immediately after harvest. Valuable cannabinoids and terpenes are then extracted from the fresh, frozen plant material using hydrocarbon solvents. This whole process is done at extremely cold temperatures, ensuring no thermal degradation to the precious and volatile terpenes.

In lieu of these intricate steps to preserve the flower and extracts, live resin has continuously gained popularity. Namely because vaping with live resin is the best way to sample fresh cannabis terpene profiles in its most authentic fashion

It is amazing to see how much cannabis extracts have grown and progressed with legalization. Due to such amazing advancements in standards, technology, and products, the concentrates category has exploded on the dispensary scene. In today’s market, flowers have been largely sidelined in favor of concentrate-based products like gummies. These products now adorn dispensary shelves in beautiful packaging replete with purity and testing specifications.

It’s an often-overlooked fact that the purity standards of the legal extracts have made reliable cannabis brands possible in the first place. You cannot develop a cannabis brand without consistent products that customers can rely on; all things considered, it can be said that advancements in extraction have not only stimulated the concentrate category but the entire industry as we know it today.

Who’s Afraid of Biotech Institute LLC?

By Brett Schuman, Daniel Mello, Nicholas Costanza, Olivia Uitto
No Comments

While cannabis patenting activity is still in its infancy, relatively speaking, a lot has been written already about the cannabis patenting activity of an entity called Biotech Institute LLC (BI) of Westlake Village, California.1 BI is building a sizable portfolio of utility and plant patents covering various aspects of the cannabis plant. According to some commentators, BI’s patents have “many in the cannabis industry concerned.”2

But how concerned should members of the cannabis industry really be about BI’s patents? Generally, patents are susceptible to numerous challenges in multiple fora. From 2012-2016, approximately 80% of challenged patents were invalidated by the Patent Trial and Appeal Board (PTAB) each year.3 The PTAB was created in 2011 by the Leahy-Smith America Invents Act, 35 U.S.C. § 6, to create a process for eliminating improvidently issued patents. And the statistics suggest that the process may be working as intended by Congress.

BI may be building its portfolio by taking advantage of some unique challenges in the cannabis patenting area. First, even though cannabis has been cultivated and consumed by humans for thousands of years, there is a relative lack of published prior art available to patentees and patent examiners examining patent applications.4 Second, patent examiners are not as familiar with cannabis patent applications as they may be with other types of patent applications.

So, we examined carefully BI’s earliest and arguably broadest utility patent, U.S. Patent No. 9,095,554, and concluded that maybe the cannabis industry need not be so concerned about this and some of BI’s other utility patents. Although the ’554 patent is lengthy – 247 columns of text and over an inch thick when printed in hardcopy – there appears to be little if any novelty to the claimed invention. Alternatively, the patent appears to be obvious in light of the available prior art.

In a patent, the claims define the metes and bounds of the patentee’s intellectual property. Claim 1 of the ’554 patent recites:

  1. A hybrid cannabis plant, or an asexual clone of said hybrid cannabis plant, or a plant part, tissue, or cell thereof, which produces a female inflorescence, said inflorescence comprising:
  1. a BT/BD genotype;
  2. a terpene profile in which myrcene is not the dominant terpene;
  3. a terpene oil content greater than about 1.0% by weight; and
  4. a CBD content greater than 3%;
  5. wherein the terpene profile is defined as terpinolene, alpha phelladrene, beta ocimene, careen, limonene, gamma terpinene, alpha pinene, alpha terpinene, beta pinene, fenchol, camphene, alpha terpineol, alpha humulene, beta caryophyllene, linalool, cary oxide, and myrcene, and wherein the terpene oil content is determined by the additive content of the terpenes in the terpene profile; and wherein the terpene contents and CBD content are measured by gas chromatography-flame ionization detection (GC-FID) and calculated based on dry weight of the inflorescence; wherein a representative sample of seed producing said plants has been deposited under NCIMB Nos. 42246, 42247, 42248, 42249, 42250, and 42254.

While claim elements define the metes and bounds of the invention, typically only certain claim elements are intended to distinguish the claimed invention from the prior art. Other claim elements merely help to describe the invention. For example, the preamble in the ‘554 patent, or the part of the claim before subpart (a), describes the flowering part of the cannabis plant. This is not intended to describe anything novel about the claimed invention, but rather it simply describes the part of the cannabis plant that is relevant to the invention.

The structure of cannabidiol (CBD), one of 400 active compounds found in cannabis.

Before the priority date of the ’554 patent, it was known in the prior art that BT/Bgenotypes produce nearly equal amounts of THC and CBD (both are dominant; one is not recessive).5 Thus, it is not unexpected to have a CBD content greater than 3% in a genotype that can produce large amounts of CBD (known references state as high as 21% in CBD-dominant strains and 3%-15% in BT/Bgenotypes).6 Further, it was known in the prior art that terpenes generally constitute more than 1.0% percent by weight (usually between 2-4%) of the flower.7

As these databases continue to grow and studies of cannabis are publicly disclosed, cannabis patents like BI’s ’554 patent will become more and more susceptible to patent challenges and invalidation.Claim element (b), reciting a terpene profile in which myrcene is not the dominant terpene, appears to be one of – if not the only – claimed element of novelty of the BI invention. Terpenes are aromatic compounds produced in plants, and the cannabis plant has more than 100 different terpenes. Claim element (e) simply lists the most abundant terpenes in the cannabis plant. A majority of cannabis strains express high levels of myrcene; however, there are known prior art strains that express high levels of other terpenes, such as caryophyllene, limonene, pinene, etc. Additionally, it is well known in the art that terpenes have different therapeutic effects. For example, pinene and linalool are known to have antidepressant activity.8 Thus, a prior disclosure of a BT/Bgenotype that has a terpene profile where myrcene is not the dominate terpene very likely invalidates this claim. And even assuming there is any novelty to a high-CBD strain where myrcene is not the dominant terpene, there is a motivation to breed for a dominant terpene besides myrcene.

Because cannabis has been and remains a Schedule I drug under the Controlled Substances Act, previously known and used strains generally have not been chemically characterized, studied, researched, and the subject of publications that can be used as prior art for purposes of challenging cannabis patents. But that is changing. For example, the Open Cannabis Project (OCP) attempted to characterize and publish chemical details of cannabis plants. Even though OCP closed as of May 31, 2019, is database is still publicly available. Another example is CANNA, a non-profit initiative of the CANNA Espana Fertilizantes SL company, which carries out studies and conducts research on cannabis and its active compounds.9 In one study,10 CANNA found that some strains have terpene profiles where myrcene is not the dominant terpene, which could be relevant to a novelty-based or obviousness challenge to claim 1 of the ‘554 patent. As these databases continue to grow and studies of cannabis are publicly disclosed, cannabis patents like BI’s ’554 patent will become more and more susceptible to patent challenges and invalidation.


References

  1. See, e.g.,Amanda Chicago Lewis, The Great Pot Monopoly Mystery, GQ (August 23, 2017), https://www.gq.com/story/the-great-pot-monopoly-mystery;  Brian Wroblewski, Utility Patents on Marijuana? Who is BioTech Institute LLC?, The National Marijuana News, https://thenationalmarijuananews.com/utility-patents-marijuana-biotech-institute-llc/; Eric Sandy, Biotech Institute Has Applied for Patents on 8 Individual Cannabis Cultivars, Cannabis Business Times(June 24, 2019), https://www.cannabisbusinesstimes.com/article/biotech-institute-cannabis-patent-applications/.
  2. Nicole Grimm, George Lyons III, and Brett Scott, Biotech Institute’s Growing Patent Portfolio — U.S. Patent No. 9,095,554 and the Path Forward, JD Supra (November 17, 2017), https://www.jdsupra.com/legalnews/biotech-institute-s-growing-patent-17433/.
  3. World Intellectual Property Organization, An overview of patent litigation systems across jurisdictions,World Intellectual Property Indicators 2018, https://www.wipo.int/edocs/pubdocs/en/wipo_pub_941_2018-chapter1.pdf.
  4. Brett Schuman et al., Emerging Patent Issues In The Cannabis Industry, Law360(February 20, 2018), https://www.goodwinlaw.com/-/media/files/publications/emerging-patent-issues-in-the-cannabis-industry.pdf.
  5. Chandra, et al. Cannabis sativa L. – Botany and Biotechnology, pages 142-144, Springer, 2017 (citing de Meijer, Genetics163: 225-346 (2003)). See alsoMolecular Breeding (2006) 17:257-268, doi/10.1007/s11032-005-5681-x. 
  6. American Journal of Botany 91(6): 966:975 (2004). doi.org/10.3732/ajb.91.6.966; See e.g., Jikomes, Peak THC: The Limits on THC and CBD Levels for Cannabis Strainshttps://www.leafly.com/news/science-tech/peak-thc-cbd-levels-for-cannabis-strains.
  7. PLoS One. 2017; 12(3): e0173911. doi: 10.1371/journal.pone.0173911.  See also, Fischedick J. T., Hazekamp A., Erkelens T., Choi Y. H., Verpoorte R. (2010). Phytochemistry712058–2073 (2010). 10.1016/j.phytochem.2010.10.001
  8. J Ethnopharmacol. 2012 Sep 28;143(2):673-9. doi: 10.1016/j.jep.2012.07.026. Epub 2012 Jul 31.
  9. Retrieved from https://www.fundacion-canna.es/en/about-us, on August 6, 2019.
  10. Retrieved from https://www.fundacion-canna.es/en/variations-terpene-profiles-different-strains-cannabis-sativa-l, on August 6, 2019.
Dr. Allison Justice

Exploration and Optimization of Drying and Curing

By Cannabis Industry Journal Staff
1 Comment
Dr. Allison Justice

Cannabis Cultivation Virtual Conference Part 4

Exploration and Optimization of Drying and Curing

By Dr. Allison Justice, Vice President of Cultivation at Outco

This presentation discusses:

  • Prized French wines are aged for years in oak barrels, as are famous whiskies. Tobacco is air-, fire-, flue- or sun-cured. Cannabis, however, is quickly dried and stored in a plastic bucket. Although many cannabis growers have proprietary ways of making flower flavorful and aromatic, little to no research is available for consistency.
  • Anecdotal examples show that chemical makeup is not only dictated by the strain/cultivar, but also influenced by grow methods, drying and curing. The lack of data prompted us to research what is happening during these processes. In this session, we will present our research at OutCo of how to affect and control the chemical makeup of flower; new protocols to monitor the dry and cure of cannabis flowers so we are able to modulate the terpene and cannabinoid profiles in our strain offering; and our latest findings in this exciting field of post-harvest cannabis research.

dSPE cleanups

The Grass Isn’t Always Greener: Removal of Purple Pigmentation from Cannabis

By Danielle Mackowsky
1 Comment
dSPE cleanups
strains
Cannabis strains used (clockwise from top left): Agent Orange, Tahoe OG, Blue Skunk, Grand Daddy and Grape Drink

Cannabis-testing laboratories have the challenge of removing a variety of unwanted matrix components from plant material prior to running extracts on their LC-MS/MS or GC-MS. The complexity of the cannabis plant presents additional analytical challenges that do not need to be accounted for in other agricultural products. Up to a third of the overall mass of cannabis seed, half of usable flower and nearly all extracts can be contributed to essential oils such as terpenes, flavonoids and actual cannabinoid content1. The biodiversity of this plant is exhibited in the over 2,000 unique strains that have been identified, each with their own pigmentation, cannabinoid profile and overall suggested medicinal use2. While novel methods have been developed for the removal of chlorophyll, few, if any, sample preparation methods have been devoted to removal of other colored pigments from cannabis.

QuEChERS
Cannabis samples following QuEChERS extraction

Sample Preparation

Cannabis samples from four strains of plant (Purple Drink, Tahoe OG, Grand Daddy and Agent Orange) were hydrated using deionized water. Following the addition of 10 mL acetonitrile, samples were homogenized using a SPEX Geno/Grinder and stainless steel grinding balls. QuEChERS (Quick, Easy, Cheap, Effective, Rugged and Safe) non-buffered extraction salts were then added and samples were shaken. Following centrifugation, an aliquot of the supernatant was transferred to various blends of dispersive SPE (dSPE) salts packed into centrifugation tubes. All dSPE tubes were vortexed prior to being centrifuged. Resulting supernatant was transferred to clear auto sampler vials for visual analysis. Recoveries of 48 pesticides and four mycotoxins were determined for the two dSPE blends that provided the most pigmentation removal.

Seven dSPE blends were evaluated for their ability to remove both chlorophyll and purple pigmentation from cannabis plant material:

  • 150 mg MgSO4, 50 mg PSA, 50 mg C18, 50 mg Chlorofiltr®
  • 150 mg MgSO4, 50 mg C18, 50 mg Chlorofiltr®
  • 150 mg MgSO4, 50 mg PSA
  • 150 mg MgSO4, 25 mg C18
  • 150 mg MgSO4, 50 mg PSA, 50 mg C18
  • 150 mg MgSO4, 25 mg PSA, 7.5 mg GCB
  • 150 mg MgSO4, 50 mg PSA, 50 mg C18, 50 mg GCB

Based on the coloration of the resulting extracts, blends A, F and G were determined to be the most effective in removing both chlorophyll (all cannabis strains) and purple pigments (Purple Drink and Grand Daddy). Previous research regarding the ability of large quantities of GCB to retain planar pesticides allowed for the exclusion of blend G from further analyte quantitation3. The recoveries of the 48 selected pesticides and four mycotoxins for blends A and F were determined.

dSPE cleanups
Grand Daddy following various dSPE cleanups

Summary

A blend of MgSO4, C18, PSA and Chlorofiltr® allowed for the most sample clean up, without loss of pesticides and mycotoxins, for all cannabis samples tested. Average recovery of the 47 pesticides and five mycotoxins using the selected dSPE blend was 75.6% were as the average recovery when including GCB instead of Chlorofiltr® was 67.6%. Regardless of the sample’s original pigmentation, this blend successfully removed both chlorophyll and purple hues from all strains tested. The other six dSPE blends evaluated were unable to provide the sample clean up needed or had previously demonstrated to be detrimental to the recovery of pesticides routinely analyzed in cannabis.


References

(1)           Recommended methods for the identification and analysis of cannabis and cannabis products, United Nations Office of Drugs and Crime (2009)

(2)            W. Ross, Newsweek, (2016)

(3)            Koesukwiwat, Urairat, et al. “High Throughput Analysis of 150 Pesticides in Fruits and Vegetables Using QuEChERS and Low-Pressure Gas Chromatography Time-of-Flight Mass Spectrometry.” Journal of Chromatography A, vol. 1217, no. 43, 2010, pp. 6692–6703., doi:10.1016/j.chroma.2010.05.012.

Multi-analyte Configuration for Cannabis Testing Services

Managing Cannabis Testing Lab Workflows using LIMS

By Dr. Susan Audino
No Comments
Multi-analyte Configuration for Cannabis Testing Services

With the state led legalization of both adult recreational and medical cannabis, there is a need for comprehensive and reliable analytical testing to ensure consumer safety and drug potency. Cannabis-testing laboratories receive high volumes of test requests from cannabis cultivators for testing quantitative and qualitative aspects of the plant. The testing market is growing as more states bring in stricter enforcement policies on testing. As the number of testing labs grow, it is anticipated that the laboratories that are now servicing other markets, including high throughput contract labs, will cross into cannabis testing as regulations free up. As the volume of tests each lab performs increases, the need for laboratories to make effective use of time and resource management, such as ensuring accurate and quick results, reports, regulatory compliance, quality assurance and many other aspects of data management becomes vital in staying competitive.

Cannabis Testing Workflows

To be commercially competitive, testing labs offer a comprehensive range of testing services. These services are available for both the medical and recreational cannabis markets, including:

  • Detection and quantification of both acid and neutral forms of cannabinoids
  • Screening for pesticide levels
  • Monitoring water activity to indicate the possibility of microbiological contamination
  • Moisture content measurements
  • Terpene profiling
  • Residual solvents and heavy metal testing
  • Fungi, molds, mycotoxin testing and many more

Although the testing workflows differ for each test, here is a basic overview of the operations carried out in a cannabis-testing lab:

  1. Cannabis samples are received.
  2. The samples are processed using techniques such as grinding and homogenization. This may be followed by extraction, filtration and evaporation.
  3. A few samples will be isolated and concentrated by dissolving in solvents, while others may be derivatized using HPLC or GC reagents
  4. The processed samples are then subjected to chromatographic separation using techniques such as HPLC, UHPLC, GC and GC-MS.
  5. The separated components are then analyzed and identified for qualitative and quantitative analysis based on specialized standards and certified reference materials.
  6. The quantified analytical data will be exported from the instruments and compiled with the corresponding sample data.
  7. The test results are organized and reviewed by the lab personnel.
  8. The finalized test results are reported in a compliant format and released to the client.

In order to ensure that cannabis testing laboratories function reliably, they are obliged to follow and execute certain organizational and regulatory protocols throughout the testing process. These involve critical factors that determine the accuracy of testing services of a laboratory.

Factors Critical to a Cannabis Testing Laboratory 

  • Accreditations & Regulatory Compliance: Cannabis testing laboratories are subject to regulatory compliance requirements, accreditation standards, laboratory practices and policies at the state level. A standard that most cannabis testing labs comply to is ISO 17025, which sets the requirements of quality standards in testing laboratories. Accreditation to this standard represents the determination of competence by an independent third party referred to as the “Accreditation Body”. Accreditation ensures that laboratories are adhering to their methods. These testing facilities have mandatory participation in proficiency tests regularly in order to maintain accreditation.
  • Quality Assurance, Standards & Proficiency Testing: Quality assurance is in part achieved by implementing standard test methods that have been thoroughly validated. When standard methods are not available, the laboratory must validate their own methods. In addition to using valid and appropriate methods, accredited laboratories are also required to participate in appropriate and commercially available Proficiency Test Program or Inter-Laboratory Comparison Study. Both PT and ILC Programs provide laboratories with some measure of their analytic performance and compare that performance with other participating laboratories.

    Multi-analyte Configuration for Cannabis Testing Services
    CloudLIMS Cannabis Testing LIMS: Multi-analyte Configuration for Cannabis Testing Services
  • Real-time Collaboration: Testing facilities generate metadata such as data derived from cannabis samples and infused products. The testing status and test results are best served for compliance and accessibility when integrated and stored on a centralized platform. This helps in timely data sharing and facilitates informed decision making, effective cooperation and relationships between cannabis testing facilities and growers. This platform is imperative for laboratories that have grown to high volume throughput where opportunities for errors exist. By matching test results to samples, this platform ensures consistent sample tracking and traceability. Finally, the platform is designed to provide immediate, real-time reporting to individual state or other regulatory bodies.
  • Personnel Management: Skilled scientific staff in cannabis-testing laboratories are required to oversee testing activities. Staff should have experience in analytical chromatography instruments such as HPLC and GC-MS. Since samples are often used for multi-analytes such as terpenes, cannabinoids, pesticides etc., the process often involves transferring samples and tests from one person to another within the testing facility. A chain of custody (CoC) is required to ensure traceability and ‘ownership’ for each person involved in the workflow.

LIMS for Laboratory Automation

Gathering, organizing and controlling laboratory-testing data can be time-consuming, labor-intensive and challenging for cannabis testing laboratories. Using spreadsheets and paper methods for this purpose is error-prone, makes data retrieval difficult and does not allow laboratories to easily adhere to regulatory guidelines. Manual systems are cumbersome, costly and lack efficiency. One way to meet this challenge is to switch to automated solutions that eliminate many of the mundane tasks that utilize valuable human resources.. Laboratory automation transforms the data management processes and as a result, improves the quality of services and provides faster turnaround time with significant cost savings. Automating the data management protocol will improve the quality of accountability, improve technical efficiency, and improve fiscal resources.

cloudlims screenshot
Real Time Test Status in CloudLIMS

A Laboratory Information Management System (LIMS) is a software tool for testing labs that aids efficient data management. A LIMS organizes, manages and communicates all laboratory test data and related information, such as sample and associated metadata, tests, Standard Operating Procedures (SOPs), test reports, and invoices. It also enables fully automated data exchange between instruments such as HPLCs, GC-FIDs, etc. to one consolidated location, thereby reducing transcription errors.

How LIMS Helps Cannabis Testing Labs

LIMS are much more capable than spreadsheets and paper-based tools for streamlining the analytical and operational lab activities and enhances the productivity and quality by eliminating manual data entry. Cloud-enabled LIMS systems such as CloudLIMS are often low in the total cost of acquisition, do not require IT staff and are scalable to help meet the ever changing business and regulatory compliance needs. Some of the key benefits of LIMS for automating a cannabis-testing laboratory are illustrated below [Table 1]:

Key Functionality Benefit
Barcode label designing and printing Enables proper labelling of samples and inventory

Follows GLP guidelines

Instant data capture by scanning barcodes Facilitates quick client registration and sample access
3600 data traceability Saves time and resources for locating samples and other records
Inventory and order management Supports proactive planning/budgeting and real time accuracy
Custodian management Promotes overall laboratory organization by assigning custodians for samples and tests

Maintains the Chain-of-custody (CoC)

Test management Accommodates pre-loaded test protocols to quickly assign tests for incoming samples
Accounting for sample and inventory quantity Automatically deducts sample and inventory quantities when consumed in tests
Package & shipment management Manages incoming samples and samples that have been subcontracted to other laboratories
Electronic data import Electronically imports test results and metadata from integrated instruments

Eliminates manual typographical errors

Report management Generates accurate, customizable, meaningful and test reports for clients

Allows user to include signatures and additional sections for professional use

21 CFR Part 11 compliant Authenticates laboratory activities with electronic signatures
ISO 17025 accreditation Provides traceable documentary evidence required to achieve ISO 17025 accreditation
Audit trail capabilities Adheres to regulatory standards by recording comprehensive audit logs for laboratory activities along with the date and time stamp
Centralized data management Stores all the data in a single, secure database facilitating quick data retrieval
Workflow management Promotes better data management and resource allocation
High-configurability Enables modification of screens using graphical configuration tools to mirror testing workflows
State compliance systems Integrates with state-required compliance reporting systems and communicates using API
Adheres to regulatory compliance Creates Certificates of Analysis (CoA) to prove regulatory compliance for each batch as well as batch-by-batch variance analysis and other reports as needed.
Data security & confidentiality Masks sensitive data from unauthorized user access


Cloud-based LIMS encrypts data at rest and in-transit while transmission between the client and the server

Global accessibility Cloud-based LIMS provides real-time access to laboratory data from anytime anywhere
Real-time collaboration Cloud-based LIMS enhances real-time communication within a laboratory, between a laboratory and its clients, and across a global organization with multiple sites

Table 1. Key functionality and benefits of LIMS for cannabis testing laboratories

Upon mapping the present day challenges faced by cannabis testing laboratories, adopting laboratory automation solutions becomes imperative. Cloud-based LIMS becomes a valuable tool for laboratory data management in cannabis testing laboratories. In addition to reducing manual workloads, and efficient resource management, it helps labs focus on productive lab operations while achieving compliance and regulatory goals with ease.

For more information on this, check out a webinar here: Webinar: How to Meet Cannabis Testing Standards and Regulatory Requirements with LIMS by Stephen Goldman, laboratory director at the State of Colorado certified Cannabis testing facility, PhytaTech.

amandarigdon
The Practical Chemist

Calibration Part II – Evaluating Your Curves

By Amanda Rigdon
No Comments
amandarigdon

Despite the title, this article is not about weight loss – it is about generating valid analytical data for quantitative analyses. In the last installment of The Practical Chemist, I introduced instrument calibration and covered a few ways we can calibrate our instruments. Just because we have run several standards across a range of concentrations and plotted a curve using the resulting data, it does not mean our curve accurately represents our instrument’s response across that concentration range. In order to be able to claim that our calibration curve accurately represents our instrument response, we have to take a look at a couple of quality indicators for our curve data:

  1. correlation coefficient (r) or coefficient of determination (r2)
  2. back-calculated accuracy (reported as % error)

The r or r2 values that accompany our calibration curve are measurements of how closely our curve matches the data we have generated. The closer the values are to 1.00, the more accurately our curve represents our detector response. Generally, r values ≥0.995 and r2 values ≥ 0.990 are considered ‘good’. Figure 1 shows a few representative curves, their associated data, and r2 values (concentration and response units are arbitrary).

Figure 1: Representative Curves and r2 values

Let’s take a closer look at these curves:

Curve A: This represents a case where the curve perfectly matches the instrument data, meaning our calculated unknown values will be accurate across the entire calibration range.

Curve B: The r2 value is good and visually the curve matches most of the data points pretty well. However, if we look at our two highest calibration points, we can see that they do not match the trend for the rest of the data; the response values should be closer to 1250 and 2500. The fact that they are much lower than they should be could indicate that we are starting to overload our detector at higher calibration levels; we are putting more mass of analyte into the detector than it can reliably detect. This is a common problem when dealing with concentrated samples, so it can occur especially for potency analyses.

Curve C: We can see that although our r2 value is still okay, we are not detecting analytes as we should at the low end of our curve. In fact, at our lowest calibration level, the instrument is not detecting anything at all (0 response at the lowest point). This is a common problem with residual solvent and pesticide analyses where detection levels for some compounds like benzene are very low.

Curve D: It is a perfect example of our curve not representing our instrument response at all. A curve like this indicates a possible problem with the instrument or sample preparation.

So even if our curve looks good, we could be generating inaccurate results for some samples. This brings us to another measure of curve fitness: back-calculated accuracy (expressed as % error). This is an easy way to determine how accurate your results will be without performing a single additional run.

Back-calculated accuracy simply plugs the area values we obtained from our calibrators back into the calibration curve to see how well our curve will calculate these values in relation to the known value. We can do this by reprocessing our calibrators as unknowns or by hand. As an example, let’s back-calculate the concentration of our 500 level calibrator from Curve B. The formula for that curve is: y = 3.543x + 52.805. If we plug 1800 in for y and solve for x, we end up with a calculated concentration of 493. To calculate the error of our calculated value versus the true value, we can use the equation: % Error = [(calculated value – true value)/true value] * 100. This gives us a % error of -1.4%. Acceptable % error values are usually ±15 – 20% depending on analysis type. Let’s see what the % error values are for the curves shown in Figure 1.

practical chemist table 1
Table 1: % Error for Back-Calculated Values for Curves A – D

Our % error values have told us what our r2 values could not. We knew Curve D was unacceptable, but now we can see that Curves B and C will yield inaccurate results for all but the highest levels of analyte – even though the results were skewed at opposite ends of the curves.

There are many more details regarding generating calibration curves and measuring their quality that I did not have room to mention here. Hopefully, these two articles have given you some tools to use in your lab to quickly and easily improve the quality of your data. If you would like to learn more about this topic or have any questions, please don’t hesitate to contact me at amanda.rigdon@restek.com.