Tag Archives: QuEChERS

An Evaluation of Sample Preparation Techniques for Cannabis Potency Analysis

By Kelsey Cagle, Frank L. Dorman, Jessica Westland
No Comments

Sample preparation is an essential part of method development and is critical to successful analytical determinations. With cannabis and cannabis products, the analyst is faced with a very challenging matrix and targets that may range from trace level through percent level thus placing considerable demands on the sample preparation techniques.1 The optimal sample preparation, or “extraction”, method for potency analysis of cannabis flower was determined using a methanol extraction coupled with filtration using regenerated cellulose filters. 

In the United States (US), Canada, and other countries where medicinal and/or adult recreational cannabis has been legalized, regulatory entities require a panel of chemical tests to ensure quality and safety of the products prior to retail sales2. Cannabis testing can be divided into two different categories: Quality and Safety. Quality testing, which includes potency analysis (also known as cannabinoid testing or cannabinoid content), is performed to analyze the product in accordance with the producer/grower expectations and government regulations. Safety testing is conducted under regulatory guidelines to ensure that consumers are not exposed to toxicants such as pesticides, mycotoxins, heavy metals, residual solvents and microbial contaminates.

Potency testing evaluates the total amount of cannabinoid content, specifically focusing on tetrahydrocannabinol (THC) and cannabidiol (CBD). In the US, the biggest push for accurate total THC is to differentiate between hemp (legally grown for industrial or medicinal use), which is defined as cannabis sativa with a THC limit ≤ 0.3 %, and cannabis (Cannabis spp.), which is any cannabis plant with THC measured above 0.3 %3. Potency testing is typically performed by liquid chromatography (LC) with UV detection to determine the quantity of major cannabinoids.

In addition to reporting THC and CBD, their respective precursors are also important for reporting total potency. Tetrahydrocannabinolic acid (THCA) is the inactive precursor to THC while cannabidiolic acid (CBDA) is the precursor to CBD.4,5

Methods and Materials

Sample Preparation

All samples were homogenized using an immersion blender with a dry material grinder. The nominal sample amounts were 200 mg of flower, 500 mg of edibles, and 250 mg of candy samples.

Potency Extraction Method (1)

Twenty milliliters (mL) of methanol (MeOH) was added to each sample. The samples were mechanically shaken for 10 minutes and centrifuged for 5 minutes.

Potency Extraction Method (2)

Ten mL of water was added to each sample. The samples were mechanically shaken for 10 minutes. 20 mL of acetonitrile (ACN) was then added to each sample and vortexed. An EN QuEChERS extraction salt packet was added to the sample. The samples were placed on a mechanical shaker for 2 minutes and then centrifuged for 5 minutes.

Each extract was split and evaluated with two filtration/cleanup steps: (1) a regenerated cellulose (RC) syringe filter (Agilent Technologies, 4 mm, 0.45 µm); (2) a PFTE syringe filter (Agilent Technologies, 4 mm, 0.45 µm). The final filtered extracts were injected into the ultra-performance liquid chromatograph coupled with a photodiode array detector (UPLC-PDA) for analysis.
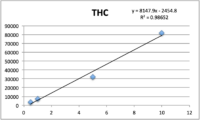
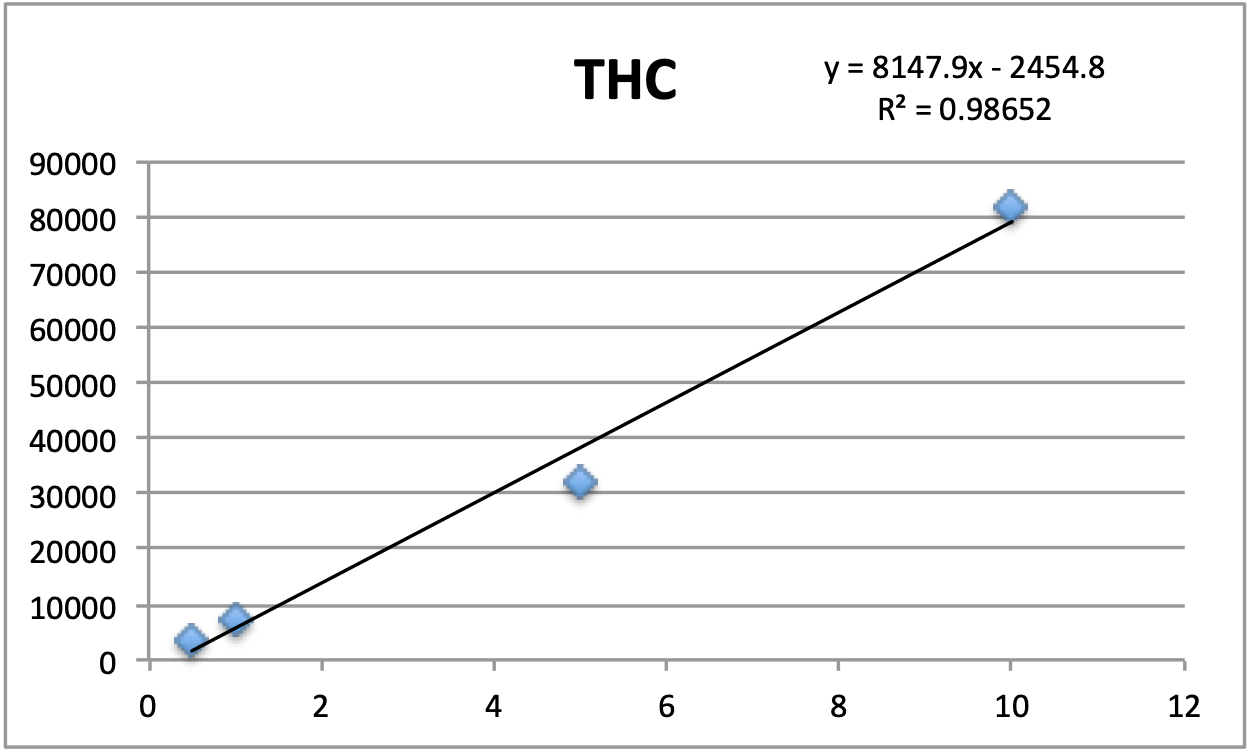
Figure 1: Calibration curve for THC potency

Calibration

Standards were obtained for the following cannabinoids at a concentration of 1 mg/mL: cannabidivarin (CBDV), tetrahydrocannabivarin (THCV), cannabidiol (CBD), cannabigerol (CBG), cannabidiolic acid (CBDA), cannabigerolic acid (CBGA), cannabinol (CBN), tetrahydrocannabinol (9-THC), cannabichromene (CBC), tetrahydrocannabinol acid (THCA). Equal volumes of each standard were mixed with MeOH to make a standard stock solution of 10 ug/mL. Serial dilutions were made from the stock to make concentrations of 5, 1, and 0.5 ug/mL for the calibration curve (Figure 1).

Instrumental Method

All instrument parameters were followed from Agilent Application Note 5991-9285EN.8 A UPLC with a PDA (Waters Corp, Milford, MA) detector was employed for potency analysis. An InfinityLab Poroshell 120 EC-C18, 3.0 x 50 mm, 2.7 um column (Agilent Technologies, Wilmington, DE) was utilized for compound separation. The organic mobile phase composition was 0.05 % (v/v) formic acid in HPLC grade MeOH and the aqueous mobile phase composition was 0.1 % (v/v) formic acid in HPLC grade water. The mobile phase gradient is shown in Table 1. The flow rate was 1 mL/min (9.5 minute total program), injection volume was 5 uL, and column temperature was 50 °C.

Table 1: LC mobile phase gradient for potency samples6

Discussion and Results

Table 2 summarizes the relative standard deviations (% RSD) were found for the THC calibrator (at 1 ug/mL) and one extract of a homogeneous sample (utilizing 7 replicates).

Table 2- %RSD values for the instrument response precision for THC in both the calibrations and the homogeneous extract.

The cannabinoid potency of various cannabis plant and cannabis product samples were determined for the various extraction techniques In the chromatograms THC was observed ~8.08 minutes and CBD was observed ~4.61 minutes (Figure 2).

Figure 2: Chromatogram of the 10ug/mL calibrator for potency/cannabinoid analysis

Total potency for THC & CBD were calculated for each sample using the equations below. Equation 1 was used because it accounts for the presence of THCA as well as the specific weight difference between THC and THCA (since THCA will eventually convert to THC, this needs to be accounted for in the calculations).

Table 3 shows the % THC and the total THC potency values calculated for the same flower samples that went through all four various potency sample preparation techniques as described earlier. Figure 3 also provides LC chromatograms for flower sample 03281913A-2 and edible sample 03281912-1.

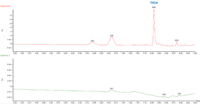
Table 3-THC and Total THC potency values for the same cannabis flower sample processed through the combination of extractions and cleanups.
Figure 3: Potency/Cannabinoid analysis chromatogram for flower sample 03281913A-2 (red trace) and edible sample 03281912-1 (green trace).

The results indicated that with the “Potency Extraction Method 2” (ACN/QuEChERS extraction) coupled with the RC filter provided a bias of 7.29 % greater for total THC % over the other extraction techniques. Since the other 3 techniques provided total THC values within 2% of each other, the total THC of the sample is more likely ~14%.

Since the sample dilution for the above data set reduced the CBD content, an undiluted sample was run and analyzed. This data is reported in Table 4.

Table 4- CBD and Total CBD potency values for the same cannabis flower sample processed through different sample preparation techniques.

The CBD results indicated that with the “Potency Extraction Method 1” (methanol extraction) coupled with RC filter, allowed for a greater CBD recovery. This may indicate the loss of CBD with an ACN/QuEChERS extraction.

With an average ~14% total THC and 0.06% total CBD for a homogenous cannabis flower sample, the optimal sample preparation extraction was determined to be a methanol extraction coupled with filtration using a regenerated cellulose filter. Since potency continues to remain at the forefront of cannabis regulatory testing it is important to utilize the right sample prep for your cannabis samples.


References

  1. Wang M, Wang YH, Avula B, Radwan MM, Wanas AS, Mehmedic Z, et al. Quantitative Determination of Cannabinoids in Cannabis and Cannabis Products Using Ultra-High-Performance Supercritical Fluid Chromatography and Diode Array/Mass Spectrometric Detection. Journal of Forensic Sciences 2016;62(3):602-11.
  2. Matthew Curtis, Eric Fausett, Wendi A. Hale, Ron Honnold, Jessica Westland, Peter J. Stone, Jeffery S. Hollis, Anthony Macherone. Cannabis Science and Technology, September/October 2019, Volume 2, Issue 5.
  3. Sian Ferguson. https://www.healthline.com/health/hemp-vs-marijuana. August 27, 2020.
  4. Taschwer M, Schmid MG. Determination of the relative percentage distribution of THCA and 9-THC in herbal cannabis seized in Austria- Impact of different storage temperatures on stability. Forensic Science International 2015; 254:167-71.
  5. Beadle A. CBDA Vs CBD: What are the differences? [Internet]. Analytical Cannabis. 2019 [cited 2020 Apr 22]; https://www.analyticalcannabis.com/articles/cbda-vs-cbd-what-are-the-differences-312019.
  6. Storm C, Zumwalt M, Macherone A. Dedicated Cannabinoid Potency Testing Using the Agilent 1220 Infinity II LC System. Agilent Technologies, Inc. Application Note 5991-9285EN
dSPE cleanups

The Grass Isn’t Always Greener: Removal of Purple Pigmentation from Cannabis

By Danielle Mackowsky
1 Comment
dSPE cleanups
strains
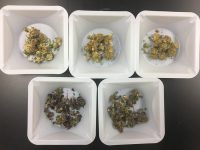
Cannabis strains used (clockwise from top left): Agent Orange, Tahoe OG, Blue Skunk, Grand Daddy and Grape Drink

Cannabis-testing laboratories have the challenge of removing a variety of unwanted matrix components from plant material prior to running extracts on their LC-MS/MS or GC-MS. The complexity of the cannabis plant presents additional analytical challenges that do not need to be accounted for in other agricultural products. Up to a third of the overall mass of cannabis seed, half of usable flower and nearly all extracts can be contributed to essential oils such as terpenes, flavonoids and actual cannabinoid content1. The biodiversity of this plant is exhibited in the over 2,000 unique strains that have been identified, each with their own pigmentation, cannabinoid profile and overall suggested medicinal use2. While novel methods have been developed for the removal of chlorophyll, few, if any, sample preparation methods have been devoted to removal of other colored pigments from cannabis.

QuEChERS
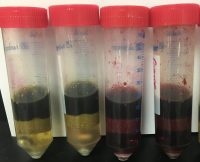
Cannabis samples following QuEChERS extraction

Sample Preparation

Cannabis samples from four strains of plant (Purple Drink, Tahoe OG, Grand Daddy and Agent Orange) were hydrated using deionized water. Following the addition of 10 mL acetonitrile, samples were homogenized using a SPEX Geno/Grinder and stainless steel grinding balls. QuEChERS (Quick, Easy, Cheap, Effective, Rugged and Safe) non-buffered extraction salts were then added and samples were shaken. Following centrifugation, an aliquot of the supernatant was transferred to various blends of dispersive SPE (dSPE) salts packed into centrifugation tubes. All dSPE tubes were vortexed prior to being centrifuged. Resulting supernatant was transferred to clear auto sampler vials for visual analysis. Recoveries of 48 pesticides and four mycotoxins were determined for the two dSPE blends that provided the most pigmentation removal.

Seven dSPE blends were evaluated for their ability to remove both chlorophyll and purple pigmentation from cannabis plant material:

  • 150 mg MgSO4, 50 mg PSA, 50 mg C18, 50 mg Chlorofiltr®
  • 150 mg MgSO4, 50 mg C18, 50 mg Chlorofiltr®
  • 150 mg MgSO4, 50 mg PSA
  • 150 mg MgSO4, 25 mg C18
  • 150 mg MgSO4, 50 mg PSA, 50 mg C18
  • 150 mg MgSO4, 25 mg PSA, 7.5 mg GCB
  • 150 mg MgSO4, 50 mg PSA, 50 mg C18, 50 mg GCB

Based on the coloration of the resulting extracts, blends A, F and G were determined to be the most effective in removing both chlorophyll (all cannabis strains) and purple pigments (Purple Drink and Grand Daddy). Previous research regarding the ability of large quantities of GCB to retain planar pesticides allowed for the exclusion of blend G from further analyte quantitation3. The recoveries of the 48 selected pesticides and four mycotoxins for blends A and F were determined.

dSPE cleanups
Grand Daddy following various dSPE cleanups

Summary

A blend of MgSO4, C18, PSA and Chlorofiltr® allowed for the most sample clean up, without loss of pesticides and mycotoxins, for all cannabis samples tested. Average recovery of the 47 pesticides and five mycotoxins using the selected dSPE blend was 75.6% were as the average recovery when including GCB instead of Chlorofiltr® was 67.6%. Regardless of the sample’s original pigmentation, this blend successfully removed both chlorophyll and purple hues from all strains tested. The other six dSPE blends evaluated were unable to provide the sample clean up needed or had previously demonstrated to be detrimental to the recovery of pesticides routinely analyzed in cannabis.


References

(1)           Recommended methods for the identification and analysis of cannabis and cannabis products, United Nations Office of Drugs and Crime (2009)

(2)            W. Ross, Newsweek, (2016)

(3)            Koesukwiwat, Urairat, et al. “High Throughput Analysis of 150 Pesticides in Fruits and Vegetables Using QuEChERS and Low-Pressure Gas Chromatography Time-of-Flight Mass Spectrometry.” Journal of Chromatography A, vol. 1217, no. 43, 2010, pp. 6692–6703., doi:10.1016/j.chroma.2010.05.012.

JCanna Boot Camp Educates Portland Attendees

By Aaron G. Biros
No Comments

On Monday, August 28th, attendees of the Cannabis Science Conference descended on Portland, Oregon for a week of educational talks, networking and studying the science of cannabis. On Monday, Chalice Farms, an extracts and infused products company, hosted the full-day JCanna Boot Camp focused on a deep dive behind the scenes of a cannabis production facility. The Cannabis Science Conference, hosted by Josh Crossney, founder of JCanna, takes place August 28th to 30th.

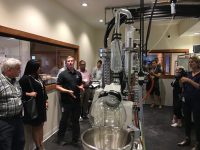
Attendees touring an extraction setup

Attendees were split into five groups where they listened to a variety of educational sessions and toured the facility. A track focused on cultivation, led by Autumn Karcey, president of Cultivo, Inc., detailed all things facility design for cannabis cultivation, including an in-depth look at sanitation and safety. For example, Karcey discussed HVAC cleanliness, floor-to-ceiling sanitation and the hazards associated with negative pressure. These principles, while applicable to most cultivating facilities, applies particularly to commercial-scale grows in a pharmaceutical setting.

Sandy Mangan and Tristan DeBona demonstrating the grinding technique for sample prep

During one session, Sandy Mangan, accounts manager at SPEX Sample Prep and Tristan DeBona, sales specialist at SPEX Sample Prep, demonstrated the basics of sample preparation for detecting pesticides in infused products, such as gummies. That required using their GenoGrinder and FreezerMill, which uses liquid nitrogen to make gummies brittle, then pulverizing them to a powder-like substance that is more conducive for a QuEChERS preparation.

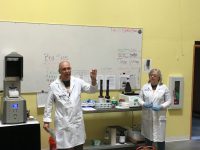
Joe Konschnik and Susan Steinike demonstrate the QuEChERS method

Joe Konschnik, business development manager at Restek, Susan Steinike, product-marketing manager at Restek and Justin Steimling, an analytical chemist at Restek, gave a demonstration of a full QuEChERS extraction of a cannabis sample for pesticide analysis, with attendees participating to learn the basics of sample preparation for these types of tests.

Following those were some other notable talks, including a tour of the extraction instruments and equipment at Chalice Farms, a look inside their commercial kitchen and a discussion of edibles and product formulation. Dr. Uma Dhanabalan, founder of Uplifting Health and Wellness, a physician with over 30 years of experience in research and patient care, led a discussion of physician participation, patient education and drug delivery mechanisms.

Amanda Rigdon, Emerald Scientific, showing some complex matrices in cannabis products

Amanda Rigdon, chief technical officer of Emerald Scientific, offered a demonstration of easy and adaptable sample preparation techniques for potency testing of infused product matrices. Rigdon showed attendees of the boot camp how wildly diverse cannabis products are and how challenging it can be for labs to test them.

The JCanna Canna Boot Camp is a good example of an educational event catered to the cannabis industry that offers real, hands-on experience and actionable advice. Before the two-day conference this week, the boot camp provided a bird’s eye view for attendees of the science of cannabis.

From The Lab

QuEChERS 101

By Danielle Mackowsky
No Comments

Sample preparation experts and analytical chemists are quick to suggest QuEChERS (Quick, Easy, Cheap, Effective, Rugged and Safe) to cannabis laboratories that are analyzing both flower and edible material for pesticides, mycotoxins and cannabinoid content. Besides having a quirky name, just what makes QuEChERS a good extraction technique for the complicated matrices of cannabis products? By understanding the chemistry behind the extraction and the methodology’s history, cannabis laboratories can better implement the technology and educate their workforce.

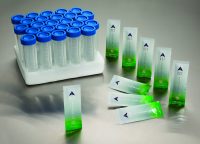
QuEChERS salt blends can be packed into mylar pouches for use with any type of centrifuge tubes

In 2003, a time when only eight states had legalized the use of medical cannabis, a group of four researchers published an article in the Journal of AOAC International that made quite the impact in the residue monitoring industry. Titled Fast and Easy Multiresidue Method Employing Acetonitrile Extraction/Partitioning and “Dispersive Solid-Phase Extraction” for the Determination of Pesticide Residues in Produce, Drs. Michael Anastassiades, Steven Lehotay, Darinka Štajnbaher and Frank Schenck demonstrate how hundreds of pesticides could be extracted from a variety of produce samples through the use of two sequential steps: an initial phase partitioning followed by an additional matrix clean up. In the paper’s conclusion, the term QuEChERS was officially coined. In the fourteen years that have followed, this article has been cited over 2800 times. Subsequent research publications have demonstrated its use in matrices beyond food products such as biological fluids, soil and dietary supplements for a plethora of analytes including phthalates, pharmaceutical compounds and most recently cannabis.

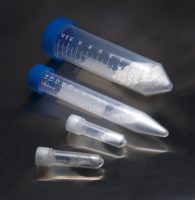
QuEChERS salts can come prepacked into centrifuge tubes

The original QuEChERS extraction method utilized a salt blend of 4 g of magnesium sulfate and 1 g of sodium chloride. A starting sample volume of 10 g and 10 mL of acetonitrile (ACN) were combined with the above-mentioned salt blend in a centrifuge tube. The second step, dispersive solid phase extraction (dSPE) cleanup, included 150 mg of magnesium sulfate and 25 mg of primary secondary amine (PSA). Subsequent extraction techniques, now known as AOAC and European QuEChERS, suggested the use of buffered salts in order to protect any base sensitive analytes that may be critical to one’s analysis. Though the pH of the extraction solvent may differ, all three methods agree that ACN should be used as the starting organic phase. ACN is capable of extracting the broadest range of analytes and is compatible with both LC-MS/MS and GC-MS systems. While ethyl acetate has also been suggested as a starting solvent, it is incompatible with LC-MS/MS and extracts a larger amount of undesirable matrix components in the final aliquot.

All laboratories, including cannabis and food safety settings, are constantly looking for ways to decrease their overhead costs, batch out the most samples possible per day, and keep their employees trained and safe. It is not a stretch to say that QuEChERS revolutionized the analytical industry and made the above goals tangible achievements. In the original publication, Anastassiades et al. established that recoveries of over 85% for pesticides residues were possible at a cost as low as $1 per ten grams of sample. Within forty minutes, up to twelve samples were fully extracted and ready to be analyzed by GC-MS, without the purchase of any specialized equipment. Most importantly, no halogenated solvents were necessary, making this an environmentally conscious concept. Due to the nature of the cannabis industry, laboratories in this field are able to decrease overall solvent usage by a greater amount than what was demonstrated in 2003. The recommended starting sample for cannabis laboratories is only one gram of flower, or a tenth of the starting volume that is commonly utilized in the food safety industry. This reduction in sample volume then leads to a reduction in acetonitrile usage and thus QuEChERS is a very green extraction methodology.

The complexity of the cannabis matrix can cause great extraction difficulties if proper techniques are not used

As with any analytical method, QuEChERS is not perfect or ideal for every laboratory setting. Challenges remain in the cannabis industry where the polarity of individual pesticides monitored in some states precludes them from being amenable to the QuEChERS approach. For cannabis laboratories looking to improve their pesticide recoveries, decrease their solvent usage and not invest their resources into additional bench top equipment, QuEChERS is an excellent technique to adopt. The commercialization of salt blends specific for cannabis flowers and edibles takes the guesswork out of which products to use. The growth of cannabis technical groups within established analytical organizations has allowed for better communication among scientists when it comes to best practices for this complicated matrix. Overall, it is definitely worth implementing the QuEChERS technique in one’s cannabis laboratory in order to streamline productivity without sacrificing your results.

UCT-Dspe

Pesticide & Potency Analysis of Street-Grade versus Medicinal Cannabis

By Danielle Mackowsky
2 Comments
UCT-Dspe

In states where cannabis is legalized, some analytical laboratories are tasked with identifying and quantifying pesticide content in plant material. This is a relatively new concept in the study of cannabis as most forensic laboratories that work with seized plant material are only concerned with positively identifying the sample as cannabis. Laboratories of this nature, often associated with police departments, the office of the chief medical examiner or the local department of public health are not required to identify the amount of THC and other cannabinoids in the plant. While data is abundant that compares the average THC content in today’s recreational cannabis to that commonly consumed in the 1960s and 1970s, limited scientific studies can be found that discuss the pesticide content in street-grade cannabis.

cannabis-siezed
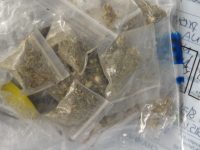
Street-grade cannabis that is ground into a fine powder

Using the QuEChERS approach, which is the industry gold-standard in food analysis for pesticides, a comparison study was carried out to analyze the pesticide and cannabinoid content in street-grade cannabis versus medicinal cannabis. For all samples, one gram of plant material was ground into a fine powder prior to hydration with methanol. The sample was then ready to be placed into an extraction tube, along with 10 mL of acetonitrile and one pouch of QuEChERS salts. After a quick vortex, all samples were then shaken for 1 minute using a SPEX Geno/Grinder prior to centrifugation.

Quenchers-analysis
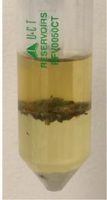
Formation of layers following QuEChERS extraction

For pesticide analysis, a one mL aliquot of the top organic layer was then subjected to additional dispersive solid phase extraction (dSPE) clean-up. The blend of dSPE salts was selected to optimize the removal of chlorophyll and other interfering compounds from the plant material without compromising the recovery of any planar pesticides. Shaken and centrifuged under the same conditions as described above, an aliquot of the organic layer was then transferred to an auto-sampler vial and diluted with deionized water. Cannabinoid analysis required serial dilutions between 200 to 2000 times, depending on the individual sample. Both pesticide and cannabinoid separation was carried out on a UCT Selectra® Aqueous C18 HPLC column and guard column coupled to a Thermo Scientific Dionex UltiMate 3000 LC System/ TSQ VantageTM tandem MS.

UCT-Dspe
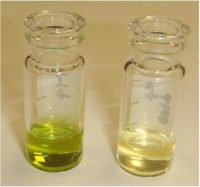
Supernatant before and after additional dispersive SPE clean-up using UCT’s Chlorofiltr

Pesticide Results

Due to inconsistent regulations among states that have legalized medicinal or recreational cannabis, a wide panel of commonly encountered pesticides was selected for this application. DEET, recognized by the EPA as not evoking health concerns to the general public when applied topically, was found on all medical cannabis samples tested. An average of 28 ng/g of DEET was found on medicinal samples analyzed. Limited research as to possible side effects, if any, of having this pesticide present within volatilized medical-grade product is available. Street-grade cannabis was found to have a variety of pesticides at concentrations higher than what was observed in the medical-grade product.

Potency Results

Tetrahydrocannabinolic acid A (THCA-A) is the non-psychoactive precursor to THC. Within fresh plant material, up to 90% of available THC is found in this form. Under intense heating such as when cannabis is smoked, THCA-A is progressively decarboxylated to the psychoactive THC form. Due to possible therapeutic qualities of this compound, medical cannabis samples specifically were tested for this analyte in addition to other cannabinoids. On average, 17% of the total weight in each medical cannabis sample came from the presence of THCA-A. In both medical and recreational samples, the percentage of THC contribution ranged from 0.9-1.7.

Summary

A fast and effective method was developed for the determination of pesticide residues and cannabis potency in recreational and medical cannabis samples. Pesticide residues and cannabinoids were extracted using the UCT QuEChERS approach, followed by either additional cleanup using a blend of dSPE sorbents for pesticide analysis, or serial dilutions for cannabinoid potency testing.