Tag Archives: sample

OHA Addresses Oregon Growing Pains, Changes Testing Rules

By Aaron G. Biros
No Comments

Last week, the Oregon Health Authority (OHA) published a bulletin, outlining new temporary testing requirements effective immediately until May 30th of next year. The changes to the rules come in the wake of product shortages, higher prices and even some claims of cultivators reverting back to the black market to stay afloat.img_6245

According to the bulletin, these temporary regulations are meant to still protect public health and safety, but are “aimed at lowering the testing burden for producers and processors based on concerns and input from the marijuana industry.” The temporary rules, applying to both medical and retail products, are a Band-Aid fix while the OHA works on a permanent solution to the testing backlog.

Here are some key takeaways from the rule changes:

Labeling

  • THC and CBD amounts on the label must be the value calculated by a laboratory, plus or minus 5%.

Batch testing

  • A harvest lot can include more than one strain.
  • Cannabis harvested within a 48-hour period, using the same growing and curing processes can be included in one harvest lot.
  • Edibles processors can include up to 1000 units of product in a batch for testing.
  • The size of a process lot submitted for testing for concentrates, extracts or other non-edible products will be the maximum size for future sampling and testing.

    Oregon Marijuana Universal Symbol for Printing
    Oregon Marijuana Universal Symbol for Printing

Sampling

  • Different batches of the same strain can be combined for testing potency.
  • Samples can be combined from a number of batches in a harvest lot for pesticide testing if the weight of all the batches doesn’t exceed ten pounds. This also means that if that combined sample fails a pesticide test, all of the batches fail the test and need to be disposed.

Solvent testing

  • Butanol, Propanol and Ethanol are no longer on the solvent list.
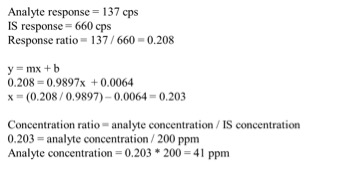
Potency testing

  • The maximum concentration limit for THC and CBD testing can have up to a 5% variance.

Control Study

  • Process validation is replaced by one control study.
  • After OHA has certified a control study, it is valid for a year unless there is an SOP or ingredient change.
  • During the control study, sample increments are tested separately for homogeneity across batches, but when the control study is certified, sample increments can be combined.

Failing a test

  • Test reports must clearly show if a test fails or passes.
  • Producers can request a reanalysis after a failed test no later than a week after receiving failed test results and that reanalysis must happen within 30 days.
Gov. Kate Brown Photo: Oregon Dept. of Transportation
Gov. Kate Brown
Photo: Oregon Dept. of Transportation

The office of Gov. Kate Brown along with the OHA, Oregon Department of Agriculture (ODA) and Oregon Liquor Control Commission (OLCC) issued a letter in late November, serving as a reminder of the regulations regarding pesticide use and testing. It says in bold that it is illegal to use any pesticide not on the ODA’s cannabis and pesticide guide list. The letter states that failed pesticide tests are referred to ODA for investigation, which means producers that fail those tests could face punitive measures such as fines.

Photo: Michelle Tribe, Flickr

The letter also clarifies a major part of the pesticide rules involving the action level, or the measured amount of pesticides in a product that the OHA deems potentially dangerous. “Despite cannabis producers receiving test results below OHA pesticide action levels for cannabis (set in OHA rule), producers may still be in violation of the Oregon Pesticide Control Act if any levels of illegal pesticides are detected.” This is crucial information for producers who might have phased out use of pesticides in the past or might have began operations in a facility where pesticides were used previously. A laboratory detecting even a trace amount in the parts-per-billion range of banned pesticides, like Myclobutanil, would mean the producer is in violation of the Pesticide Control Act and could face thousands of dollars in fines. The approved pesticides on the list are generally intended for food products, exempt from a tolerance and are considered low risk.

As regulators work to accredit more laboratories and flesh out issues with the industry, Oregon’s cannabis market enters a period of marked uncertainty.

teganheadshot
Quality From Canada

Near Infrared, GC and HPLC Applications in Cannabis Testing

By Tegan Adams, Michael Bertone
5 Comments
teganheadshot

When a cannabis sample is submitted to a lab for testing there is a four-step process that occurs before it is tested in the instrumentation on site:

  1. It is ground at a low temperature into a fine powder;
  2. A solution is added to the ground powder;
  3. An extraction is repeated 6 times to ensure all cannabinoids are transferred into a common solution to be used in testing instrumentation.
  4. Once the cannabinoid solution is extracted from the plant matter, it is analyzed using High Pressure Liquid Chromatograph (HPLC). HPLC is the key piece of instrumentation in cannabis potency testing procedures.

While there are many ways to test cannabis potency, HPLC is the most widely accepted and recognized testing instrumentation. Other instrument techniques include gas chromatography (GC) and thin layer chromatography (TLC). HPLC is preferred over GC because it does not apply heat in the testing process and cannabinoids can then be measured in their naturally occurring forms. Using a GC, heat is applied as part of the testing process and cannabinoids such as THCA or CBDA can change form, depending on the level of heat applied. CBDA and THCA have been observed to change form at as low as 40-50C. GC uses anywhere between 150-200C for its processes, and if using a GC, a change of compound form can occur. Using HPLC free of any high-heat environments, acidic (CBDA & THCA) and neutral cannabinoids (CBD, THC, CBG, CBN and others) can be differentiated in a sample for quantification purposes.

Near Infrared

Near infrared (NIR) has been used with cannabis for rapid identification of active pharmaceutical ingredients by measuring how much light different substances reflect. Cannabis is typically composed of 5-30% cannabinoids (mainly THC and CBD) and 5-15% water. Cannabinoid content can vary by over 5% (e.g. 13-18%) on a single plant, and even more if grown indoors. Multiple NIR measurements can be cost effective for R&D purposes. NIR does not use solvents and has a speed advantage of at least 50 times over traditional methods.

The main downfall of NIR techniques is that they are generally less accurate than HPLC or GC for potency analyses. NIR can be programmed to detect different compounds. To obtain accuracy in its detection methods, samples must be tested by HPLC on ongoing basis. 100 samples or more will provide enough information to improve an NIR software’s accuracy if it is programmed by the manufacturer or user using chemometrics. Chemometrics sorts through the often complex and broad overlapping NIR absorption.

Bands from the chemical, physical, and structural properties of all species present in a sample that influences the measured spectra. Any variation however of a strain tested or water quantity observed can affect the received results. Consistency is the key to obtaining precision with NIR equipment programming. The downfall of the NIR technique is that it must constantly be compared to HPLC data to ensure accuracy.

At Eurofins Experchem , our company works with bothHPLC and NIR equipment simultaneously for different cannabis testing purposes. Running both equipment simultaneously means we are able to continually monitor the accuracy of our NIR equipment as compared to our HPLC. If a company is using NIR alone however, it can be more difficult to maintain the equipment’s accuracy without on-going monitoring.

What about Terpenes?

Terpenes are the primary aromatic constituents of cannabis resin and essential oils. Terpene compounds vary in type and concentration among different genetic lineages of cannabis and have been shown to modulate and modify the therapeutic and psychoactive effects of cannabinoids. Terpenes can be analyzed using different methods including separation by GC or HPLC and identification by Mass Spectrometry. The high-heat environment for GC analysis can again cause problems in accuracy and interpretation of results for terpenes; high-heat environments can degrade terpenes and make them difficult to find in accurate form. We find HPLC is the best instrument to test for terpenes and can now test for six of the key terpene profiles including a-Pinene, Caryophyllene, Limonene, Myrcene, B-Pinene and Terpineol.

Quality Systems

Quality systems between different labs are never one and the same. Some labs are testing cannabis under good manufacturing practices (GMP), others follow ISO accreditation and some labs have no accreditation at all.

From a quality systems’ perspective some labs have zero or only one quality system employee(s). In a GMP lab, to meet the requirements of Health Canada and the FDA, our operations are staffed in a 1:4 quality assurance to analyst ratio. GMP labs have stringent quality standards that set them apart from other labs testing cannabis. Quality standards we work with include, but are not limited to: monthly internal blind audits, extensive GMP training, yearly exams and ongoing tests demonstrating competencies.

Maintaining and adhering to strict quality standards necessary for a Drug Establishment License for pharmaceutical testing ensures accuracy of results in cannabis testing otherwise difficult to find in the testing marketplace.

Important things to know about testing

  1. HPLC is the most recommended instrument used for product release in a regulated environment.
  2. NIR is the best instrument to use for monitoring growth and curing processes for R&D purposes, only if validated with an HPLC on an ongoing basis.
  3. Quality Systems between labs are different. Regardless of instrumentation used, if quality systems are not in place and maintained, integrity of results may be compromised.
  4. GMPs comprise 25% of our labour costs to our quality department. Quality systems necessary for a GMP environment include internal audits, out of specification investigations, qualification and maintenance of instruments, systems controls and stringent data integrity standards.
amandarigdon
The Practical Chemist

Internal Standards– Turning Good Data Into Great Data

By Amanda Rigdon
2 Comments
amandarigdon

Everyone likes to have a safety net, and scientists are no different. This month I will be discussing internal standards and how we can use them not only to improve the quality of our data, but also give us some ‘wiggle room’ when it comes to variation in sample preparation. Internal standards are widely used in every type of chromatographic analysis, so it is not surprising that their use also applies to common cannabis analyses. In my last article, I wrapped up our discussion of calibration and why it is absolutely necessary for generating valid data. If our calibration is not valid, then the label information that the cannabis consumer sees will not be valid either. These consumers are making decisions based on that data, and for the medical cannabis patient, valid data is absolutely critical. Internal standards work with calibration curves to further improve data quality, and luckily it is very easy to use them.

So what are internal standards? In a nutshell, they are non-analyte compounds used to compensate for method variations. An internal standard can be added either at the very beginning of our process to compensate for variations in sample prep and instrument variation, or at the very end to compensate only for instrument variation. Internal standards are also called ‘surrogates’, in some cases, however, for the purposes of this article, I will simply use the term ‘internal standard.’

Now that we know what internal standards are, lets look at how to use them. We use an internal standard by adding it to all samples, blanks, and calibrators at the same known concentration. By doing this, we now have a single reference concentration for all response values produced by our instrument. We can use this reference concentration to normalize variations in sample preparation and instrument response. This becomes very important for cannabis pesticide analyses that involve lots of sample prep and MS detectors. Figure 1 shows a calibration curve plotted as we saw in the last article (blue diamonds), as well as the response for an internal standard added to each calibrator at a level of 200ppm (green circles). Additionally, we have three sample results (red triangles) plotted against the calibration curve with their own internal standard responses (green Xs).

Figure 1: Calibration Curve with Internal Standard Responses and Three Sample Results

In this case, our calibration curve is beautiful and passes all of the criteria we discussed in the previous article. Lets assume that the results we calculate for our samples are valid – 41ppm, 303ppm, and 14ppm. Additionally, we can see that the responses for our internal standards make a flat line across the calibration range because they are present at the same concentration in each sample and calibrator. This illustrates what to expect when all of our calibrators and samples were prepared correctly and the instrument performed as expected. But lets assume we’re having one of those days where everything goes wrong, such as:

  • We unknowingly added only half the volume required for cleanup for one of the samples
  • The autosampler on the instrument was having problems and injected the incorrect amount for the other two samples

Figure 2 shows what our data would look like on our bad day.

Figure 2: Calibration Curve with Internal Standard Responses and Three Sample Results after Method Errors

We experienced no problems with our calibration curve (which is common when using solvent standard curves), therefore based on what we’ve learned so far, we would simply move on and calculate our sample results. The sample results this time are quite different: 26ppm, 120ppm, and 19ppm. What if these results are for a pesticide with a regulatory cutoff of 200ppm? When measured accurately, the concentration of sample 2 is 303ppm. In this example, we may have unknowingly passed a contaminated product on to consumers.

In the first two examples, we haven’t been using our internal standard – we’ve only been plotting its response. In order to use the internal standard, we need to change our calibration method. Instead of plotting the response of our analyte of interest versus its concentration, we plot our response ratio (analyte response/internal standard response) versus our concentration ratio (analyte concentration/internal standard concentration). Table 1 shows the analyte and internal standard response values for our calibrators and samples from Figure 2.


Table 1: Values for Calibration Curve and Samples Using Internal Standard

The values highlighted in green are what we will use to build our calibration curve, and the values in blue are what we will use to calculate our sample concentration. Figure 3 shows what the resulting calibration curve and sample points will look like using an internal standard.

Figure 3: Calibration Curve and Sample Results Calculated Using Internal Standard Correction

We can see that our axes have changed for our calibration curve, so the results that we calculate from the curve will be in terms of concentration ratio. We calculate these results the same way we did in the previous article, but instead of concentrations, we end up with concentration ratios. To calculate the sample concentration, simply multiply by the internal standard amount (200ppm). Figure 4 shows an example calculation for our lowest concentration sample.

Figure 4: Example Calculation for Sample Results for Internal-Standard Corrected Curve

Using the calculation shown in Figure 4, our sample results come out to be 41ppm, 302ppm, and 14ppm, which are accurate based on the example in Figure 1. Our internal standards have corrected the variation in our method because they are subjected to that same variation.

As always, there’s a lot more I can talk about on this topic, but I hope this was a good introduction to the use of internal standards. I’ve listed couple of resources below with some good information on the use of internal standards. If you have any questions on this topic, please feel free to contact me at amanda.rigdon@restek.com.


Resources:

When to use an internal standard: http://www.chromatographyonline.com/when-should-internal-standard-be-used-0

Choosing an internal standard: http://blog.restek.com/?p=17050

UCT-Dspe

Pesticide & Potency Analysis of Street-Grade versus Medicinal Cannabis

By Danielle Mackowsky
2 Comments
UCT-Dspe

In states where cannabis is legalized, some analytical laboratories are tasked with identifying and quantifying pesticide content in plant material. This is a relatively new concept in the study of cannabis as most forensic laboratories that work with seized plant material are only concerned with positively identifying the sample as cannabis. Laboratories of this nature, often associated with police departments, the office of the chief medical examiner or the local department of public health are not required to identify the amount of THC and other cannabinoids in the plant. While data is abundant that compares the average THC content in today’s recreational cannabis to that commonly consumed in the 1960s and 1970s, limited scientific studies can be found that discuss the pesticide content in street-grade cannabis.

cannabis-siezed
Street-grade cannabis that is ground into a fine powder

Using the QuEChERS approach, which is the industry gold-standard in food analysis for pesticides, a comparison study was carried out to analyze the pesticide and cannabinoid content in street-grade cannabis versus medicinal cannabis. For all samples, one gram of plant material was ground into a fine powder prior to hydration with methanol. The sample was then ready to be placed into an extraction tube, along with 10 mL of acetonitrile and one pouch of QuEChERS salts. After a quick vortex, all samples were then shaken for 1 minute using a SPEX Geno/Grinder prior to centrifugation.

Quenchers-analysis
Formation of layers following QuEChERS extraction

For pesticide analysis, a one mL aliquot of the top organic layer was then subjected to additional dispersive solid phase extraction (dSPE) clean-up. The blend of dSPE salts was selected to optimize the removal of chlorophyll and other interfering compounds from the plant material without compromising the recovery of any planar pesticides. Shaken and centrifuged under the same conditions as described above, an aliquot of the organic layer was then transferred to an auto-sampler vial and diluted with deionized water. Cannabinoid analysis required serial dilutions between 200 to 2000 times, depending on the individual sample. Both pesticide and cannabinoid separation was carried out on a UCT Selectra® Aqueous C18 HPLC column and guard column coupled to a Thermo Scientific Dionex UltiMate 3000 LC System/ TSQ VantageTM tandem MS.

UCT-Dspe
Supernatant before and after additional dispersive SPE clean-up using UCT’s Chlorofiltr

Pesticide Results

Due to inconsistent regulations among states that have legalized medicinal or recreational cannabis, a wide panel of commonly encountered pesticides was selected for this application. DEET, recognized by the EPA as not evoking health concerns to the general public when applied topically, was found on all medical cannabis samples tested. An average of 28 ng/g of DEET was found on medicinal samples analyzed. Limited research as to possible side effects, if any, of having this pesticide present within volatilized medical-grade product is available. Street-grade cannabis was found to have a variety of pesticides at concentrations higher than what was observed in the medical-grade product.

Potency Results

Tetrahydrocannabinolic acid A (THCA-A) is the non-psychoactive precursor to THC. Within fresh plant material, up to 90% of available THC is found in this form. Under intense heating such as when cannabis is smoked, THCA-A is progressively decarboxylated to the psychoactive THC form. Due to possible therapeutic qualities of this compound, medical cannabis samples specifically were tested for this analyte in addition to other cannabinoids. On average, 17% of the total weight in each medical cannabis sample came from the presence of THCA-A. In both medical and recreational samples, the percentage of THC contribution ranged from 0.9-1.7.

Summary

A fast and effective method was developed for the determination of pesticide residues and cannabis potency in recreational and medical cannabis samples. Pesticide residues and cannabinoids were extracted using the UCT QuEChERS approach, followed by either additional cleanup using a blend of dSPE sorbents for pesticide analysis, or serial dilutions for cannabinoid potency testing.

teganheadshot
Quality From Canada

Secure Software Monitoring — Two Keys to Success

By Tegan Adams
No Comments
teganheadshot

We have two key software platforms at our laboratory that help us stay compliant with our standard operating procedures. Saif Al-Dujaili, quality manager at Eurofins-Experchem, oversees quality assurance in our laboratory. As we like to say, you are safe with Saif.

A Customized Sample Tracking System

Sample-tracking software consists of four main modules:

Tracking samples in our facility: When a sample is booked by our tracking system, a unique identification number is generated by the system and printed on a sticker, which is placed on the sample. When a sample is booked, department heads then have the ability to assign work orders to the analysts through the tracking system.

When testing is complete, results are entered by the analyst into the tracking system and reviewed by the quality assurance (QA) department. QA reviewers are responsible for approving results entered in the system before they are sent to the client. A certificate of analysis is then generated and e-mailed to the client for their review.

Controlling stability studies conducted in our facility: Stability studies are scheduled and controlled on different samples pulled for analysis. Within our facility’s sample-tracking system we have different chamber names with different conditions where products can be placed. Which chamber we place samples in depends on protocols and requests from our client. The software used also generates a unique study number for each stability study that occurs. The stability schedule that includes each study is reviewed every week by the stability coordinator to schedule what samples need to be pulled for testing.

Controlling methods used for tests: Methods are entered into the tracking system after department heads have reviewed them and it is approved by QA. The tracking system generates a unique ID number for each method as well as each sample. The method can now be tracked in our laboratory’s system. Within the software you can enter the name of the method, client name and effective date and any revisions applied to the method.

Controlling inventory of columns and electrodes: Sample tracking also helps us with our purchasing patterns to make sure we have supplies for our client’s testing needs. Every time that columns and electrodes are received, they are entered into our tracking system for inventory purposes.

REES Environmental Monitoring Software

REES is used to monitor the environmental conditions of our testing facility. Key inputs measured include temperature, humidity, differential pressure and elimination or intensity of light. REES is linked to the QA department’s computers. An audible alarm is sounded as well as e-mails sent to QA personnel to notify them if anything is out of specification. REES also phones related personnel’s cell phones to notify them of any alarms. No alarms are missed, even if they occur after working hours. Having a 24-hour environmental monitoring system in place helps Eurofins-Experchem ensure integrity in operations of stability, microbiological and other environmental conditions essential for accuracy in testing results.