Tag Archives: gas chromatography

Analytical Instruments You Need to Start a Cannabis Testing Laboratory

By Bob Clifford
8 Comments

The cannabis industry is growing exponentially, and the use of cannabis for medical purposes is being adopted across the nation. With this boom in cannabis consumers, there has been an increasing need for knowledge about the product.

The role of testing labs has become crucial to the process, which makes owning and operating a lab more lucrative. Scientists testing for potency, heavy metals, pesticides, residual solvents, moisture, terpene profile, microbial and fungal growth, and mycotoxins/aflatoxins are able to make meaningful contributions to the medical industry by making sure products are safe, while simultaneously generating profits and a return on investment.

Here are the key testing instruments you need to conduct these critical analyses. Note that cannabis analytical testing requirements may vary by state, so be sure to check the regulations applicable to the location of your laboratory.

Potency Testing

High-performance liquid chromatograph (HPLC) designed for quantitative determination of cannabinoid content.

The most important component of cannabis testing is the analysis of cannabinoid profiles, also known as potency. Cannabis plants naturally produce cannabinoids that determine the overall effect and strength of the cultivar, which is also referred to as the strain. There are many different cannabinoids that all have distinct medicinal effects. However, most states only require testing and reporting for the dry weight percentages of delta-9-tetrahydrocannabinol (Δ9-THC) and cannabidiol (CBD). It should be noted that delta-9-tetrahydrocannabinolic acid (Δ9-THCA) can be converted to THC through oxidation with heat or light.

For potency testing, traditional high-performance liquid chromatography (HPLC) is recommended and has become the gold standard for analyzing cannabinoid profiles. Look for a turnkey HPLC analyzer that delivers a comprehensive package that integrates instrument hardware, software, consumables and proven HPLC methods.

Heavy Metal Testing

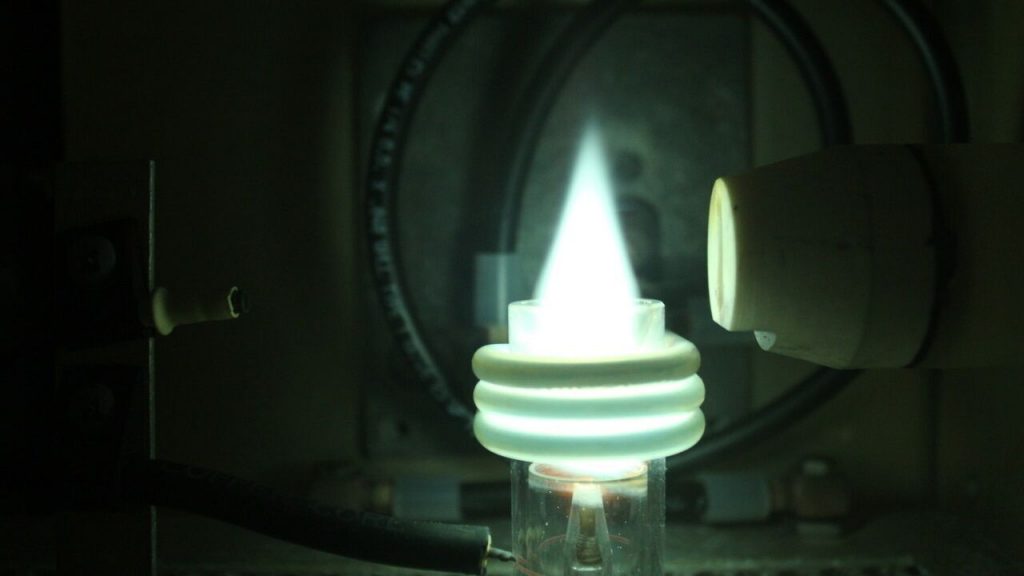
ICP-MS instrument for detecting heavy metals in cannabis.

Different types of metals can be found in soils and fertilizers, and as cannabis plants grow, they tend to draw in these metals from the soil. Heavy metals are a group of metals considered to be toxic, and the most common include lead, cadmium, arsenic and mercury. Most labs are required to test and confirm that samples are under the allowable toxic concentration limits for these four hazardous metals.

Heavy metal testing is performed by inductively coupled plasma mass spectrometry (ICP-MS). ICP-MS uses the different masses of each element to determine which elements are present within a sample and at what concentrations. Make sure to include accompanying software that provides assistant functions to simplify analysis by developing analytical methods and automatically diagnosing spectral interference. This will provide easy operation and analytical results with exceptionally high reliability.

To reduce running costs, look for a supporting hardware system that reduces the consumption of argon gas and electricity. For example, use a plasma ignition sequence that is optimized for lower-purity argon gas (i.e., 99.9% argon as opposed to more expensive 99.9999%).

Pesticide Testing

The detection of pesticides in cannabis can be a challenge. There are many pesticides that are used in commercial cannabis grow operations to kill the pests that thrive on the plants and in greenhouses. These chemicals are toxic to humans, so confirming their absence from cannabis products is crucial. The number of pesticides that must be tested for varies from state to state, with Colorado requiring only 13 pesticides, whereas Oregon and California require 59 and 66 respectively. Canada has taken it a step further and must test for 96 pesticides, while AOAC International is developing methods for testing for 104 pesticides. The list of pesticides will continue to evolve as the industry evolves.

Testing for pesticides is one of the more problematic analyses, possibly resulting in the need for two different instruments depending on the state’s requirements. For a majority of pesticides, liquid chromatography mass spectrometry (LCMS) is acceptable and operates much like HPLC but utilizes a different detector and sample preparation.

With excellent sensitivity and ultra-low detection limits, LC-MS/MS is an ideal technique for the analysis of pesticides.

Pesticides that do not ionize well in an LCMS source require the use of a gas chromatography mass spectrometry (GCMS) instrument. The principles of HPLC still apply – you inject a sample, separate it on a column and detect with a detector. However, in this case, a gas (typically helium) is used to carry the sample.

Look for a LC-MS/MS system or HPLC system with a triple quadrupole mass spectrometer that provides ultra-low detection limits, high sensitivity and efficient throughput. Advanced systems can analyze more than 200 pesticides in 12 minutes.

For GCMS analysis, consider an instrument that utilizes a triple quadrupole mass spectrometer to help maximize the capabilities of your laboratory. Select an instrument that is designed with enhanced functionality, analysis software, databases and a sample introduction system. Also include a headspace autosampler, which can also be used for terpene profiles and residual solvent testing.

Residual Solvent Testing

Residual solvents are chemicals left over from the process of extracting cannabinoids and terpenes from the cannabis plant. Common solvents for such extractions include ethanol, butane, propane and hexane. These solvents are evaporated to prepare high-concentration oils and waxes. However, it is sometimes necessary to use large quantities of solvent in order to increase extraction efficiency and to achieve higher levels of purity. Since these solvents are not safe for human consumption, most states require labs to verify that all traces of the substances have been removed.

Testing for residual solvents requires gas chromatography (GC). For this process, a small amount of extract is put into a vial and heated to mimic the natural evaporation process. The amount of solvent that is evaporated from the sample and into the air is referred to as the “headspace.” The headspace is then extracted with a syringe and placed in the injection port of the GC. This technique is called full-evaporated technique (FET) and utilizes the headspace autosampler for the GC.

Look for a GCMS instrument with a headspace autosampler, which can also be used for pesticide and terpene analysis.

Terpene Profile Testing

Terpenes are produced in the trichomes of the cannabis leaves, where THC is created, and are common constituents of the plant’s distinctive flavor and aroma. Terpenes also act as essential medicinal hydrocarbon building blocks, influencing the overall homeopathic and therapeutic effect of the product. The characterization of terpenes and their synergistic effect with cannabinoids are key for identifying the correct cannabis treatment plan for patients with pain, anxiety, epilepsy, depression, cancer and other illnesses. This test is not required by most states, but it is recommended.

The instrumentation that is used for analyzing terpene profiles is a GCMS with headspace autosampler with an appropriate spectral library. Since residual solvent testing is an analysis required by most states, all of the instrumentation required for terpene profiling will already be in your lab.

As with residual solvent testing, look for a GCMS instrument with a headspace autosampler (see above). 

Microbe, Fungus and Mycotoxin Testing

Most states mandate that cannabis testing labs analyze samples for any fungal or microbial growth resulting from production or handling, as well as for mycotoxins, which are toxins produced by fungi. With the potential to become lethal, continuous exposure to mycotoxins can lead to a buildup of progressively worse allergic reactions.

LCMS should be used to qualify and identify strains of mycotoxins. However, determining the amount of microorganisms present is another challenge. That testing can be done using enzyme linked immunosorbent assay (ELISA), quantitative polymerase chain reaction (qPCR) or matrix-assisted laser desorption/ionization time-of-flight mass spectrometry (MALDI-TOF MS), with each having their advantages and disadvantages.

For mycotoxin analysis, select a high-sensitivity LC-MS/MS instrument. In addition to standard LC, using an MS/MS selective detector enables labs to obtain limits of detection up to 1000 times greater than conventional LC-UV instruments.

For qPCR and its associated needs, look for a real-time PCR amplification system that combines thermal cyclers with optical reaction modules for singleplex and multiplex detection of fluorophores. These real-time PCR detection systems range from economical two-target detection to sophisticated five-target or more detection systems. The real-time detection platform should offer reliable gradient-enabled thermal cyclers for rapid assay optimization. Accompanying software built to work with the system simplifies plate setup, data collection, data analysis and data visualization of real-time PCR results.

Moisture Content and Water Activity Testing

Moisture content testing is required in some states. Moisture can be extremely detrimental to the quality of stored cannabis products. Dried cannabis typically has a moisture content of 5% to 12%. A moisture content above 12% in dried cannabis is prone to fungal growth (mold). As medical users may be immune deficient and vulnerable to the effects of mold, constant monitoring of moisture is needed. Below a 5% moisture content, the cannabis will turn to a dust-like texture.

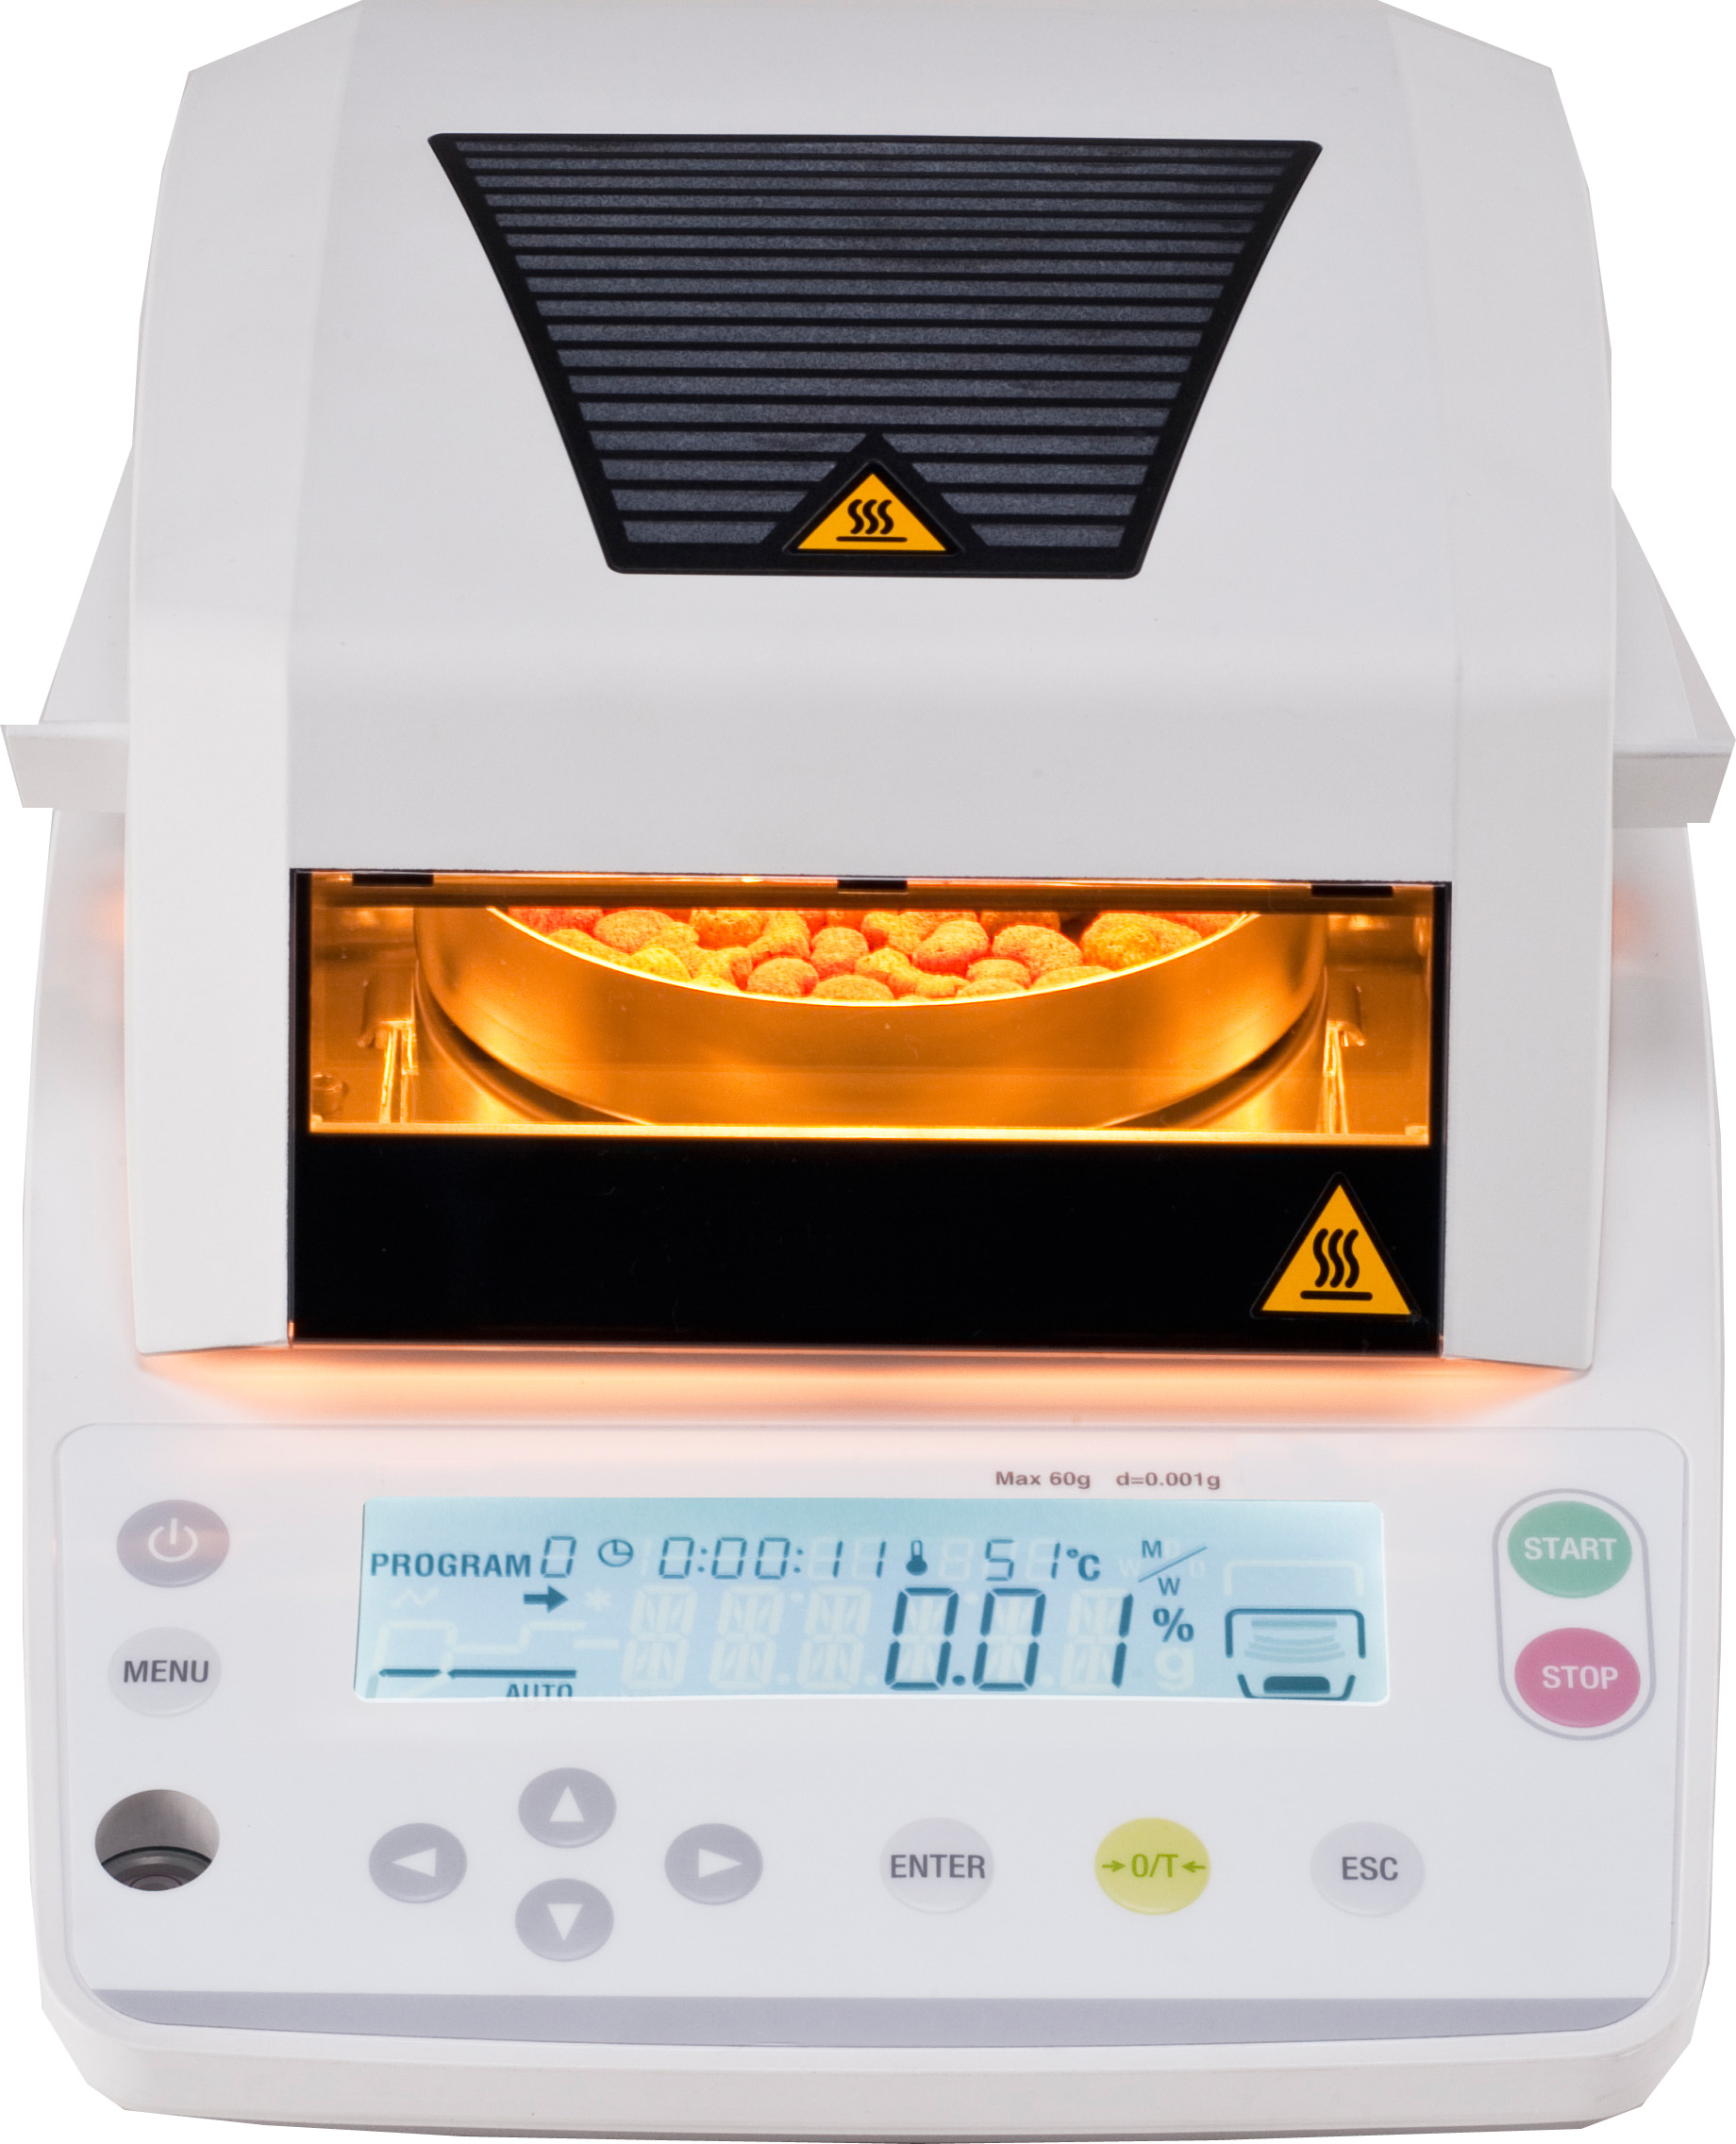
The best way to analyze the moisture content of any product is using the thermogravimetric method with a moisture balance instrument. This process involves placing the sample of cannabis into the sample chamber and taking an initial reading. Then the moisture balance instrument heats up until all the moisture has been evaporated out of the sample. A final reading is then taken to determine the percent weight of moisture that was contained in the original sample.

A moisture balance can provide accurate determination of moisture content in cannabis.

Look for a moisture balance that offers intuitive operation and quick, accurate determination of moisture content. The pan should be spacious enough to allow large samples to be spread thinly. The halogen heater and reflector plate should combine to enable precise, uniform heating. Advanced features can include preset, modifiable measurement modes like automated ending, timed ending, rapid drying, slow drying and step drying.

Another method for preventing mold is monitoring water activity (aW). Very simply, moisture content is the total amount of water available, while water activity is the “free water” that could produce mold. Water activityranges from 0 to 1. Pure water would have an aW of 1.0. ASTM methods D8196-18 and D8297-18 are methods for monitoring water activity in dry cannabis flower. The aW range recommended for storage is 0.55 to 0.65. Some states recommend moisture content to be monitored, other states monitor water activity, and some states such as California recommend monitoring both.

Final Thoughts

As you can see, cannabis growers benefit tremendously from cannabis testing. Whether meeting state requirements or certifying a product, laboratory testing reduces growers’ risk and ensures delivery of a quality product. As medicinal and recreational cannabis markets continue to grow, analytical testing will ensure that consumers are receiving accurately

labeled products that are free from contamination. That’s why it is important to invest in the future of your cannabis testing lab by selecting the right analytical equipment at the start of your venture.

The Need for Standardization in Medical Cannabis Testing

By Andrew James
2 Comments

There has been a move towards the legalization of cannabis for medical and/or recreational use across many countries and US states in recent years, leading to greater demand for accurate potency and safety testing. Despite this, there are currently no standardized regulations between states or countries for quality control including content, composition, adulterants, potency or levels of toxic residues. As such, in many cases where regulations are in place, testing is generally carried out at a small number of approved independent testing laboratories.

The need for self-regulation has led to the growth of portable gas chromatography (GC) being used in the field of cannabis testing.This lack of clarity makes it difficult for consumers to make informed decisions about what they are purchasing, an issue which could be damaging to the industry’s changing reputation. As it stands, producers of cannabis and cannabis-derived products can supply goods with potentially harmful contaminants such as fungi or pesticide residues, which are potentially threatening to human health. Most cannabis products sold legally in the US are required to be tested and labelled for THC, the chemical responsible for most of cannabis’s psychoactive effects. A US study found that as few as 20% of recreational cannabis products are accurately labelled with only 17% of products reviewed accurately labelled for THC content (i.e. within 10% of the labeled value). It also found 23% were under labelled, and 60% were over labelled.

If cannabis were to be categorized as a regulated pharmaceutical drug, it would be rigorously tested to comply with stringent rules and regulations regarding quality and safety of the product, as are all other drugs. However, as there is currently no centralized regulatory body that oversees this, the responsibility of quality assurance falls to the grower, manufacturer and sometimes the consumer.

The Need for Cannabis Analysis

The most common requirement when testing cannabis is positive identification and quantification of the total THC:CBD ratio. In a highly competitive marketplace, this information is important, as cannabis consumers tend to equate THC levels with price. In many instances, lower THC products are cheaper and higher THC concentrations make products more expensive. Without robust systems in place for sufficient testing, this information cannot be accurately determined, meaning the customer often cannot make an informed decision.

Pesticide use is surprisingly common in the cannabis cultivation industry

In addition to potency testing, one of the core issues facing the industry and by extension, the end consumer, is the prevalence of pesticides in cannabis products. In the Netherlands, the Ministry of Environment and Health reported that over 90% of cannabis plants tested had pesticides on them. While steps have been taken to tackle this, the lack of cohesion in testing standards combined with the onus on individual labs to carry out testing, has led to some issues within the industry.

Many individual retailers in the U.S. and internationally are self-testing for impurities such as pesticides, heavy metals and microbials. While there is a clear need for standard testing across all locations, the need for self-regulation at present has led to the growth of portable gas chromatography (GC) being used in the field of cannabis testing.

Using GC as an analytical tool 

With the increased need for quality control and quality assurance in the largely unregulated cannabis industry, technology is now more accessible to smaller companies and to people with minimal laboratory experience. There are a range of cannabis testing packages available for smaller individual labs which offer more mobile testing with affordable packages. The lower entry price makes GC analysis affordable for more laboratories while still delivering reliable, high quality results.

Portable GC instruments can offer high quality potency testing, pesticide screening, terpene and flavor profiling, and residual solvents analysis. These instruments can give growers and processors an accurate result of cannabinoid percentages, a fundamental piece of information for growers and dispensaries. Systems can be configured for manual injection or a range of autosampler options can be added.

The structure of cannabidiol (CBD), one of 400 active compounds found in cannabis.

GC enables the rapid and accurate identification and quantification of the THC:CBD ratio. This is important for companies which are carrying out self-testing as it allows their customers to have assurances in the short term over the quality of their product, as well as reducing any potential risks to public health.

An example of this in practice is the use of GC by Dutch company Shamanics which carries out testing service for coffee shops in the Netherlands. The company conducts terpene analysis and potency testing to assure the quality of the products it supplies, with a portable GC, which offers the flexibility required without any established guidelines on testing in place.

When testing for potency using the GC, they look for total THC and CBD by converting the acidified versions of the cannabinoids into neutral forms within the heat of the GC injector. The process has flexibility which means that if they need to see both the acidified and neutral versions, they can do this by derivatizing the sample. The accuracy of this process is crucial to Shamanics and similar companies within the industry so that they can accurately judge the quality of a product, and relay this information to retailers and consumers.

The future of GC in standardized testing

While the growing availability of portable GC instruments and the increasing sophistication of individual labs means more companies are able to self-test products, there is still a significant hurdle to overcome in terms of standardising and regulating both the medical and recreational cannabis markets. Where regulation is brought in it should be consistent across states and countries and most importantly, it should be monitored and enforced. In the meantime, responsible producers are using the technology available to them to provide consumers with guarantees that their cannabis products are safe and of a high quality.

IR Spectrum of 2,4-Dichlorophenol in different physical states
From The Lab

Gas Chromatography/Infrared Spectroscopy: A Tool For the Analysis of Organic Compounds in Cannabis

By John F. Schneider
2 Comments
IR Spectrum of 2,4-Dichlorophenol in different physical states

Editor’s Note: The author will be teaching a 1/2 day short course on this topic at PITTCON in Philadelphia in March 2019.


The combination of gas chromatography and infrared spectroscopy (GC/IR) is a powerful tool for the characterization of compounds in complex mixtures. (1-5) Gas chromatography with mass spectroscopy detection (GC/MS) is a similar technique, but GC/MS is a destructive technique that tears apart the sample molecules during the ionization process and then these fragments are used to characterize the molecule. In GC/IR the molecules are not destroyed but the IR light produced by molecular vibrations are used to characterize the molecule. IR spectrum yields information about the whole molecule which allows the characterization of specific isomers and functional groups. GC/IR is complementary to GC/MS and the combination results in a powerful tool for the analytical chemist.

A good example of the utility of GC/IR vs GC/MS is the characterization of stereo isomers. Stereo isomers are mirror images such as a left hand and a right hand. In nature, stereo isomers are very important as one isomers will be more active then its mirror image. Stereo isomers are critical to medicinal application of cannabis and also a factor in the flavor components of cannabis.

GC/MS is good at identifying basic structure, where GC/IR can identify subtle differences in structure. GC/MS could identify a hand, GC/IR could tell you if it is a left hand or right hand. GC/MS can identify a general class of compounds, GC/IR can identify the specific isomer present.

Why GC/IR?

Gas chromatography interfaced with infrared detection (GC/IR), combines the separation ability of GC and the structural information from IR spectroscopy. GC/IR gives the analyst the ability to obtain information complementary to GC/MS. GC/IR gives the analyst the power to perform functional group detection and differentiate between similar molecular isomers that is difficult with GC/MS. Isomer specificity can be very important in flavor and medical applications.

 IR Spectrum of 2,4-Dichlorophenol in different physical states

IR Spectrum of 2,4-Dichlorophenol in different physical states

Gas chromatography with mass spectrometry detection (GC/MS) is the state-of-the-art method for the identification of unknown compounds. GC/MS, however, is not infallible and many compounds are difficult to identify with 100 % certainty. The problem with GC/MS is that it is a destructive method that tears apart a molecule. In infrared spectrometry (IR), molecular identification is based upon the IR absorptions of the whole molecule. This technique allows differentiation among isomers and yields information about functional groups and the position of such groups in a molecule. GC/IR complements the information obtained by GC/MS.

Interfaces

Initial attempts to couple GC with IR were made using high capacity GC columns and stopped flow techniques. As GC columns and IR technology advanced, the GC/IR method became more applicable. The advent of fused silica capillary GC columns and the availability of Fourier transform infrared spectrometry made GC/IR available commercially in several forms. GC/IR using a flow cell to capture the IR spectrum in real time is known as the “Light Pipe”. This is the most common form of GC/IR and the easiest to use. GC/IR can also be done by capturing or “trapping” the analytes of interest eluting from a GC and then measuring the IR spectrum. This can be done by cryogenically trapping the analyte in the solid phase. A third possibility is to trap the analyte in a matrix of inert material causing “Matrix Isolation” of the analyte followed by measuring the IR spectrum.

Infrared Spectroscopy

The physical state of the sample has a large effect upon the IR spectrum produced. Molecular interactions (especially hydrogen bonding) broadens absorption peaks. Solid and liquid samples produce IR spectra with broadened peaks that loses much of the potential information obtained in the spectra. Surrounding the sample molecule with gas molecules or in an inert matrix greatly sharpens the peaks in the spectrum, revealing more of the information and producing a “cleaner” spectrum. These spectra lend themselves better to computer searches of spectral libraries similar to the computer searching done in mass spectroscopy. IR spectral computer searching requires the standard spectra in the library be of the same physical state as the sample. So, a spectrum taken in a gaseous state should be searched against a library of spectra of standards in the gaseous state.

IR of various phases:

  • Liquid Phase – Molecular interactions broaden absorption peaks.
  • Solid Phase – Molecular interactions broaden absorption peaks.
  • Gas Phase – Lack of molecular interactions sharpen absorption peaks.
  • Matrix Isolation – Lack of molecular interactions sharpen absorption peaks.

IR Chromatograms

GC/IR yields chromatograms of infrared absorbance over time. These can be total infrared absorbance which is similar to the total ion chromatogram (TIC) in GC/MS or the infrared absorbance over a narrow band or bands analogous to selected ion chromatogram. This is a very powerful ability, because it gives the user the ability to focus on selected functional groups in a mixture of compounds.

Conclusion

Gas chromatography with infrared detection is a powerful tool for the elucidation of the structure of organic compounds in a mixture. It is complementary to GC/MS and is used to identify specific isomers and congeners of organic compounds. This method is greatly needed in the Cannabis industry to monitor the compounds that determine the flavor and the medicinal value of its products.


References

  1. GC–MS and GC–IR Analyses of the Methoxy-1-n-pentyl-3-(1-naphthoyl)-Indoles: Regioisomeric Designer Cannabinoids, Amber Thaxton-Weissenfluh, Tarek S. Belal, Jack DeRuiter, Forrest Smith, Younis Abiedalla, Logan Neel, Karim M. Abdel-Hay, and C. Randall Clark, Journal of Chromatographic Science, 56: 779-788, 2018
  2. Simultaneous Orthogonal Drug Detection Using Fully Integrated Gas Chromatography with Fourier Transform Infrared Detection and Mass Spectrometric Detection , Adam Lanzarotta, Travis Falconer, Heather McCauley, Lisa Lorenz, Douglas Albright, John Crowe, and JaCinta Batson, Applied Spectroscopy Vol. 71, 5, pp. 1050-1059, 2017
  3. High Resolution Gas Chromatography/Matrix Isolation Infrared Spectrometry, Gerald T. Reedy, Deon G. Ettinger, John F. Schneider, and Sid Bourne, Analytical Chemistry, 57: 1602-1609, 1985
  4. GC/Matrix Isolation/FTIR Applications: Analysis of PCBs, John F. Schneider, Gerald T. Reedy, and Deon G. Ettinger, Journal of Chromatographic Science, 23: 49-53, 1985
  5. A Comparison of GC/IR Interfaces: The Light Pipe Vs. Matrix Isolation, John F. Schneider, Jack C. Demirgian, and Joseph C. Stickler, Journal of Chromatographic Science, 24: 330- 335, 1986
  6. Gas Chromatography/Infrared Spectroscopy, Jean ‐ Luc Le Qu é r é , Encyclopedia of Analytical Chemistry, John Wiley & Sons, 2006
extractiongraphic

The Four Pillars of Cannabis Processing

By Christian Sweeney
2 Comments
extractiongraphic

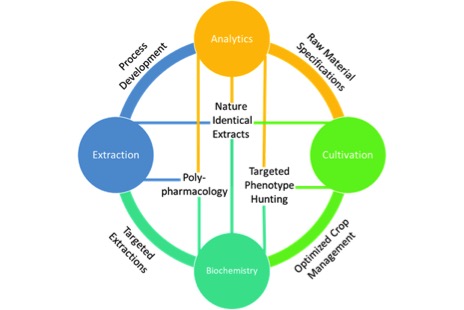
Cannabis extraction has been used as a broad term for what can best be described as cannabis processing. A well-thought-out cannabis process goes far beyond just extraction, largely overlapping with cultivation on the front-end and product development on the back-end1. With this in mind, four pillars emerge as crucial capabilities for developing a cannabis process: Cultivation, Extraction, Analytics and Biochemistry.

The purpose and value of each pillar on their own is clear, but it is only when combined that each pillar can be optimized to provide their full capacities in a well-designed process. As such, it is best to define the goals of each pillar alone, and then explain how they synergize with each other.

At the intersection of each pillar, specific technology platforms exist that can effectively drive an innovation and discovery cycle towards the development of ideal products.Cultivation is the foundation of any horticultural process, including cannabis production. Whether the goal be to convert pigments, flavors or bioactive compounds into a usable form, a natural process should only utilize what is provided by the raw material, in this case cannabis flower. That means cultivation offers a molecular feedstock for our process, and depending on our end goals there are many requirements we may consider. These requirements start as simply as mass yield. Various metrics that can be used here include mass yield per square foot or per light. Taken further, this yield may be expressed based not only on mass, but the cannabinoid content of the plants grown. This could give rise to a metric like CBD or THC yield per square foot and may be more representative of a successful grow. Furthermore, as scientists work to learn more about how individual cannabinoids and their combinations interact with the human body, cultivators will prioritize identifying cultivars that provide unique ratios of cannabinoids and other bioactive compounds consistently. Research into the synergistic effect of terpenes with cannabinoids suggests that terpene content should be another goal of cultivation2. Finally, and most importantly, it is crucial that cultivation provide clean and safe materials downstream. This means cannabis flower free of pesticides, microbial growth, heavy metals and other contaminants.

Extraction is best described as the conversion of target molecules in cannabis raw material to a usable form. Which molecules those are depends on the goals of your product. This ranges from an extract containing only a pure, isolated cannabinoid like CBD, to an extract containing more than 100 cannabinoids and terpenes in a predictable ratio. There are countless approaches to take in terms of equipment and process optimization in this space so it is paramount to identify which is the best fit for the end-product1. While each extraction process has unique pros and cons, the tunability of supercritical carbon dioxide provides a flexibility in extraction capabilities unlike any other method. This allows the operator to use a single extractor to create extracts that meet the needs of various product applications.

Analytics provide a feedback loop at every stage of cannabis production. Analytics may include gas chromatography methods for terpene content3 or liquid chromatography methods for cannabinoids 3, 4, 5. Analytical methods should be specific, precise and accurate. In an ideal world, they can identify the compounds and their concentrations in a cannabis product. Analytics are a pillar of their own due simply to the efforts required to ensure the quality and reliability of results provided as well as ongoing optimization of methods to provide more sensitive and useful results. That said, analytics are only truly harnessed when paired with the other three pillars.

extractiongraphic
Figure 1: When harnessed together the pillars of cannabis processing provide platforms of research and investigation that drive the development of world class products.

Biochemistry can be split into two primary focuses. Plant biochemistry focuses back towards cultivation and enables a cannabis scientist to understand the complicated pathways that give rise to unique ratios of bioactive molecules in the plant. Human biochemistry centers on how those bioactive molecules interact with the human endocannabinoid system, as well as how different routes of administration may affect the pharmacokinetic delivery of those active molecules.

Each of the pillars require technical expertise and resources to build, but once established they can be a source of constant innovation. Fig. 1 above shows how each of these pillars are connected. At the intersection of each pillar, specific technology platforms exist that can effectively drive an innovation and discovery cycle towards the development of ideal products.

For example, at the intersection of analytics and cultivation I can develop raw material specifications. This sorely needed quality measure could ensure consistencies in things like cannabinoid content and terpene profiles, more critically they can ensure that the raw material to be processed is free of contamination. Additionally, analytics can provide feedback as I adjust variables in my extraction process resulting in optimized methods. Without analytics I am forced to use very rudimentary methods, such as mass yield, to monitor my process. Mass alone tells me how much crude oil is extracted, but says nothing about the purity or efficiency of my extraction process. By applying plant biochemistry to my cultivation through the use of analytics I could start hunting for specific phenotypes within cultivars that provide elevated levels of specific cannabinoids like CBC or THCV. Taken further, technologies like tissue culturing could rapidly iterate this hunting process6. Certainly, one of the most compelling aspects of cannabinoid therapeutics is the ability to harness the unique polypharmacology of various cannabis cultivars where multiple bioactive compounds are acting on multiple targets7. To eschew the more traditional “silver bullet” pharmaceutical approach a firm understanding of both human and plant biochemistry tied directly to well characterized and consistently processed extracts is required. When all of these pillars are joined effectively we can fully characterize our unique cannabis raw material with targeted cannabinoid and terpene ratios, optimize an extraction process to ensure no loss of desirable bioactive compounds, compare our extracted product back to its source and ensure we are delivering a safe, consistent, “nature identical” extract to use in products with predictable efficacies.

Using these tools, we can confidently set about the task of processing safe, reliable and well characterized cannabis extracts for the development of world class products.


[1] Sweeney, C. “Goal-Oriented Extraction Processes.” Cannabis Science and Technology, vol 1, 2018, pp 54-57.

[2] Russo, E. B. “Taming THC: potential cannabis synergy and phytocannabinoid-terpenoid entourage effects.” British Journal of Pharmacology, vol. 163, no. 7, 2011, pp. 1344–1364.

[3] Giese, Matthew W., et al. “Method for the Analysis of Cannabinoids and Terpenes in Cannabis.” Journal of AOAC International, vol. 98, no. 6, 2015, pp. 1503–1522.

[4] Gul W., et al. “Determination of 11 Cannabinoids in Biomass and Extracts of Different Varieties of Cannabis Using high-Performance Liquid Chromatography.” Journal of AOAC International, vol. 98, 2015, pp. 1523-1528.

[5] Mudge, E. M., et al. “Leaner and Greener Analysis of Cannabinoids.” Analytical and Bioanalytical Chemistry, vol. 409, 2017, pp. 3153-3163.

[6] Biros, A. G., Jones, H. “Applications for Tissue Culture in Cannabis Growing: Part 1.” Cannabis Industry Journal, 13 Apr. 2017, www.cannabisindustryjournal.com/feature_article/applications-for-tissue-culture-in-cannabis-growing-part-1/.

[7] Brodie, James S., et al. “Polypharmacology Shakes Hands with Complex Aetiopathology.” Trends in Pharmacological Sciences, vol. 36, no. 12, 2015, pp. 802–821.

Terpene_KAS2
From The Lab

The Other Side of Cannabis: Terpenes

By Dr. Zacariah Hildenbrand, Allegra Leghissa, Dr. Kevin A. Schug
2 Comments
Terpene_KAS2

Have you ever wondered why all beers have that strong, characteristic smell? Or why you could tell the smell of cannabis apart from any other plant? The answer is simple – terpenes.

These 55,000 different molecules are responsible for a majority of the odors and fragrances around us, from a pine forest, to the air diffuser in your house 1–3. They all share the same precursor, isoprene, and because of that, they are all related and have similar molecular structures. Unfortunately, it is this uncanny similarity that makes their analysis so challenging; we still lack a complete list of which terpenes expected to be found in each given plant species 1,2.

Many different methods have been developed in an effort to provide a time-optimized and straightforward analysis. Gas chromatography (GC) is usually center stage due to the volatility of the terpenes. Therefore, there is significant concern with the type of GC detector used 2.

The flame ionization detector (FID) is a good quantitative detector for GC, but qualitatively it does not provide any information, except for retention time; the differentiation between terpene species is achieved solely by use of retention indices (RI), which are based on elution times from a particular GC stationary phase. The best part of the FID is its low cost, reliability, and relatively easy interface, which make it an effective tool for quality control (QC) but less so with respect to research and discovery 2.

The primary choice for a research setting is the mass spectrometer (MS) detector. It is more expensive and complicated than FID, but importantly, it provides both good quantitative capabilities, and it provides mass spectra for each species that elutes from the chromatograph. However, for terpene analysis, it may still not be the best detector choice. Since terpene class molecules share many structural and functional similarities, even their fragmentation and sub-sequential identification by MS may lead to inconsistent results, which need to be confirmed by use of RI. Still, MS is a better qualitative analysis tool than the FID, especially for distinguishing non-isobaric terpenes 2.

Recently, new technology based on vacuum ultraviolet spectroscopy (VUV) has been developed as a new GC detector. The VUV detector enables analysis of virtually all molecules; virtually all chemical compounds absorb light in the range in the 125-240 nm wavelength range probed by the detector, making it an essentially universal detector 4–11. Previously, spectroscopic absorption detectors for GC have lacked sufficient energy to measure absorption of most GC-amenable species. The VUV detector fills a niche, which is complementary to MS detection in terms of the qualitative information it provides.

Terpene_KAS2
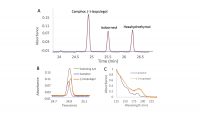
Figure 1: A, Section of the chromatographic separation of a terpenes standard mix; B, highlight of the co-eluting terpenes, camphor and (-)-isopulegol; C, differences in the absorbance spectra of camphor and (-)-isopulegol.

With the VUV detector, each compound exhibits its own unique absorbance spectrum. Even isomers and isobars, which are prevalent in terpene mixtures and can be difficult to distinguish different species by their electron ionization mass spectra, can be well differentiated based on their VUV spectra 6,9,10.  Nevertheless, because analytes exhibit different spectra, it is not required to achieve a perfect chromatographic separation of the mixture components. Co-eluting peaks can be separated post-run through the use of library spectra and software inherent to the instrument 4,10. This ability is called “deconvolution”, and it is based on the fact that two co-eluting terpenes will give a peak with an absorbance spectrum equal to the sum of the two single absorbance spectra 4. Figure 1 shows the deconvolution process for two co-eluting terpenes, camphor and (-)-isopulegol. Due to their different absorbance spectra (Figure 1C), it is possible to fully separate the two peaks in post-run, obtaining sharp peaks for both analytes 6.

The deconvolution process has been shown to yield precise and accurate results. Thus, chromatographic resolution can be sacrificed in favor of spectroscopic resolution; this enables the development of methods with faster run times. With the ability to deconvolve unresolved peaks, a long temperature ramp to chromatographically separate all isomeric terpenes is not required 6. Additionally, the presence of coeluting components, which might normally go undetected with some GC detectors, can be easily judged based on comparison of the measured spectra with pure reference spectra contained in the VUV spectral library.

The other issue in terpenes analysis is the extraction process. Terpenes can be extracted with the use of solvents (e.g., methanol, ethanol, hexane, and cyclohexane, among others), but the process is usually time-consuming, costly and not so environmentally-friendly 2. The plant needs to be manually crushed and then aliquots of solvent are used to extract components from the plant, ideally at least 3 times and combined to achieve acceptable results. The problem is that some terpenes may respond better to a certain solvent, making their extraction easier and more optimized than for others 2. The choice of solvent can cause discrimination against the extraction some terpenes, which limits the comprehensiveness of analysis.

Headspace is another technique that can be used for the sample preparation of terpenes. Headspace sampling is based on heating the solid or liquid sample inside a sealed vial, and then analyzing the air above it after sufficient equilibration. In this way, only volatile analytes are extracted from the solid/liquid sample into the gas phase; this allows relatively interference-free sampling 12–14.

How do we know whether our extraction analysis methods are correct and comprehensive for a certain plant sample? Unfortunately, there is not a complete list of available molecules for each plant species, and even if two specimens may smell really similar to our nose, their terpenes profiles may be notably different. When working with a new plant material, it is difficult to predict the extraction efficiency for the vast array of terpenes that may be present. We can only perform it with different extraction and detection methods, and compare the results.

The route for a comprehensive and fast analysis of terpenes is therefore still long; however, their intoxicating aromas and inherent medicinal value has provided a growing impetus for researchers around the world. Considering the evolving importance of Cannabis and the growing body of evidence on the synergistic effects between terpenes and cannabinoids, it is likely that newly improved extraction and analysis methods will be developed, paving the way for a more complete list of terpene species that can be found in different cultivars. The use of new analytical technologies, such as the VUV detector for GC, should aid considerably in this endeavor.


References:

[1]          Breitmaier E., Terpenes: Flavors, Fragrances, Pharmaca, Pheromones. John Wiley & Sons 2006.

[2]          Leghissa A., Hildenbrand Z. L., Schug K. A., A Review of Methods for the Chemical Characterization of Cannabis Natural Products. J. Sep. Sci.2018, 41, 398–415 .

[3]          Benvenuto E., Misra B. B., Stehle F., Andre C. M., Hausman J.-F., Guerriero G., Cannabis sativa: The Plant of the Thousand and One Molecules. Front. Plant Sci2016, 719, DOI: 10.3389/fpls.2016.00019.

[4]          Schug K. A., Sawicki I., Carlton D. D., Fan H.,Mcnair H. M.,Nimmo J. P., Kroll P.,Smuts J.,Walsh P., Harrison D., Vacuum Ultraviolet Detector for Gas Chromatography. Anal. Chem.2014, 86, 8329–8335 .

[5]          Fan H.,Smuts J., Walsh P.,Harrison D., Schug K. A., Gas chromatography-vacuum ultraviolet spectroscopy for multiclass pesticide identification. J. Chromatogr. A2015, DOI: 10.1016/j.chroma.2015.02.035.

[6]          Qiu C.,Smuts J., Schug K. A., Analysis of terpenes and turpentines using gas chromatography with vacuum ultraviolet detection. J. Sep. Sci.2017, 40, 869–877 .

[7]          Leghissa A., Smuts J., Qiu C., Hildenbrand Z. L., Schug K. A., Detection of cannabinoids and cannabinoid metabolites using gas chromatography-vacuum ultraviolet spectroscopy. Sep. Sci. Plus2018, 1.

[8]          Bai L.,Smuts J., Walsh P., Fan H., Hildenbrand Z., Wong D., Wetz D., Schug K. A., Permanent gas analysis using gas chromatography with vacuum ultraviolet detection. J. Chromatogr. A2015,1388, 244–250 .

[9]          Skultety L., Frycak P., Qiu C.,Smuts J., Shear-Laude L., Lemr K., Mao J. X., Kroll P., Schug K. A., Szewczak A., Vaught C., Lurie I., Havlicek V., Resolution of isomeric new designer stimulants using gas chromatography – Vacuum ultraviolet spectroscopy and theoretical computations. Anal. Chim. Acta2017, 971, 55–67 .

[10]       Bai L., Smuts J., Walsh P., Qiu C., McNair H. M., Schug K. ., Pseudo-absolute quantitative analysis using gas chromatography–vacuum ultraviolet spectroscopy–a tutorial. Anal. Chim. Acta2017, 953, 10–22 .

[11]       Schenk J., Nagy G., Pohl N. L. B., Leghissa A., Smuts J., Schug K. A., Identification and deconvolution of carbohydrates with gas chromatography-vacuum ultraviolet spectroscopy. J. Chromatogr. A2017, 1513, 210–221 .

[12]       Van Opstaele F., De Causmaecker B., Aerts G., De Cooman L., Characterization of novel varietal floral hop aromas by headspace solid phase microextraction and gas chromatography-mass spectrometry/olfactometry. J. Agric. Food Chem.2012, 60, 12270−12281 .

[13]       Hamm S., Bleton J., Connan J., Tchapla A., A chemical investigation by headspace SPME and GC-MS of volatile and semi-volatile terpenes in various olibanum samples. Phytochemistry2005,66, 1499–1514 .

[14]       Aberl A., Coelhan M., Determination of volatile compounds in different hop Varieties by headspace-trap GC/MS-in comparison with conventional hop essential oil analysis. J. Agric. Food Chem.2012, 60, 2785−2792 .

Quality Assurance In The Field: Instruments For Growers & Processors

By Aaron G. Biros
2 Comments

As the cannabis marketplace evolves, so does the technology. Cultivators are scaling up their production and commercial-scale operations are focusing more on quality. That greater attention to detail is leading growers, extractors and infused product manufacturers to use analytical chemistry as a quality control tool.

Previously, using analytical instrumentation, like mass spectrometry (MS) or gas chromatography (GC), required experience in the laboratory or with chromatography, a degree in chemistry or a deep understanding of analytical chemistry. This leaves the testing component to those that are competent enough and scientifically capable to use these complex instruments, like laboratory personnel, and that is still the case. As recent as less than two years ago, we began seeing instrument manufacturers making marketing claims that their instrument requires no experience in chromatography.

Instrument manufacturers are now competing in a new market: the instrument designed for quality assurance in the field. These instruments are more compact, lighter and easier to use than their counterparts in the lab. While they are no replacement for an accredited laboratory, manufacturers promise these instruments can give growers an accurate estimate for cannabinoid percentages. Let’s take a look at a few of these instruments designed and marketed for quality assurance in the field, specifically for cannabis producers.

Ellutia GC 200 Series

Shamanics, a cannabis extractor in Amsterdam, uses Ellutia’s 200 series for QA testing

Ellutia is an instrument manufacturer from the UK. They design and produce a range of gas chromatographs, GC accessories, software and consumables, most of which are designed for use in a laboratory. Andrew James, marketing director at Ellutia, says their instrument targeting this segment was originally designed for educational purposes. “The GC is compact in size and lightweight in stature with a full range of detectors,” says James. “This means not only is it portable and easy to access but also easy to use, which is why it was initially intended for the education market.”

Andrew James, marketing director at Ellutia

That original design for use in teaching, James says, is why cannabis producers might find it so user-friendly. “It offers equivalent performance to other GC’s meaning we can easily replace other GC’s performing the same analysis, but our customers can benefit from the lower space requirement, reduced energy bills, service costs and initial capital outlay,” says James. “This ensures the lowest possible cost of ownership, decreasing the cost per analysis and increasing profits on every sample analyzed.”

Shamanics, a cannabis oil extraction company based in Amsterdam, uses Ellutia’s 200 series for quality assurance in their products. According to Bart Roelfsema, co-founder of Shamanics, they have experienced a range of improvements in monitoring quality since they started using the 200 series. “It is very liberating to actually see what you are doing,” says Roelfsema. “If you are a grower, a manufacturer or a seller, it is always reassuring to see what you have and prove or improve on your quality.” Although testing isn’t commonplace in the Netherlands quite yet, the consumer demand is rising for tested products. “We also conduct terpene analysis and cannabinoid acid analysis,” says Roelfsema. “This is a very important aspect of the GC as now it is possible to methylate the sample and test for acids; and the 200 Series is very accurate, which is a huge benefit.” Roelfsema says being able to judge quality product and then relay that information to retail is helping them grow their business and stay ahead of the curve.

908 Devices G908 GC-HPMS

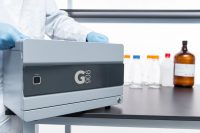
908 Devices, headquartered in Boston, is making a big splash in this new market with their modular G908 GC-HPMS. The company says they are “democratizing chemical analysis by way of mass spectrometry,” with their G908 device. That is a bold claim, but rather appropriate, given that MS used to be reserved strictly for the lab environment. According to Graham Shelver, Ph.D., commercial leader for Applied Markets at 908 Devices Inc., their company is making GC-HPMS readily available to users wanting to test cannabis products, who do not need to be trained analytical chemists.

The G908 device.

Shelver says they have made the hardware modular, letting the user service the device themselves. This, accompanied by simplified software, means you don’t need a Ph.D. to use it. “The “analyzer in a box” design philosophy behind the G908 GC-HPMS and the accompanying JetStream software has been to make using the entire system as straightforward as possible so that routine tasks such as mass axis calibration are reduced to simple single actions and sample injection to results reporting becomes a single button software operation,” says Shelver.

He also says while it is designed for use in the field, laboratories also use it to meet higher-than-usual demand. Both RM3 Labs in Colorado, and ProVerde in Massachusetts, use G908. “RM3’s main goal with the G908 is increased throughput and ProVerde has found it useful in adding an orthogonal and very rapid technique (GC-HPMS) to their suite of cannabis testing instruments,” says Shelver.

Orange Photonics LightLab Cannabis Analyzer

Orange Photonics’ LightLab Cannabis Analyzer

Dylan Wilks, a third generation spectroscopist, launched Orange Photonics with his team to produce analytical tools that are easy to use and can make data accessible where it has been historically absent, such as onsite testing within the cannabis space. According to Stephanie McArdle, president of Orange Photonics, the LightLab Cannabis Analyzer is based on the same principles as HPLC technology, combining liquid chromatography with spectroscopy. Unlike an HPLC however, LightLab is rugged, portable and they claim you do not need to be a chemist to use it.

“LightLab was developed to deliver accurate repeatable results for six primary cannabinoids, D9THC, THC-A, CBD, CBD-A, CBG-A and CBN,” says McArdle. “The sample prep is straightforward: Prepare a homogenous, representative sample, place a measured portion in the provided vial, introduce extraction solvent, input the sample into LightLab and eight minutes later you will have your potency information.” She says their goal is to ensure producers can get lab-grade results.

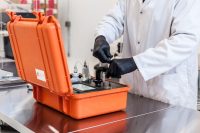
The hard plastic case is a unique feature of this instrument

McArdle also says the device is designed to test a wide range of samples, allowing growers, processors and infused product manufacturers to use it for quality assurance. “Extracts manufacturers use LightLab to limit loss- they accurately value trim purchases on the spot, they test throughout their extraction process including tests on spent material (raffinate) and of course the final product,” says McArdle. “Edibles manufacturers test the potency of their raw ingredients and check batch dosing. Cultivators use LightLab for strain selection, maturation monitoring, harvesting at peak and tinkering.”

Orange Photonics’ instrument also connects to devices via Wi-Fi and Bluetooth. McArdle says cannabis companies throughout the supply chain use it. “We aren’t trying to replace lab testing, but anyone making a cannabis product is shooting in the dark if they don’t have access to real time data about potency,” says McArdle.

Chris English
The Practical Chemist

Accurate Detection of Residual Solvents in Cannabis Concentrates

By Chris English
2 Comments
Chris English

Edibles and vape pens are rapidly becoming a sizable portion of the cannabis industry as various methods of consumption popularize beyond just smoking dried flower. These products are produced using cannabis concentrates, which come in the form of oils, waxes or shatter (figure 1). Once the cannabinoids and terpenes are removed from the plant material using solvents, the solvent is evaporated leaving behind the product. Extraction solvents are difficult to remove in the low percent range so the final product is tested to ensure leftover solvents are at safe levels. While carbon dioxide and butane are most commonly used, consumer concern over other more toxic residual solvents has led to regulation of acceptable limits. For instance, in Colorado the Department of Public Health and Environment (CDPHE) updated the state’s acceptable limits of residual solvents on January 1st, 2017.

Headspace Analysis

Figure 1: Shatter can be melted and dissolved in a high molecular weight solvent for headspace analysis (HS). Photo Courtesy of Cal-Green Solutions.

Since the most suitable solvents are volatile, these compounds are not amenable to HPLC methods and are best suited to gas chromatography (GC) using a thick stationary phase capable of adequate retention and resolution of butanes from other target compounds. Headspace (HS) is the most common analytical technique for efficiently removing the residual solvents from the complex cannabis extract matrix. Concentrates are weighed out into a headspace vial and are dissolved in a high molecular weight solvent such as dimethylformamide (DMF) or 1,3-dimethyl-3-imidazolidinone (DMI). The sealed headspace vial is heated until a stable equilibrium between the gas phase and the liquid phase occurs inside the vial. One milliliter of gas is transferred from the vial to the gas chromatograph for analysis. Another approach is full evaporation technique (FET), which involves a small amount of sample sealed in a headspace vial creating a single-phase gas system. More work is required to validate this technique as a quantitative method.

Gas Chromatographic Detectors

The flame ionization detector (FID) is selective because it only responds to materials that ionize in an air/hydrogen flame, however, this condition covers a broad range of compounds. When an organic compound enters the flame; the large increase in ions produced is measured as a positive signal. Since the response is proportional to the number of carbon atoms introduced into the flame, an FID is considered a quantitative counter of carbon atoms burned. There are a variety of advantages to using this detector such as, ease of use, stability, and the largest linear dynamic range of the commonly available GC detectors. The FID covers a calibration of nearly 5 orders of magnitude. FIDs are inexpensive to purchase and to operate. Maintenance is generally no more complex than changing jets and ensuring proper gas flows to the detector. Because of the stability of this detector internal standards are not required and sensitivity is adequate for meeting the acceptable reporting limits. However, FID is unable to confirm compounds and identification is only based on retention time. Early eluting analytes have a higher probability of interferences from matrix (Figure 2).

Figure 2: Resolution of early eluting compounds by headspace – flame ionization detection (HS-FID). Chromatogram Courtesy of Trace Analytics.

Mass Spectrometry (MS) provides unique spectral information for accurately identifying components eluting from the capillary column. As a compound exits the column it collides with high-energy electrons destabilizing the valence shell electrons of the analyte and it is broken into structurally significant charged fragments. These fragments are separated by their mass-to-charge ratios in the analyzer to produce a spectral pattern unique to the compound. To confirm the identity of the compound the spectral fingerprint is matched to a library of known spectra. Using the spectral patterns the appropriate masses for quantification can be chosen. Compounds with higher molecular weight fragments are easier to detect and identify for instance benzene (m/z 78), toluene (m/z 91) and the xylenes (m/z 106), whereas low mass fragments such as propane (m/z 29), methanol (m/z 31) and butane (m/z 43) are more difficult and may elute with matrix that matches these ions. Several disadvantages of mass spectrometers are the cost of equipment, cost to operate and complexity. In addition, these detectors are less stable and require an internal standard and have a limited dynamic range, which can lead to compound saturation.

Regardless of your method of detection, optimized HS and GC conditions are essential to properly resolve your target analytes and achieve the required detection limits. While MS may differentiate overlapping peaks the chances of interference of low molecular weight fragments necessitates resolution of target analytes chromatographically. FID requires excellent resolution for accurate identification and quantification.

The Practical Chemist

Appropriate Instrumentation for the Chemical Analysis of Cannabis and Derivative Products: Part 1

By Rebecca Stevens
1 Comment

Election Day 2016 resulted in historic gains for state level cannabis prohibition reform. Voters in California, Maine, Massachusetts and Nevada chose to legalize adult use of Cannabis sp. and its extracts while even traditionally conservative states like Arkansas, Florida, Montana and North Dakota enacted policy allowing for medical use. More than half of the United States now allows for some form of legal cannabis use, highlighting the rapidly growing need for high quality analytical testing.

For the uninitiated, analytical instrumentation can be a confusing mix of abbreviations and hyphenation that provides little obvious information about an instrument’s capability, advantages and disadvantages. In this series of articles, my colleagues and I at Restek will break down and explain in practical terms what instruments are appropriate for a particular analysis and what to consider when choosing an instrumental technique.

Potency Analysis

Potency analysis refers to the quantitation of the major cannabinoids present in Cannabis sp. These compounds are known to provide the physiological effects of cannabis and their levels can vary dramatically based on cultivation practices, product storage conditions and extraction practices.

The primary technique is high performance liquid chromatography (HPLC) coupled to ultraviolet absorbance (UV) detection. Gas chromatography (GC) coupled to a flame ionization detector (FID) or mass spectrometry (MS) can provide potency information but suffers from issues that preclude its use for comprehensive analysis.

Pesticide Residue Analysis

Pesticide residue analysis is, by a wide margin, the most technically challenging testing that we will discuss here. Trace levels of pesticides incurred during cultivation can be transferred to the consumer both on dried plant material and in extracts prepared from the contaminated material. These compounds can be acutely toxic and are generally regulated at part per billion parts-per-billion levels (PPB).

Depending on the desired target pesticides and detection limits, HPLC and/or GC coupled with tandem mass spectrometry (MS/MS) or high resolution accurate mass spectrometry (HRAM) is strongly recommended. Tandem and HRAM mass spectrometry instrumentation is expensive, but in this case it is crucial and will save untold frustration during method development.

Residual Solvents Analysis

When extracts are produced from plant material using organic solvents such as butane, alcohols or supercritical carbon dioxide there is a potential for the solvent and any other contaminants present in it to become trapped in the extract. The goal of residual solvent analysis is to detect and quantify solvents that may remain in the finished extract.

Residual solvent analysis is best accomplished using GC coupled to a headspace sample introduction system (HS-GC) along with FID or MS detection. Solid phase microextraction (SPME) of the sample headspace with direct introduction to the GC is another option.

Terpene Profile Analysis

While terpene profiles are not a safety issue, they provide much of the smell and taste experience of cannabis and are postulated to synergize with the physiologically active components. Breeders of Cannabis sp. are often interested in producing strains with specific terpene profiles through selective breeding techniques.

Both GC and HPLC can be employed successfully for terpenes analysis. Mass spectrometry is suitable for detection as well as GC-FID and HPLC-UV.

Heavy Metals Analysis

Metals such as arsenic, lead, cadmium, chromium and mercury can be present in cannabis plant material due to uptake from the soil, fertilizers or hydroponic media by a growing plant. Rapidly growing plants like Cannabis sp. are particularly efficient at extracting and accumulating metals from their environment.

Several different types of instrumentation can be used for metals analysis, but the dominant technology is inductively coupled plasma mass spectrometry (ICP-MS). Other approaches can also be used including ICP coupled with optical emission spectroscopy (ICP-OES).

Rebecca is an Applications Scientist at Restek Corporation and is eager to field any questions or comments on cannabis analysis, she can be reached by e-mail, rebecca.stevens@restek.com or by phone at 814-353-1300 (ext. 2154)

An inductively coupled plasma torch used in MS reaches local temperatures rivaling the surface of the sun. Image by W. Blanchard, Wikimedia
An inductively coupled plasma torch used in Optical Emission Spectroscopy (OES) reaches local temperatures rivaling the surface of the sun. Image by W. Blanchard, Wikimedia
teganheadshot
Quality From Canada

Near Infrared, GC and HPLC Applications in Cannabis Testing

By Tegan Adams, Michael Bertone
5 Comments
teganheadshot

When a cannabis sample is submitted to a lab for testing there is a four-step process that occurs before it is tested in the instrumentation on site:

  1. It is ground at a low temperature into a fine powder;
  2. A solution is added to the ground powder;
  3. An extraction is repeated 6 times to ensure all cannabinoids are transferred into a common solution to be used in testing instrumentation.
  4. Once the cannabinoid solution is extracted from the plant matter, it is analyzed using High Pressure Liquid Chromatograph (HPLC). HPLC is the key piece of instrumentation in cannabis potency testing procedures.

While there are many ways to test cannabis potency, HPLC is the most widely accepted and recognized testing instrumentation. Other instrument techniques include gas chromatography (GC) and thin layer chromatography (TLC). HPLC is preferred over GC because it does not apply heat in the testing process and cannabinoids can then be measured in their naturally occurring forms. Using a GC, heat is applied as part of the testing process and cannabinoids such as THCA or CBDA can change form, depending on the level of heat applied. CBDA and THCA have been observed to change form at as low as 40-50C. GC uses anywhere between 150-200C for its processes, and if using a GC, a change of compound form can occur. Using HPLC free of any high-heat environments, acidic (CBDA & THCA) and neutral cannabinoids (CBD, THC, CBG, CBN and others) can be differentiated in a sample for quantification purposes.

Near Infrared

Near infrared (NIR) has been used with cannabis for rapid identification of active pharmaceutical ingredients by measuring how much light different substances reflect. Cannabis is typically composed of 5-30% cannabinoids (mainly THC and CBD) and 5-15% water. Cannabinoid content can vary by over 5% (e.g. 13-18%) on a single plant, and even more if grown indoors. Multiple NIR measurements can be cost effective for R&D purposes. NIR does not use solvents and has a speed advantage of at least 50 times over traditional methods.

The main downfall of NIR techniques is that they are generally less accurate than HPLC or GC for potency analyses. NIR can be programmed to detect different compounds. To obtain accuracy in its detection methods, samples must be tested by HPLC on ongoing basis. 100 samples or more will provide enough information to improve an NIR software’s accuracy if it is programmed by the manufacturer or user using chemometrics. Chemometrics sorts through the often complex and broad overlapping NIR absorption.

Bands from the chemical, physical, and structural properties of all species present in a sample that influences the measured spectra. Any variation however of a strain tested or water quantity observed can affect the received results. Consistency is the key to obtaining precision with NIR equipment programming. The downfall of the NIR technique is that it must constantly be compared to HPLC data to ensure accuracy.

At Eurofins Experchem , our company works with bothHPLC and NIR equipment simultaneously for different cannabis testing purposes. Running both equipment simultaneously means we are able to continually monitor the accuracy of our NIR equipment as compared to our HPLC. If a company is using NIR alone however, it can be more difficult to maintain the equipment’s accuracy without on-going monitoring.

What about Terpenes?

Terpenes are the primary aromatic constituents of cannabis resin and essential oils. Terpene compounds vary in type and concentration among different genetic lineages of cannabis and have been shown to modulate and modify the therapeutic and psychoactive effects of cannabinoids. Terpenes can be analyzed using different methods including separation by GC or HPLC and identification by Mass Spectrometry. The high-heat environment for GC analysis can again cause problems in accuracy and interpretation of results for terpenes; high-heat environments can degrade terpenes and make them difficult to find in accurate form. We find HPLC is the best instrument to test for terpenes and can now test for six of the key terpene profiles including a-Pinene, Caryophyllene, Limonene, Myrcene, B-Pinene and Terpineol.

Quality Systems

Quality systems between different labs are never one and the same. Some labs are testing cannabis under good manufacturing practices (GMP), others follow ISO accreditation and some labs have no accreditation at all.

From a quality systems’ perspective some labs have zero or only one quality system employee(s). In a GMP lab, to meet the requirements of Health Canada and the FDA, our operations are staffed in a 1:4 quality assurance to analyst ratio. GMP labs have stringent quality standards that set them apart from other labs testing cannabis. Quality standards we work with include, but are not limited to: monthly internal blind audits, extensive GMP training, yearly exams and ongoing tests demonstrating competencies.

Maintaining and adhering to strict quality standards necessary for a Drug Establishment License for pharmaceutical testing ensures accuracy of results in cannabis testing otherwise difficult to find in the testing marketplace.

Important things to know about testing

  1. HPLC is the most recommended instrument used for product release in a regulated environment.
  2. NIR is the best instrument to use for monitoring growth and curing processes for R&D purposes, only if validated with an HPLC on an ongoing basis.
  3. Quality Systems between labs are different. Regardless of instrumentation used, if quality systems are not in place and maintained, integrity of results may be compromised.
  4. GMPs comprise 25% of our labour costs to our quality department. Quality systems necessary for a GMP environment include internal audits, out of specification investigations, qualification and maintenance of instruments, systems controls and stringent data integrity standards.
amandarigdon
The Nerd Perspective

‘Instant’ Cannabis Potency Testing: Different Approaches from Different Manufacturers

By Amanda Rigdon
5 Comments
amandarigdon

This is the first piece of a regular column that CIJ has been so kind to allow me to write for their publication. Some readers might recognize my name from The Practical Chemist column in this publication. Since the inception of that column, I’ve finally taken the plunge into the cannabis industry as chief technical officer of Emerald Scientific. Unlike The Practical Chemist, I will not spend the entire first article introducing the column. The concept is simple: while I find the textbook-esque content of The Practical Chemist scintillating, I have a feeling that the content is a little too heavy to spring on someone who is looking for engaging articles over their precious coffee break. Instead, The Nerd Perspective will consist of less-technical writing focusing on my experience and insights for the cannabis industry as a whole. But don’t worry – I’m sure I will not be able to refrain from technical jargon altogether.

To kick off the column, I want to talk about instrumentation for ‘instant’ cannabis potency testing. At this point, it’s common knowledge in the cannabis analytics industry that the most accurate way to test cannabis potency is through extraction then analysis by HPLC-UV. I agree wholeheartedly with that sentiment, but HPLC analyses have one drawback: they can be either inexpensive or fast – not both. There are some instruments entering the market now that– while not as directly quantitative as HPLC-UV – promise to solve the inexpensive/fast conundrum. During my most recent trip to California, I was able to spend some quality time with two well-known instrument manufacturers: SRI Instruments and PerkinElmer, both of whom manufacture instruments that perform fast, inexpensive cannabis potency analyses. From my previous home at the heights of The Ivory Tower of Chromatography: Home of the Application Chemists, SRI and PE couldn’t be more different. But as seen through the eyes of a company who deals with a wide range of customers and analytical needs, it turns out that SRI and PE are much the same – not only in their open and honest support of the cannabis industry, but also in terms of their love of all things technical.

My first stop was SRI Instruments. They are a relatively small company located in an unassuming building in Torrance, CA. Only a few people work in that location, and I spent my time with Hugh Goldsmith (chief executive officer) and Greg Benedict (tech service guru). I have worked with these guys for a few years now, and since the beginning, I have lovingly referred to them as the MacGyvers of chromatography. Anyone familiar with SRI GCs knows that what they lack in aesthetics, they make up for in practicality – these instruments truly reflect Hugh and Greg’s character (that’s meant as a compliment).

SRI specializes in relatively inexpensive portable and semi-portable instruments that are easy to set up, easy to operate, and most importantly – engineered for a purpose. It’s actually really hard to manufacture an instrument that meets all three of these criteria, and the folks at SRI accomplish this with their passionate and unique approach to problem solving. What I love about these guys is that for them, nothing is impossible. Here’s an example: the price of the portable GC-FID instruments SRI builds is inflated because the instruments require separate – and pricey – hydrogen generators. That’s a big problem – hydrogen generators are all pretty much the same, and none of them are cheap. This didn’t faze SRI: they just decided to design their own super small on-board hydrogen generator capable of supplying hydrogen to a simple GC macgyversystem for six hours with just 20mL of distilled water from the grocery store! I’m not kidding – I saw it in action on their new Model 420 GC (more on that in some future pieces). Was the final product pretty? Not in the least. Did it work? Absolutely. This kind of MacGyver-esque problem solving can only be done successfully with a deep understanding of the core principles behind the problem. What’s more, in order to engineer instruments like these, SRI has to have mastery over the core principles of not only chromatographic separation, but also of software development, electrical engineering, and mechanical engineering – just to name a few. These quirky, unassuming guys are smart. SRI is a company that’s been unapologetically true to themselves for decades; they’ll never be a contender for beauty queen, but they get the job done.

On the surface, PerkinElmer (PE) contrasts with SRI in almost every way possible. With revenue measured in billions of dollars and employees numbering in the thousands, PE is a behemoth that plays not only in the analytical chemistry industry but also in clinical diagnostics and other large industries. Where SRI instruments have a characteristic look of familiar homeliness, PE instruments are sleek and sexy. However, PerkinElmer and SRI are more alike than it would seem; just like the no-frills SRI, the hyper-technical PE instruments are engineered for a purpose by teams of very smart, passionate people.

DoogieWith its modest price tag and manual sample introduction, the SRI Model 420 is engineered for lower throughput users to be a fast, simple, and inexpensive approach to semi-quantitative process control. The purpose of the instruments manufactured by PE is to produce the highest-quality quantitative results as quickly as possible for high-throughput labs. PE instruments are built using the best technology available in order to eke out every last ounce of quantitative accuracy and throughput possible. Fancy technology is rarely inexpensive, and neither is rigorous product development that can last years in some cases. In a way, PE is Doogie Howser to SRI’s MacGyver. Like MacGyver, Doogie is super smart, and his setting is a sterile hospital rather than a warzone.

I had a wonderful conversation with Tim Ruppel, PE’s headspace-GC specialist, on the sample introduction technology incorporated into the TurboMatrix Headspace Sampler, where I also learned that the basic technology for all PerkinElmer headspace-GC instruments was designed by the men who wrote The Book on headspace gas chromatography: Bruno Kolb and Leslie Ettre**. Later, I was able to get a much-needed lesson on FT-IR and the Spectrum Two IR Spectrometer from Brian Smith, PE’s spectroscopy expert, who actually wrote the book on quantitative spectroscopy***. Tim and Brian’s excitement over their technology mirrored that of Hugh and Greg. It turns out that SRI and PerkinElmer are more alike than I thought.

These two instrument manufacturers have addressed the fast/inexpensive conundrum of cannabis potency testing in two different ways: SRI’s instrument is extremely inexpensive, easy to operate, and will provide semi-quantitative values for THC, CBD, and CBN in just a few minutes; PE’s instrument is more expensive up front, but provides quantitative (though not directly quantitative) values for all of the major cannabinoids almost instantly, and requires almost no maintenance or consumables. These two instruments were designed for specific uses: one for inexpensive, easy use, and the other for more comprehensive results with a higher initial investment. The question consumers have to ask themselves is “Who do I need to solve my problem?” For some, the answer will be MacGyver, and for others, Doogie Howser will provide the solution – after all, both are heroes.


** B. Kolb, L. Ettre, Static Headspace-Gas Chromatography: Theory and Practice, John Wiley & Sons, Hoboken, NJ, 2006.

*** Brian C. Smith, Quantitative Spectroscopy: Theory and Practice, Elsevier, Boston, MA, 2002.