Tag Archives: mass spectrometry

Multi-Element Analysis Using ICP-MS: A Look at Heavy Metals Testing

By Cannabis Industry Journal Staff
No Comments

Across the country and across the world, governments that legalize cannabis implement increasingly rigorous requirements for laboratory testing. Helping to protect patients and consumers from contaminants, these requirements involve a slew of lab tests, including quantifying the levels of microbial contaminants, pathogens, mold and heavy metals.

Cannabis and hemp have a unique ability to accumulate elements found in soil, which is why these plants can be used as effective tools for bioremediation. Because cannabis plants have the ability to absorb potentially toxic and dangerous elements found in the soil they grow in, lab testing regulations often include the requirement for heavy metals testing, such as Cadmium, Lead, Mercury, Arsenic and others.

In addition to legal cannabis markets across the country, the USDA announced the establishment of the U.S. Domestic Hemp Production Program, following the enactment of the 2018 Farm Bill, essentially legalizing hemp. This announcement comes with information for hemp testing labs, including testing and sampling guidelines. While the information available on the USDA’s website only touches on testing for THC, required to be no greater than 0.3% dry weight concentration, more testing guidelines in the future are sure to include a discussion of heavy metals testing.

Table 1. ICP-MS operating conditions (shaded parameters were automatically optimized during start up for the HMI conditions).

In an application note produced by Agilent Technologies, Inc., the Agilent 7800 ICP-MS was used to analyze 25 elements in a variety of cannabis and hemp-derived products. The study was conducted using that Agilent 7800 ICP-MS, which includes Agilent’s proprietary High Matrix Introduction (HMI) system. The analysis was automated  by using the Agilent SPS 4 autosampler.

Instrumentation

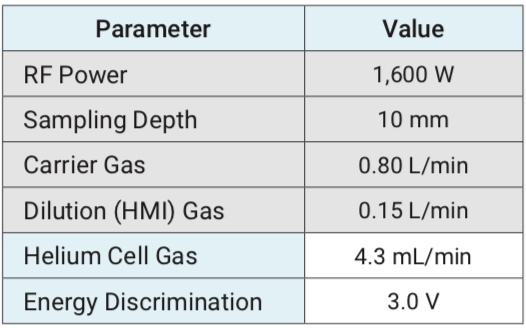
The instrument operating conditions can be found in Table 1. In this study, the HMI dilution factor was 4x and the analytes were all acquired in the Helium collision mode. Using this methodology, the Helium collision mode consistently reduces or completely eliminates all common polyatomic interferences using kinetic energy discrimination (KED).

Table 2. Parameters for microwave digestion.

As a comparison, Arsenic and Selenium were also acquired via the MassHunter Software using half-mass correction, which corrects for overlaps due to doubly charged rare earth elements. This software also collects semiquantitative or screening data across the entire mass region, called Quick Scan, showing data for elements that may not be present in the original calibration standards.

SRMs and Samples

Standard reference materials (SRMs) analyzed from the National Institute of Standards and Technology (NIST) were used to verify the sample prep digestion process. Those included NIST 1547 Peach Leaves, NIST 1573a Tomato Leaves and NIST 1575 Pine Needles. NIST 1640a Natural Water was also used to verify the calibration.

Figure 1. Calibration curves for As, Cd, Pb, and Hg.

Samples used in the study include cannabis flower, cannabis tablets, a cannabidiol (CBD) tincture, chewable candies and hemp-derived cream.

Sample Preparation

Calibration standards were prepared using a mix of 1% HNO3 and 0.5% HCl. Sodium, Magnesium, Potassium, Calcium and Iron were calibrated from 0.5 to 10 ppm. Mercury was calibrated from 0.05 to 2 ppb. All the other elements were calibrated from 0.5 to 100 ppb.

Table 3. Calibration summary data acquired in He mode. Data for As and Se in shaded cells was obtained using half mass correction tuning.

After weighing the samples (roughly 0.15 g of cannabis plant and between 0.3 to 0.5 g of cannabis product) into quartz vessels, 4 mL HNO3 and 1 mL HCl were added and the samples were microwave digested using the program found in Table 2.

HCI was included to ensure the stability of Mercury and Silver in solution. They diluted the digested samples in the same acid mix as the standards. SRMs were prepared using the same method to verify sample digestion and to confirm the recovery of analytes.

Four samples were prepared in triplicate and fortified with the Agilent Environmental Mix Spike solution prior to the analysis. All samples, spikes and SRMs were diluted 5x before testing to reduce the acid concentration.

Calibration

Table 4. ICV and CCV recovery tests. Data for As and Se in shaded cells was obtained using half mass correction tuning.

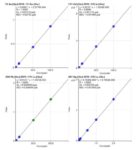
The calibration curves for Arsenic, Cadmium, Lead and Mercury can be found in Figure 1 and a summary of the calibration data is in Table 3. For quality control, the SRM NIST 1645a Natural Water was used for the initial calibration verification standard.  Recoveries found in Table 4 are for all the certified elements present in SRM NIST 1640a. The mean recoveries and concentration range can also be found in Table 4. All the continuing calibration solution recoveries were within 10% of the expected value.

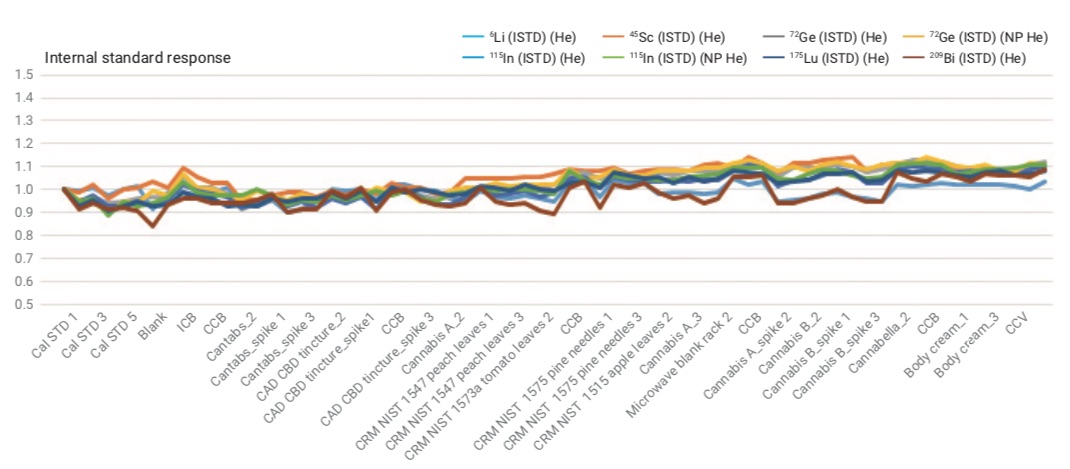
Internal Standard Stability

Figure 2 highlights the ISTD signal stability for the sequence of 58 samples analyzed over roughly four hours. The recoveries for all samples were well within 20 % of the value in the initial calibration standard.

Figure 2. Internal standard signal stability for the sequence of 58 samples analyzed over ~four hours.

Results

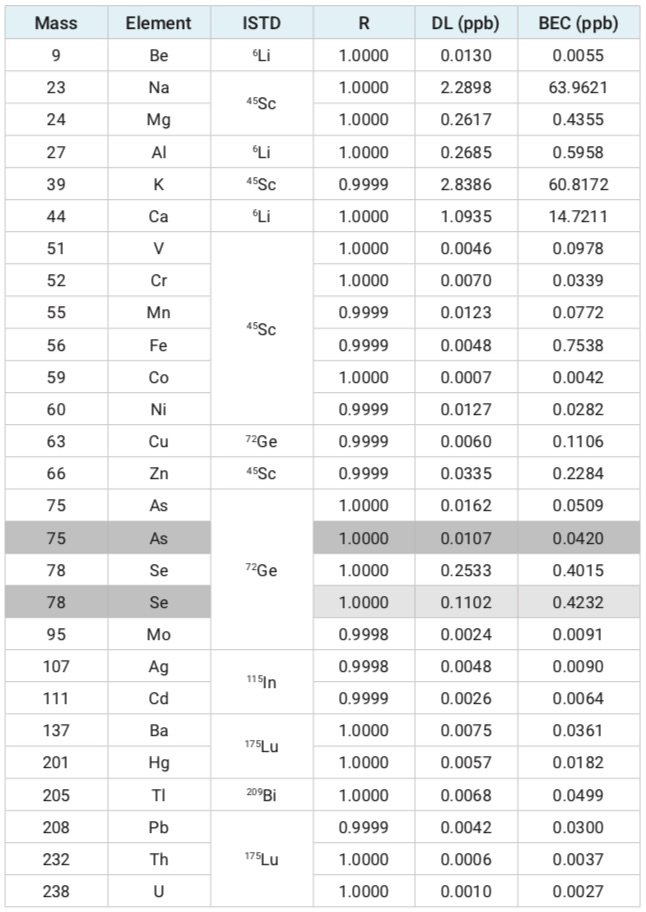
In Table 5, you’ll find that three SRMs were tested to verify the digestion process. The mean results for most elements agreed with the certified concentrations, however the results for Arsenic in NIST 1547 and Selenium in both NIST 1547 and 1573a did not show good agreement due to interreferences formed from the presence of doubly-charged ions

Table 5. Mean concentrations (ppm) of three repeat measurements of three SRMs, including certified element concentrations, where appropriate, and % recovery.

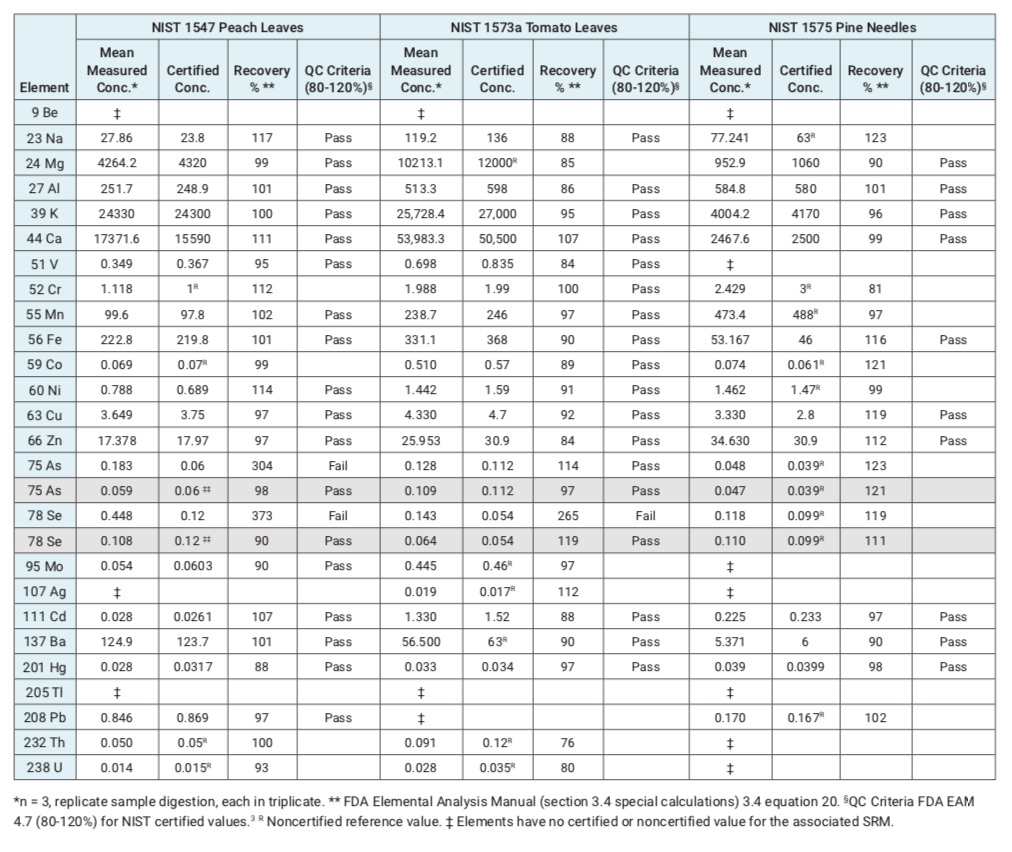
Some plant materials can contain high levels of rare earth elements, which have low second ionization potentials, so they tend to form doubly-charged ions. As the quadrupole Mass Spec separates ions based on their mass-to-charge ratio, the doubly-charged ions appear at half of their true mass. Because of that, a handful of those doubly-charged ions caused overlaps leading to bias in the results for Arsenic and Selenium in samples that have high levels of rare earth elements. Using half mass correction, the ICP-MS corrects for these interferences, which can be automatically set up in the MassHunter software. The shaded cells in Table 5 highlight the half mass corrected results for Arsenic and Selenium, demonstrating recoveries in agreement with the certified concentrations.

In Table 6, you’ll find the quantitative results for cannabis tablets and the CBD tincture. Although the concentrations of Arsenic, Cadmium, Lead and Cobalt are well below current regulations’ maximum levels, they do show up relatively high in the cannabis tablets sample. Both Lead and Cadmium also had notably higher levels in the CBD tincture as well.

Table 6. Quantitative data for two cannabis-related products and two cannabis samples plus mean spike recovery results. All units ppb apart from major elements, which are reported as ppm.

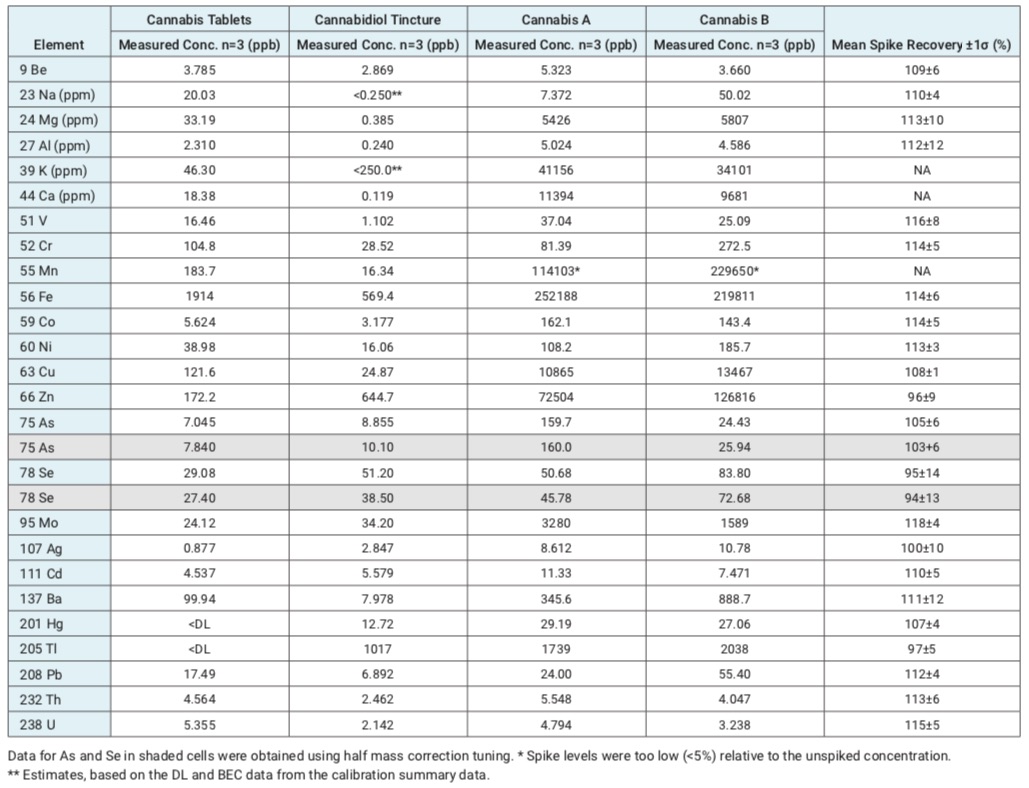
A spike recovery test was utilized to check the accuracy of the method for sample analysis. The spike results are in Table 6.

Using the 7800 ICP-MS instrument and the High Matrix Introduction system, labs can routinely analyze samples that contain high and very variable matrix levels. Using the automated HMI system, labs can reduce the need to manually handle samples, which can reduce the potential for contamination during sample prep. The MassHunter Quick Scan function shows a complete analysis of the heavy metals in the sample, including data reported for elements not included in the calibration standards.

The half mass correction for Arsenic and Selenium allows a lab to accurately determine the correct concentrations. The study showed the validity of the microwave sample prep method with good recovery results for the SRMs. Using the Agilent 7800 ICP-MS in a cannabis or hemp testing lab can be an effective and efficient way to test cannabis products for heavy metals. This test can be used in various stages of the supply chain as a tool for quality controls in the cannabis and hemp markets.


Disclaimer: Agilent products and solutions are intended to be used for cannabis quality control and safety testing in laboratories where such use is permitted under state/country law.

Analytical Instruments You Need to Start a Cannabis Testing Laboratory

By Bob Clifford
8 Comments

The cannabis industry is growing exponentially, and the use of cannabis for medical purposes is being adopted across the nation. With this boom in cannabis consumers, there has been an increasing need for knowledge about the product.

The role of testing labs has become crucial to the process, which makes owning and operating a lab more lucrative. Scientists testing for potency, heavy metals, pesticides, residual solvents, moisture, terpene profile, microbial and fungal growth, and mycotoxins/aflatoxins are able to make meaningful contributions to the medical industry by making sure products are safe, while simultaneously generating profits and a return on investment.

Here are the key testing instruments you need to conduct these critical analyses. Note that cannabis analytical testing requirements may vary by state, so be sure to check the regulations applicable to the location of your laboratory.

Potency Testing

High-performance liquid chromatograph (HPLC) designed for quantitative determination of cannabinoid content.

The most important component of cannabis testing is the analysis of cannabinoid profiles, also known as potency. Cannabis plants naturally produce cannabinoids that determine the overall effect and strength of the cultivar, which is also referred to as the strain. There are many different cannabinoids that all have distinct medicinal effects. However, most states only require testing and reporting for the dry weight percentages of delta-9-tetrahydrocannabinol (Δ9-THC) and cannabidiol (CBD). It should be noted that delta-9-tetrahydrocannabinolic acid (Δ9-THCA) can be converted to THC through oxidation with heat or light.

For potency testing, traditional high-performance liquid chromatography (HPLC) is recommended and has become the gold standard for analyzing cannabinoid profiles. Look for a turnkey HPLC analyzer that delivers a comprehensive package that integrates instrument hardware, software, consumables and proven HPLC methods.

Heavy Metal Testing

ICP-MS instrument for detecting heavy metals in cannabis.

Different types of metals can be found in soils and fertilizers, and as cannabis plants grow, they tend to draw in these metals from the soil. Heavy metals are a group of metals considered to be toxic, and the most common include lead, cadmium, arsenic and mercury. Most labs are required to test and confirm that samples are under the allowable toxic concentration limits for these four hazardous metals.

Heavy metal testing is performed by inductively coupled plasma mass spectrometry (ICP-MS). ICP-MS uses the different masses of each element to determine which elements are present within a sample and at what concentrations. Make sure to include accompanying software that provides assistant functions to simplify analysis by developing analytical methods and automatically diagnosing spectral interference. This will provide easy operation and analytical results with exceptionally high reliability.

To reduce running costs, look for a supporting hardware system that reduces the consumption of argon gas and electricity. For example, use a plasma ignition sequence that is optimized for lower-purity argon gas (i.e., 99.9% argon as opposed to more expensive 99.9999%).

Pesticide Testing

The detection of pesticides in cannabis can be a challenge. There are many pesticides that are used in commercial cannabis grow operations to kill the pests that thrive on the plants and in greenhouses. These chemicals are toxic to humans, so confirming their absence from cannabis products is crucial. The number of pesticides that must be tested for varies from state to state, with Colorado requiring only 13 pesticides, whereas Oregon and California require 59 and 66 respectively. Canada has taken it a step further and must test for 96 pesticides, while AOAC International is developing methods for testing for 104 pesticides. The list of pesticides will continue to evolve as the industry evolves.

Testing for pesticides is one of the more problematic analyses, possibly resulting in the need for two different instruments depending on the state’s requirements. For a majority of pesticides, liquid chromatography mass spectrometry (LCMS) is acceptable and operates much like HPLC but utilizes a different detector and sample preparation.

With excellent sensitivity and ultra-low detection limits, LC-MS/MS is an ideal technique for the analysis of pesticides.

Pesticides that do not ionize well in an LCMS source require the use of a gas chromatography mass spectrometry (GCMS) instrument. The principles of HPLC still apply – you inject a sample, separate it on a column and detect with a detector. However, in this case, a gas (typically helium) is used to carry the sample.

Look for a LC-MS/MS system or HPLC system with a triple quadrupole mass spectrometer that provides ultra-low detection limits, high sensitivity and efficient throughput. Advanced systems can analyze more than 200 pesticides in 12 minutes.

For GCMS analysis, consider an instrument that utilizes a triple quadrupole mass spectrometer to help maximize the capabilities of your laboratory. Select an instrument that is designed with enhanced functionality, analysis software, databases and a sample introduction system. Also include a headspace autosampler, which can also be used for terpene profiles and residual solvent testing.

Residual Solvent Testing

Residual solvents are chemicals left over from the process of extracting cannabinoids and terpenes from the cannabis plant. Common solvents for such extractions include ethanol, butane, propane and hexane. These solvents are evaporated to prepare high-concentration oils and waxes. However, it is sometimes necessary to use large quantities of solvent in order to increase extraction efficiency and to achieve higher levels of purity. Since these solvents are not safe for human consumption, most states require labs to verify that all traces of the substances have been removed.

Testing for residual solvents requires gas chromatography (GC). For this process, a small amount of extract is put into a vial and heated to mimic the natural evaporation process. The amount of solvent that is evaporated from the sample and into the air is referred to as the “headspace.” The headspace is then extracted with a syringe and placed in the injection port of the GC. This technique is called full-evaporated technique (FET) and utilizes the headspace autosampler for the GC.

Look for a GCMS instrument with a headspace autosampler, which can also be used for pesticide and terpene analysis.

Terpene Profile Testing

Terpenes are produced in the trichomes of the cannabis leaves, where THC is created, and are common constituents of the plant’s distinctive flavor and aroma. Terpenes also act as essential medicinal hydrocarbon building blocks, influencing the overall homeopathic and therapeutic effect of the product. The characterization of terpenes and their synergistic effect with cannabinoids are key for identifying the correct cannabis treatment plan for patients with pain, anxiety, epilepsy, depression, cancer and other illnesses. This test is not required by most states, but it is recommended.

The instrumentation that is used for analyzing terpene profiles is a GCMS with headspace autosampler with an appropriate spectral library. Since residual solvent testing is an analysis required by most states, all of the instrumentation required for terpene profiling will already be in your lab.

As with residual solvent testing, look for a GCMS instrument with a headspace autosampler (see above). 

Microbe, Fungus and Mycotoxin Testing

Most states mandate that cannabis testing labs analyze samples for any fungal or microbial growth resulting from production or handling, as well as for mycotoxins, which are toxins produced by fungi. With the potential to become lethal, continuous exposure to mycotoxins can lead to a buildup of progressively worse allergic reactions.

LCMS should be used to qualify and identify strains of mycotoxins. However, determining the amount of microorganisms present is another challenge. That testing can be done using enzyme linked immunosorbent assay (ELISA), quantitative polymerase chain reaction (qPCR) or matrix-assisted laser desorption/ionization time-of-flight mass spectrometry (MALDI-TOF MS), with each having their advantages and disadvantages.

For mycotoxin analysis, select a high-sensitivity LC-MS/MS instrument. In addition to standard LC, using an MS/MS selective detector enables labs to obtain limits of detection up to 1000 times greater than conventional LC-UV instruments.

For qPCR and its associated needs, look for a real-time PCR amplification system that combines thermal cyclers with optical reaction modules for singleplex and multiplex detection of fluorophores. These real-time PCR detection systems range from economical two-target detection to sophisticated five-target or more detection systems. The real-time detection platform should offer reliable gradient-enabled thermal cyclers for rapid assay optimization. Accompanying software built to work with the system simplifies plate setup, data collection, data analysis and data visualization of real-time PCR results.

Moisture Content and Water Activity Testing

Moisture content testing is required in some states. Moisture can be extremely detrimental to the quality of stored cannabis products. Dried cannabis typically has a moisture content of 5% to 12%. A moisture content above 12% in dried cannabis is prone to fungal growth (mold). As medical users may be immune deficient and vulnerable to the effects of mold, constant monitoring of moisture is needed. Below a 5% moisture content, the cannabis will turn to a dust-like texture.

The best way to analyze the moisture content of any product is using the thermogravimetric method with a moisture balance instrument. This process involves placing the sample of cannabis into the sample chamber and taking an initial reading. Then the moisture balance instrument heats up until all the moisture has been evaporated out of the sample. A final reading is then taken to determine the percent weight of moisture that was contained in the original sample.

A moisture balance can provide accurate determination of moisture content in cannabis.

Look for a moisture balance that offers intuitive operation and quick, accurate determination of moisture content. The pan should be spacious enough to allow large samples to be spread thinly. The halogen heater and reflector plate should combine to enable precise, uniform heating. Advanced features can include preset, modifiable measurement modes like automated ending, timed ending, rapid drying, slow drying and step drying.

Another method for preventing mold is monitoring water activity (aW). Very simply, moisture content is the total amount of water available, while water activity is the “free water” that could produce mold. Water activityranges from 0 to 1. Pure water would have an aW of 1.0. ASTM methods D8196-18 and D8297-18 are methods for monitoring water activity in dry cannabis flower. The aW range recommended for storage is 0.55 to 0.65. Some states recommend moisture content to be monitored, other states monitor water activity, and some states such as California recommend monitoring both.

Final Thoughts

As you can see, cannabis growers benefit tremendously from cannabis testing. Whether meeting state requirements or certifying a product, laboratory testing reduces growers’ risk and ensures delivery of a quality product. As medicinal and recreational cannabis markets continue to grow, analytical testing will ensure that consumers are receiving accurately

labeled products that are free from contamination. That’s why it is important to invest in the future of your cannabis testing lab by selecting the right analytical equipment at the start of your venture.

Agilent Partners with LSSU on Cannabis Chemistry & Research

By Aaron G. Biros
No Comments

Back in August, Lake Superior State University (LSSU) announced the formation of a strategic partnership with Agilent Technologies to “facilitate education and research in cannabis chemistry and analysis.” The university formed the LSSU Cannabis Center of Excellence (CoE), which is sponsored by Agilent. The facility, powered by top-of-the-line Agilent instrumentation, is designed for research and education in cannabis science, according to a press release.

Chemistry student, Justin Blalock, calibrates an Agilent 1290 Ultra-High Pressure Liquid Chromatograph with a 6470 Tandem Mass Spectrometer in the new LSSU Cannabis Center of Excellence, Sponsored by Agilent.

The LSSU Cannabis CoE will help train undergraduate students in the field of cannabis science and analytical chemistry. “The focus of the new LSSU Cannabis CoE will be training undergraduate students as job-ready chemists, experienced in multi-million-dollar instrumentation and modern techniques,” reads the press release. “Students will be using Agilent’s preeminent scientific instruments in their coursework and in faculty-mentored undergraduate research.”

The facility has over $2 million dollars of Agilent instruments including their UHPLC-MS/MS, UHPLC-TOF, GC-MS/MS, LC-DAD, GC/MS, GC-FID/ECD, ICP-MS and MP-AES. Those instruments are housed in a 2600 square-foot facility in the Crawford Hall of Science. In February earlier this year, LSSU launched the very first program for undergraduate students focused completely on cannabis chemistry. With the new facility and all the technology that comes with it, they hope to develop a leading training center for chemists in the cannabis space.

Dr. Steve Johnson, Dean of the College of Science and the Environment at LSSU, says making this kind of instrumentation available to undergraduate studies is a game changer. “The LSSU Cannabis Center of Excellence, Sponsored by Agilent was created to provide a platform for our students to be at the forefront of the cannabis analytics industry,” says Dr. Johnson. “The instrumentation available is rarely paralleled at other undergraduate institutions. The focus of the cannabis program is to provide our graduates with the analytical skills necessary to move successfully into the cannabis industry.”

Storm Shriver is the Laboratory Director at Unitech Laboratories, a cannabis testing lab in Michigan, and sounds eager to work with students in the program. “I was very excited to learn about your degree offerings as there is a definite shortage of chemists who have experience with data analysis and operation of the analytical equipment required for the analysis of cannabis,” says Shriver. “I am running into this now as I begin hiring and scouting for qualified individuals. I am definitely interested in a summer internship program with my laboratory.”

LSSU hopes the new facility and program will help lead the way for more innovation in cannabis science and research. For more information, visit LSSU.edu.

PerkinElmer Awarded Five Emerald Test Badges

By Aaron G. Biros
1 Comment

According to a press release published today, Emerald Scientific awarded PerkinElmer five badges for The Emerald Test, a bi-annual Inter-Laboratory Comparison and Proficiency Test (ILC/PT) program. Awarding the badges for Perkin Elmer’s instruments and testing methods affirms their ability to accurately detect pesticides, heavy metals, residual solvents, terpenes and potency in cannabis.

According to Greg Sears, vice president and general manager of Food, Chromatography & Mass Spectrometry, Discovery & Analytical Solutions at PerkinElmer, they are the only instrument manufacturer to receive all five accolades. “To date, PerkinElmer is the only solutions provider to successfully complete these five Emerald Scientific proficiency tests,” says Sears. “The badges underscore our instruments’ ability to help cannabis labs meet the highest standards available in the industry and effectively address their biggest pain point: Navigating diverse regulations without compromising turnaround time.”

The instruments used were PerkinElmer’s QSight 220 and 420 Triple Quad systems, which are originally designed for accurate and fast detection/identification of “pesticides, mycotoxins and emerging contaminants in complex food, cannabis and environmental samples,” reads the press release. They also used their ICP-MS, GC/MS and HPLC systems for the badges.

PerkinElmer says they developed a single LC/MS/MS method using their QSight Triple Quad systems, which helps labs test for pesticides and mycotoxins under strict regulations in states like California and Oregon. They performed studies that also confirm their instruments can help meet Canada’s testing requirements, which set action limits nearly 10 times lower than California, according to the press release.

Heavy Metals Testing: Methods, Strategies & Sampling

By Charles Deibel
3 Comments

Editor’s Note: The following is based on research and studies performed in their Santa Cruz Lab, with contributions from Mikhail Gadomski, Lab Manager, Ryan Maus Technical Services Analyst, Laurie Post, Director of Food Safety & Compliance, and Charles Deibel, President Deibel Cannabis Labs.


Heavy metals are common environmental contaminants resulting from human industrial activities such as mining operations, industrial waste, automotive emissions, coal fired power plants and farm/house hold water run-off. They affect the water and soil, and become concentrated in plants, animals, pesticides and the sediments used to make fertilizers. They can also be present in low quality glass or plastic packaging materials that can leach into the final cannabis product upon contact. The inputs used by cultivators that can be contaminated with heavy metals include fertilizers, growing media, air, water and even the clone/plant itself.

The four heavy metals tested in the cannabis industry are lead, arsenic, mercury and cadmium. The California Bureau of Cannabis Control (BCC) mandates heavy metals testing for all three categories of cannabis products (inhalable cannabis, inhalable cannabis products and other cannabis and cannabis products) starting December 31, 2018. On an ongoing basis, we recommend cultivators test for the regulated heavy metals in R&D samples any time there are changes in a growing process including changes to growing media, cannabis strains, a water system or source, packaging materials and fertilizers or pesticides. Cultivators should test the soil, nutrient medium, water and any new clones or plants for heavy metals. Pre-qualifying a new packaging material supplier or a water source prior to use is a proactive approach that could bypass issues with finished product.

Testing Strategies

The best approach to heavy metal detection is the use of an instrument called an Inductively Coupled Plasma Mass Spectrometry (ICP-MS). There are many other instruments that can test for heavy metals, but in order to achieve the very low detection limits imposed by most states including California, the detector must be the ICP-MS. Prior to detection using ICP-MS, cannabis and cannabis related products go through a sample preparation stage consisting of some form of digestion to completely break down the complex matrix and extract the heavy metals for analysis. This two-step process is relatively fast and can be done in a single day, however, the instruments used to perform the digestion are usually the limiting step as the digesters run in a batch of 8-16 samples over a 2-hour period.

Only trace amounts of heavy metals are allowed by California’s BCC in cannabis and cannabis products. A highly sensitive detection system finds these trace amounts and also allows troubleshooting when a product is found to be out of specification.

For example, during the course of testing, we have seen lead levels exceed the BCC’s allowable limit of 0.5 ppm in resin from plastic vape cartridges. An investigation determined that the plastic used to make the vape cartridge was the source of the excessive lead levels. Even if a concentrate passes the limits at the time of sampling, the concern is that over time, the lead leached from the plastic into the resin, increasing the concentration of heavy metals to unsafe levels.

Getting a Representative Sample

The ability to detect trace levels of heavy metals is based on the sample size and how well the sample represents the entire batch. The current California recommended amount of sample is 1 gram of product per batch.  Batch sizes can vary but cannot be larger than 50 pounds of flower. There is no upper limit to the batch sizes for other inhalable cannabis products (Category II).

It is entirely likely that two different 1 gram samples of flower can have two different results for heavy metals because of how small a sample is collected compared to an entire batch. In addition, has the entire plant evenly collected and concentrated the heavy metals into every square inch of it’s leaves? No, probably not. In fact, preliminary research in leafy greens shows that heavy metals are not evenly distributed in a plant. Results from soil testing can also be inconsistent due to clumping or granularity. Heavy metals are not equally distributed within a lot of soil and the one small sample that is taken may not represent the entire batch. That is why it is imperative to take a “random” sample by collecting several smaller samples from different areas of the entire batch, combining them, and taking a 1 g sample from this composite for analysis.


References

California Cannabis CPA. 12/18/2018.  “What to Know About California’s Cannabis Testing Requirements”. https://www.californiacannabiscpa.com/blog/what-to-know-about-californias-cannabis-testing-requirements. Accessed January 10, 2019.

Citterio, S., A. Santagostino, P. Fumagalli, N. Prato, P. Ranalli and S. Sgorbati. 2003.  Heavy metal tolerance and accumulation of Cd, Cr and Ni by Cannabis sativa L.. Plant and Soil 256: 243–252.

Handwerk, B. 2015.  “Modern Marijuana Is Often Laced With Heavy Metals and Fungus.” Smithsonian.com. https://www.smithsonianmag.com/science-nature/modern-marijuana-more-potent-often-laced-heavy-metals-and-fungus-180954696/

Linger, P.  J. Mussig, H. Fischer, J. Kobert. 2002.  Industrial hemp (Cannabis sativa L.) growing on heavy metal contaminated soil: fibre quality and phytoremediation potential. Ind. Crops Prod. 11, 73–84.

McPartland, J. and K. J McKernan. 2017.  “Contaminants of Concern in Cannabis: Microbes, Heavy Metals and Pesticides”.  In: S. Chandra et al. (Eds.) Cannabis sativa L. – Botany and Biotechnology.  Springer International Publishing AG. P. 466-467.  https://www.researchgate.net/publication/318020615_Contaminants_of_Concern_in_Cannabis_Microbes_Heavy_Metals_and_Pesticides.  Accessed January 10, 2019.

Sidhu, G.P.S.  2016.  Heavy metal toxicity in soils: sources, remediation technologies and challenges.   Adv Plants AgricRes. 5(1):445‒446.

oregon

Turning the Oregon Outdoor Market into a Research Opportunity

By Dr. Zacariah Hildenbrand, Dr. Kevin A. Schug
No Comments
oregon

Much has been made about the plummeting market value of cannabis grown outdoors in Oregon. This certainly isn’t a reflection of the product quality within the marketplace, but more closely attributable to the oversaturation of producers in this space. This phenomenon has similarities to that of ‘Tulip Mania’ within the Dutch Golden Age, whereby tulip bulbs were highly coveted assets one day, and almost worthless the next. During times like these, it is very easy for industry professionals to become disheartened; however, from a scientific perspective, this current era in Oregon represents a tremendous opportunity for discovery and fundamental research.

Dr. Zacariah Hildenbrand
Dr. Zacariah Hildenbrand, chief technical officer at Inform Environmental.

As we have mentioned in previous presentations and commentaries, our research group is interested in exploring the breadth of chemical constituents expressed in cannabis to discover novel molecules, to ultimately develop targeted therapies for a wide range of illnesses. Intrinsically, this research has significant societal implications, in addition to the potential financial benefits that can result from scientific discovery and the development of intellectual property. While conducting our experiments out of Arlington, Texas, where the study of cannabis is highly restricted, we have resorted to the closet genetic relative of cannabis, hops (Humulus lupulus), as a surrogate model of many of our experiments (Leghissa et al., 2018a). In doing so, we have developed a number of unique methods for the characterization of various cannabinoids and their metabolites (Leghissa et al., 2018b; Leghissa et al., 2018c). These experiments have been interesting and insightful; however, they pale in comparison to the research that could be done if we had unimpeded access to diverse strains of cannabis, as are present in Oregon. For example, gas chromatography-vacuum ultraviolet spectroscopy (GC-VUV) is a relatively new tool that has recently been proven to be an analytical powerhouse for the differentiation of various classes of terpene molecules (Qiu et al., 2017). In Arlington, TX, we have three such GC-VUV instruments at our disposal, more than any other research institution in the world, but we do not have access to appropriate samples for application of this technology. Similarly, on-line supercritical fluid extraction – supercritical fluid chromatography – mass spectrometry (SFE-SFC-MS) is another capability currently almost unique to our research group. Such an instrument exhibits extreme sensitivity, supports in situ extraction and analysis, and has a wide application range for potential determination of terpenes, cannabinoids, pesticides and other chemical compounds of interest on a single analytical platform. Efforts are needed to explore the power and use of this technology, but they are impeded based on current regulations.

Dr Kevin Schug
Dr. Kevin A. Schug, Professor and the Shimadzu Distinguished Professor of Analytical Chemistry in the Department of Chemistry and Biochemistry at The University of Texas at Arlington (UTA)

Circling back, let’s consider the opportunities that lie within the abundance of available outdoor-grown cannabis in Oregon. Cannabis is extremely responsive to environmental conditions (i.e., lighting, water quality, nutrients, exposure to pest, etc.) with respect to cannabinoid and terpene expression. As such, outdoor-grown cannabis, despite the reduced market value, is incredibly unique from indoor-grown cannabis in terms of the spectrum of light to which it is exposed. Indoor lighting technologies have come a long way; full-spectrum LED systems can closely emulate the spectral distribution of photon usage in plants, also known as the McCree curve. Nonetheless, this is emulation and nothing is ever quite like the real thing (i.e., the Sun). This is to say that indoor lighting can certainly produce highly potent cannabis, which exhibits an incredibly robust cannabinoid/terpene profile; however, one also has to imagine that such lighting technologies are still missing numerous spectral wavelengths that, in a nascent field of study, could be triggering the expression of unknown molecules with unknown physiological functions in the human body. Herein lies the opportunity. If we can tap into the inherently collaborative nature of the cannabis industry, we can start analyzing unique plants, having been grown in unique environments, using unique instruments in a facilitative setting, to ultimately discover the medicine of the future. Who is with us?


References

Leghissa A, Hildenbrand ZL, Foss FW, Schug KA. Determination of cannabinoids from a surrogate hops matrix using multiple reaction monitoring gas chromatography with triple quadrupole mass spectrometry. J Sep Sci 2018a; 41: 459-468.

Leghissa A, Hildenbrand ZL, Schug KA. Determination of the metabolites of Δ9-Tetrahydrocannabinol using multiple reaction monitoring gas chromatography – triple quadrapole – mass spectrometry. Separation Science Plus 2018b; 1: 43-47.

Leghissa A, Smuts J, Changling Q, Hildenbrand ZL, Schug KA. Detection of cannabinoids and cannabinoid metabolites using gas chromatography-vacuum ultraviolet spectroscopy. Separation Science Plus 2018c; 1: 37-42.

Qiu C, Smuts J, Schug KA. Analysis of terpenes and turpentines using gas chromatography with vacuum ultraviolet detection. J Sep Sci 2017; 40: 869-877.

Quality Assurance In The Field: Instruments For Growers & Processors

By Aaron G. Biros
2 Comments

As the cannabis marketplace evolves, so does the technology. Cultivators are scaling up their production and commercial-scale operations are focusing more on quality. That greater attention to detail is leading growers, extractors and infused product manufacturers to use analytical chemistry as a quality control tool.

Previously, using analytical instrumentation, like mass spectrometry (MS) or gas chromatography (GC), required experience in the laboratory or with chromatography, a degree in chemistry or a deep understanding of analytical chemistry. This leaves the testing component to those that are competent enough and scientifically capable to use these complex instruments, like laboratory personnel, and that is still the case. As recent as less than two years ago, we began seeing instrument manufacturers making marketing claims that their instrument requires no experience in chromatography.

Instrument manufacturers are now competing in a new market: the instrument designed for quality assurance in the field. These instruments are more compact, lighter and easier to use than their counterparts in the lab. While they are no replacement for an accredited laboratory, manufacturers promise these instruments can give growers an accurate estimate for cannabinoid percentages. Let’s take a look at a few of these instruments designed and marketed for quality assurance in the field, specifically for cannabis producers.

Ellutia GC 200 Series

Shamanics, a cannabis extractor in Amsterdam, uses Ellutia’s 200 series for QA testing

Ellutia is an instrument manufacturer from the UK. They design and produce a range of gas chromatographs, GC accessories, software and consumables, most of which are designed for use in a laboratory. Andrew James, marketing director at Ellutia, says their instrument targeting this segment was originally designed for educational purposes. “The GC is compact in size and lightweight in stature with a full range of detectors,” says James. “This means not only is it portable and easy to access but also easy to use, which is why it was initially intended for the education market.”

Andrew James, marketing director at Ellutia

That original design for use in teaching, James says, is why cannabis producers might find it so user-friendly. “It offers equivalent performance to other GC’s meaning we can easily replace other GC’s performing the same analysis, but our customers can benefit from the lower space requirement, reduced energy bills, service costs and initial capital outlay,” says James. “This ensures the lowest possible cost of ownership, decreasing the cost per analysis and increasing profits on every sample analyzed.”

Shamanics, a cannabis oil extraction company based in Amsterdam, uses Ellutia’s 200 series for quality assurance in their products. According to Bart Roelfsema, co-founder of Shamanics, they have experienced a range of improvements in monitoring quality since they started using the 200 series. “It is very liberating to actually see what you are doing,” says Roelfsema. “If you are a grower, a manufacturer or a seller, it is always reassuring to see what you have and prove or improve on your quality.” Although testing isn’t commonplace in the Netherlands quite yet, the consumer demand is rising for tested products. “We also conduct terpene analysis and cannabinoid acid analysis,” says Roelfsema. “This is a very important aspect of the GC as now it is possible to methylate the sample and test for acids; and the 200 Series is very accurate, which is a huge benefit.” Roelfsema says being able to judge quality product and then relay that information to retail is helping them grow their business and stay ahead of the curve.

908 Devices G908 GC-HPMS

908 Devices, headquartered in Boston, is making a big splash in this new market with their modular G908 GC-HPMS. The company says they are “democratizing chemical analysis by way of mass spectrometry,” with their G908 device. That is a bold claim, but rather appropriate, given that MS used to be reserved strictly for the lab environment. According to Graham Shelver, Ph.D., commercial leader for Applied Markets at 908 Devices Inc., their company is making GC-HPMS readily available to users wanting to test cannabis products, who do not need to be trained analytical chemists.

The G908 device.

Shelver says they have made the hardware modular, letting the user service the device themselves. This, accompanied by simplified software, means you don’t need a Ph.D. to use it. “The “analyzer in a box” design philosophy behind the G908 GC-HPMS and the accompanying JetStream software has been to make using the entire system as straightforward as possible so that routine tasks such as mass axis calibration are reduced to simple single actions and sample injection to results reporting becomes a single button software operation,” says Shelver.

He also says while it is designed for use in the field, laboratories also use it to meet higher-than-usual demand. Both RM3 Labs in Colorado, and ProVerde in Massachusetts, use G908. “RM3’s main goal with the G908 is increased throughput and ProVerde has found it useful in adding an orthogonal and very rapid technique (GC-HPMS) to their suite of cannabis testing instruments,” says Shelver.

Orange Photonics LightLab Cannabis Analyzer

Orange Photonics’ LightLab Cannabis Analyzer

Dylan Wilks, a third generation spectroscopist, launched Orange Photonics with his team to produce analytical tools that are easy to use and can make data accessible where it has been historically absent, such as onsite testing within the cannabis space. According to Stephanie McArdle, president of Orange Photonics, the LightLab Cannabis Analyzer is based on the same principles as HPLC technology, combining liquid chromatography with spectroscopy. Unlike an HPLC however, LightLab is rugged, portable and they claim you do not need to be a chemist to use it.

“LightLab was developed to deliver accurate repeatable results for six primary cannabinoids, D9THC, THC-A, CBD, CBD-A, CBG-A and CBN,” says McArdle. “The sample prep is straightforward: Prepare a homogenous, representative sample, place a measured portion in the provided vial, introduce extraction solvent, input the sample into LightLab and eight minutes later you will have your potency information.” She says their goal is to ensure producers can get lab-grade results.

The hard plastic case is a unique feature of this instrument

McArdle also says the device is designed to test a wide range of samples, allowing growers, processors and infused product manufacturers to use it for quality assurance. “Extracts manufacturers use LightLab to limit loss- they accurately value trim purchases on the spot, they test throughout their extraction process including tests on spent material (raffinate) and of course the final product,” says McArdle. “Edibles manufacturers test the potency of their raw ingredients and check batch dosing. Cultivators use LightLab for strain selection, maturation monitoring, harvesting at peak and tinkering.”

Orange Photonics’ instrument also connects to devices via Wi-Fi and Bluetooth. McArdle says cannabis companies throughout the supply chain use it. “We aren’t trying to replace lab testing, but anyone making a cannabis product is shooting in the dark if they don’t have access to real time data about potency,” says McArdle.

The Practical Chemist

Instrumentation for Heavy Metals Analysis in Cannabis

By Chris English
2 Comments

Determination of Toxic Metals in Cannabis

Heavy metals are common environmental contaminants often resulting from mining operations, industrial waste, automotive emissions, coal fired power plants, amount other sources. Several remediation strategies exist that are common for the reduction/elimination of metals in the environment. Phytoremediation is one method for removing metals from soil, utilizing plants to uptake metals which then bioaccumulate in the plant matter. In one study, cesium concentrations were found to be 8,000 times greater in the plant roots compared to the surrounding water in the soil. In 1998, cannabis was specifically tested at the Chernobyl nuclear disaster site for its ability to remediate the contaminated soil. These examples demonstrate that cannabis must be carefully cultivated to avoid the uptake of toxic metals. Possible sources would not only include the growing environment, but also materials such as fertilizers. Many states publish metal content in fertilizer products allowing growers to select the cleanest product for their plants. For cannabis plant material and concentrates several states have specific limits for cadmium (Cd), Lead (Pb), Arsenic (As) and Mercury (Hg), based on absolute limits in product or daily dosage by body weight.

Analytical Approaches to Metals Determination

Inductively Coupled Plasma, Ionized Argon gas stream. Photo Courtesy: Sigma via Wikimedia Commons

Flame Atomic Absorption Spectroscopy (Flame AA) and Graphite Furnace Atomic Absorption Spectroscopy (GFAA) are both techniques that determine both the identity and quantity of specific elements. For both of these techniques, the absorption in intensity of a specific light source is measured following the atomization of the sample digestate using either a flame or an electrically heated graphite tube. Reference standards are analyzed prior to the samples in order to develop a calibration that relates the concentration of each element relative to its absorbance. For these two techniques, each element is often determined individually, and the light source, most commonly a hollow cathode lamp (HLC) or electrodeless discharge lamp (EDL) are specific for each element. The two most common types of Atomic Emission Spectroscopy (AES) are; Inductively Coupled Plasma Optical Emission Spectroscopy (ICP-OES) and ICP-Mass Spectrometry (ICP-MS). Both of these techniques use an argon plasma for atomization of the sample digestates. This argon plasma is maintained using a radio frequency generator that is capable of atomization and excitation of the majority of the elements on the periodic table. Due to the considerably higher energy of the plasma-based instruments, they are more capable than the flame or furnace based systems for measurement of a wide range of elements. Additionally, they are based on optical emission, or mass spectrometric detection, and are capable of analysis of all elements at essentially the same time.

Technique Selection

Flame AA is easy to use, inexpensive and can provide reasonable throughput for a limited number of elements. However, changes to light sources and optical method parameters are necessary when determining different metals. GFAA is also limited by similar needs to change the light sources, though it is capable of greater sensitivity for most elements as compared to flame AA. Runtimes are on the order of three minutes per element for each sample, which can result in lower laboratory throughput and greater sample digestate consumption. While the sensitivity of the absorption techniques is reasonable, the dynamic range can be more limited requiring re-analyses and dilutions to get the sample within the calibration range. ICP-OES allows the simultaneous analysis of over 70 elements in approximately a minute per sample with a much greater linear dynamic range. ICP-OES instruments cost about 2-5 times more than AA instruments. ICP-MS generally has the greatest sensitivity (sub-parts-per-trillion, for some elements) with the ability to determine over 70 elements per minute. Operator complexity, instrument expense and MS stability, as well as cost are some of the disadvantages. The US FDA has a single laboratory validated method for ICP-MS for elements in food using microwave assisted digestion, and New York State recently released a method for the analysis of metals in medical cannabis products by ICP-MS (NYS DOH LINC-250).

The use of fertilizers, and other materials, with low metal content is one step necessary to providing a safe product and maintaining customer confidence. The state-by-state cannabis regulations will continue to evolve which will require instrumentation that is flexible enough to quickly accommodate added metals to the regulatory lists, lower detection limits while adding a high level of confidence in the data.

Chris English
The Practical Chemist

Accurate Detection of Residual Solvents in Cannabis Concentrates

By Chris English
2 Comments
Chris English

Edibles and vape pens are rapidly becoming a sizable portion of the cannabis industry as various methods of consumption popularize beyond just smoking dried flower. These products are produced using cannabis concentrates, which come in the form of oils, waxes or shatter (figure 1). Once the cannabinoids and terpenes are removed from the plant material using solvents, the solvent is evaporated leaving behind the product. Extraction solvents are difficult to remove in the low percent range so the final product is tested to ensure leftover solvents are at safe levels. While carbon dioxide and butane are most commonly used, consumer concern over other more toxic residual solvents has led to regulation of acceptable limits. For instance, in Colorado the Department of Public Health and Environment (CDPHE) updated the state’s acceptable limits of residual solvents on January 1st, 2017.

Headspace Analysis

Figure 1: Shatter can be melted and dissolved in a high molecular weight solvent for headspace analysis (HS). Photo Courtesy of Cal-Green Solutions.

Since the most suitable solvents are volatile, these compounds are not amenable to HPLC methods and are best suited to gas chromatography (GC) using a thick stationary phase capable of adequate retention and resolution of butanes from other target compounds. Headspace (HS) is the most common analytical technique for efficiently removing the residual solvents from the complex cannabis extract matrix. Concentrates are weighed out into a headspace vial and are dissolved in a high molecular weight solvent such as dimethylformamide (DMF) or 1,3-dimethyl-3-imidazolidinone (DMI). The sealed headspace vial is heated until a stable equilibrium between the gas phase and the liquid phase occurs inside the vial. One milliliter of gas is transferred from the vial to the gas chromatograph for analysis. Another approach is full evaporation technique (FET), which involves a small amount of sample sealed in a headspace vial creating a single-phase gas system. More work is required to validate this technique as a quantitative method.

Gas Chromatographic Detectors

The flame ionization detector (FID) is selective because it only responds to materials that ionize in an air/hydrogen flame, however, this condition covers a broad range of compounds. When an organic compound enters the flame; the large increase in ions produced is measured as a positive signal. Since the response is proportional to the number of carbon atoms introduced into the flame, an FID is considered a quantitative counter of carbon atoms burned. There are a variety of advantages to using this detector such as, ease of use, stability, and the largest linear dynamic range of the commonly available GC detectors. The FID covers a calibration of nearly 5 orders of magnitude. FIDs are inexpensive to purchase and to operate. Maintenance is generally no more complex than changing jets and ensuring proper gas flows to the detector. Because of the stability of this detector internal standards are not required and sensitivity is adequate for meeting the acceptable reporting limits. However, FID is unable to confirm compounds and identification is only based on retention time. Early eluting analytes have a higher probability of interferences from matrix (Figure 2).

Figure 2: Resolution of early eluting compounds by headspace – flame ionization detection (HS-FID). Chromatogram Courtesy of Trace Analytics.

Mass Spectrometry (MS) provides unique spectral information for accurately identifying components eluting from the capillary column. As a compound exits the column it collides with high-energy electrons destabilizing the valence shell electrons of the analyte and it is broken into structurally significant charged fragments. These fragments are separated by their mass-to-charge ratios in the analyzer to produce a spectral pattern unique to the compound. To confirm the identity of the compound the spectral fingerprint is matched to a library of known spectra. Using the spectral patterns the appropriate masses for quantification can be chosen. Compounds with higher molecular weight fragments are easier to detect and identify for instance benzene (m/z 78), toluene (m/z 91) and the xylenes (m/z 106), whereas low mass fragments such as propane (m/z 29), methanol (m/z 31) and butane (m/z 43) are more difficult and may elute with matrix that matches these ions. Several disadvantages of mass spectrometers are the cost of equipment, cost to operate and complexity. In addition, these detectors are less stable and require an internal standard and have a limited dynamic range, which can lead to compound saturation.

Regardless of your method of detection, optimized HS and GC conditions are essential to properly resolve your target analytes and achieve the required detection limits. While MS may differentiate overlapping peaks the chances of interference of low molecular weight fragments necessitates resolution of target analytes chromatographically. FID requires excellent resolution for accurate identification and quantification.

The Practical Chemist

Pesticide Analysis in Cannabis and Related Products: Part 3

By Julie Kowalski
No Comments

As mentioned in Part 1, pesticides residue analysis is very challenging especially considering the complexity of cannabis and the variety of flower, concentrates and infused products. In addition, pesticides are tested at low levels typically at parts-per-billion (ppb). For example, the food safety industry often uses 10 ppb as a benchmark limit of quantification. To put that in perspective, current pesticides limits in cannabis range from 10 ppb default (Massachusetts Regulatory Limit) to a more typical range of 100 ppb to 2 ppm in other states. Current testing is also complicated by evolving regulations.

Despite these challenges, adaptation of methods used by the food safety industry have proved successful for testing pesticides in cannabis. These methods typically rely on mass spectrometric detection paired with sample preparation methods to render the sample clean enough to yield quality data.

Pesticide Analysis Methods: Sample preparation and Analytical Technique Strategy

Generally, methods can be divided into two parts; sample preparation and analytical testing where both are critical to the success of pesticide residue testing and are inextricably linked. Reliance on mass spectrometric techniques like tandem mass spectrometry and high resolution accurate mass (HRAM) mass spectrometry is attributed to the substantial sensitivity and selectivity provided. The sensitivity and selectivity achievable by the detector largely dictates the sample preparation that will be required. The more sensitive and selective the detector, the less rigorous and resource intensive sample preparation can be.

Analytical technique: Gas and Liquid Chromatography Tandem Mass Spectrometry 

The workhorse approach for pesticide residue analysis involves using gas chromatography and liquid chromatography tandem mass spectrometry (MS/MS) in the ion transition mode. This ion transition mode, often referred to as multiple reaction monitoring (MRM) or selected reaction monitoring (SRM), adds the selectivity and sensitivity needed for trace level analysis. Essentially, a pesticide precursor ion is fragmented into product ions. The detector monitors the signal for a specified product ion known to have originated from the pesticide precursor ion. This allows the signal to be corrected, associated with the analyte and not with other matrix components in the sample. In addition, because only ions meeting the precursor/product ion requirements are passed to the detector with little noise, there is a benefit to the observed signal to noise ratio allowing better sensitivity than in other modes. Even though ion transitions are specific, there is the possibility a matrix interference that also demonstrates that same ion transition could result in a false positive. Multiple ion transitions for each analyte are monitored to determine an ion ratio. The ion ratio should remain consistent for a specific analyte and is used to add confidence to analyte identification.

The best choice for pesticide analysis between gas chromatography (GC) and liquid chromatography (LC) is often questioned. To perform comprehensive pesticide screening similar to the way the food safety market approaches this challenge requires both techniques. It is not uncommon for screening methods to test for several hundred pesticides that vary in physiochemical properties. It may be possible that with a smaller list of analytes, only one technique will be needed but often in order to reach the low limits for pesticide residues both GC and LC are required.

Modified QuEChERS extraction using 1.5 grams of cannabis flower. Courtesy of Julie Kowalski (Restek Corporation), Jeff Dahl (Shimadzu Scientific Instruments) and Derek Laine (Trace Analytics).

Analytical technique: Sample Preparation

Less extensive sample preparation is possible when combined with sensitive and selective detectors like MS/MS. One popular method is the QuEChERS approach. QuEChERS stands for Quick, Easy, Cheap, Effective, Rugged and Safe. It consists of a solvent extraction/salting out step followed by a cleanup using dispersive solid phase extraction. Originally designed for fruit and vegetable pesticide testing, QuEChERS has been modified and used for many other commodity types including cannabis. Although QuEChERS is a viable method, sometimes more cleanup is needed and this can be done with cartridge solid phase extraction. This cleanup functions differently and is more labor intensive, but results in a cleaner extract. A cleaner extract helps to secure quality data and is sometimes needed for difficult analyses.