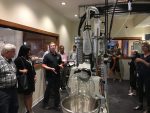
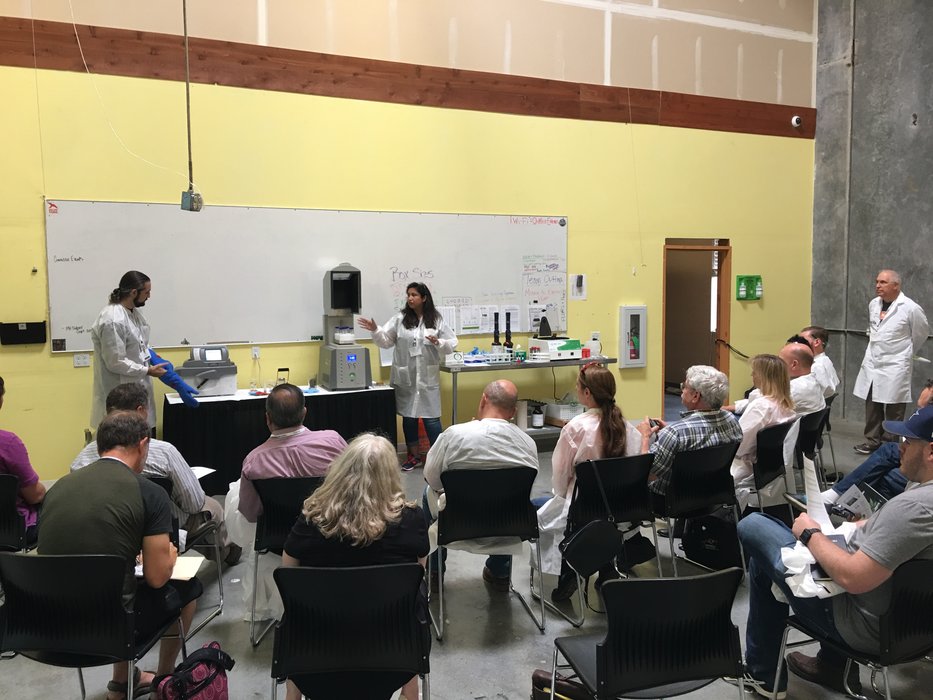
On Monday, August 28th, attendees of the Cannabis Science Conference descended on Portland, Oregon for a week of educational talks, networking and studying the science of cannabis. On Monday, Chalice Farms, an extracts and infused products company, hosted the full-day JCanna Boot Camp focused on a deep dive behind the scenes of a cannabis production facility. The Cannabis Science Conference, hosted by Josh Crossney, founder of JCanna, takes place August 28th to 30th.
Attendees touring an extraction setup
Attendees were split into five groups where they listened to a variety of educational sessions and toured the facility. A track focused on cultivation, led by Autumn Karcey, president of Cultivo, Inc., detailed all things facility design for cannabis cultivation, including an in-depth look at sanitation and safety. For example, Karcey discussed HVAC cleanliness, floor-to-ceiling sanitation and the hazards associated with negative pressure. These principles, while applicable to most cultivating facilities, applies particularly to commercial-scale grows in a pharmaceutical setting.
Sandy Mangan and Tristan DeBona demonstrating the grinding technique for sample prep
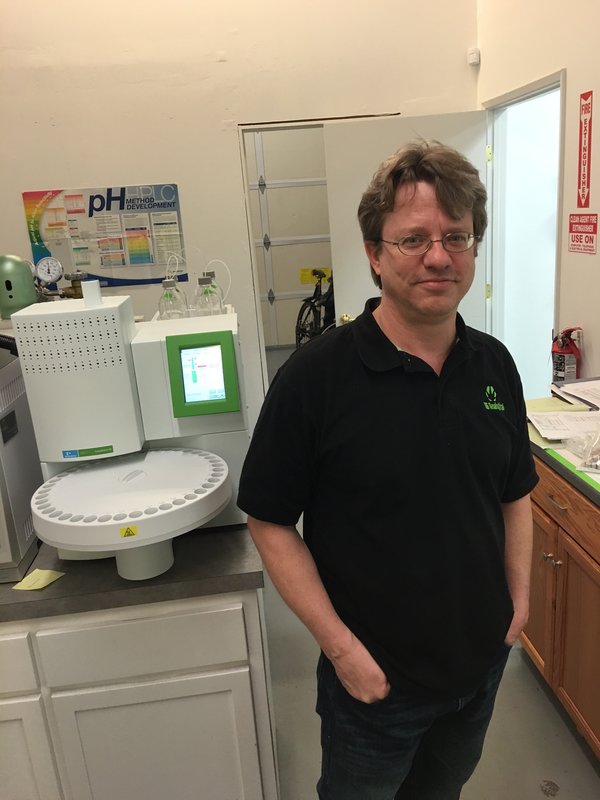
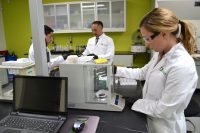
During one session, Sandy Mangan, accounts manager at SPEX Sample Prep and Tristan DeBona, sales specialist at SPEX Sample Prep, demonstrated the basics of sample preparation for detecting pesticides in infused products, such as gummies. That required using their GenoGrinder and FreezerMill, which uses liquid nitrogen to make gummies brittle, then pulverizing them to a powder-like substance that is more conducive for a QuEChERS preparation.
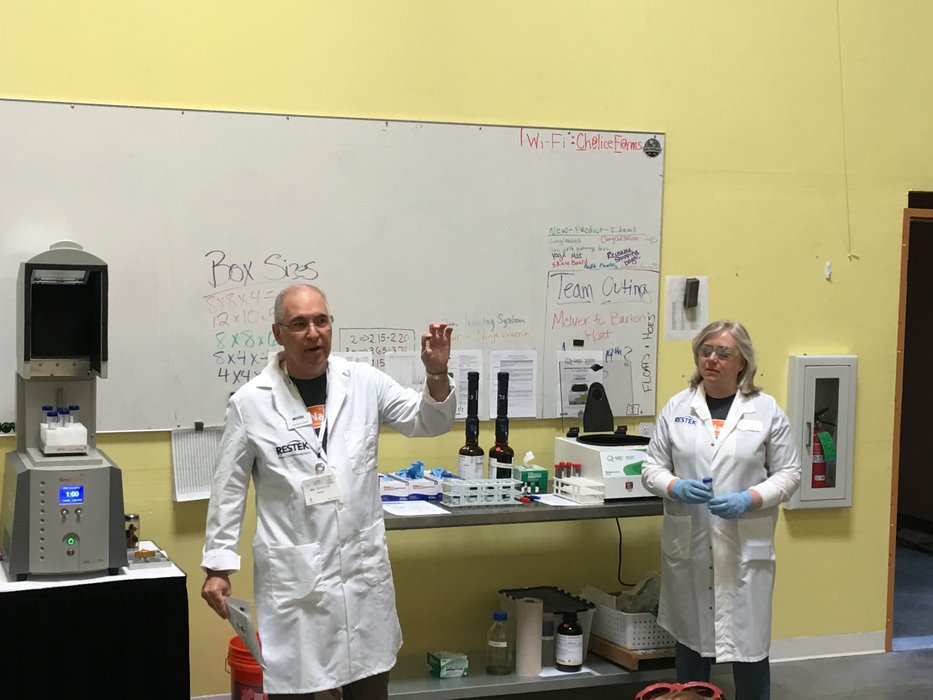
Joe Konschnik and Susan Steinike demonstrate the QuEChERS method
Joe Konschnik, business development manager at Restek, Susan Steinike, product-marketing manager at Restek and Justin Steimling, an analytical chemist at Restek, gave a demonstration of a full QuEChERS extraction of a cannabis sample for pesticide analysis, with attendees participating to learn the basics of sample preparation for these types of tests.
Following those were some other notable talks, including a tour of the extraction instruments and equipment at Chalice Farms, a look inside their commercial kitchen and a discussion of edibles and product formulation. Dr. Uma Dhanabalan, founder of Uplifting Health and Wellness, a physician with over 30 years of experience in research and patient care, led a discussion of physician participation, patient education and drug delivery mechanisms.
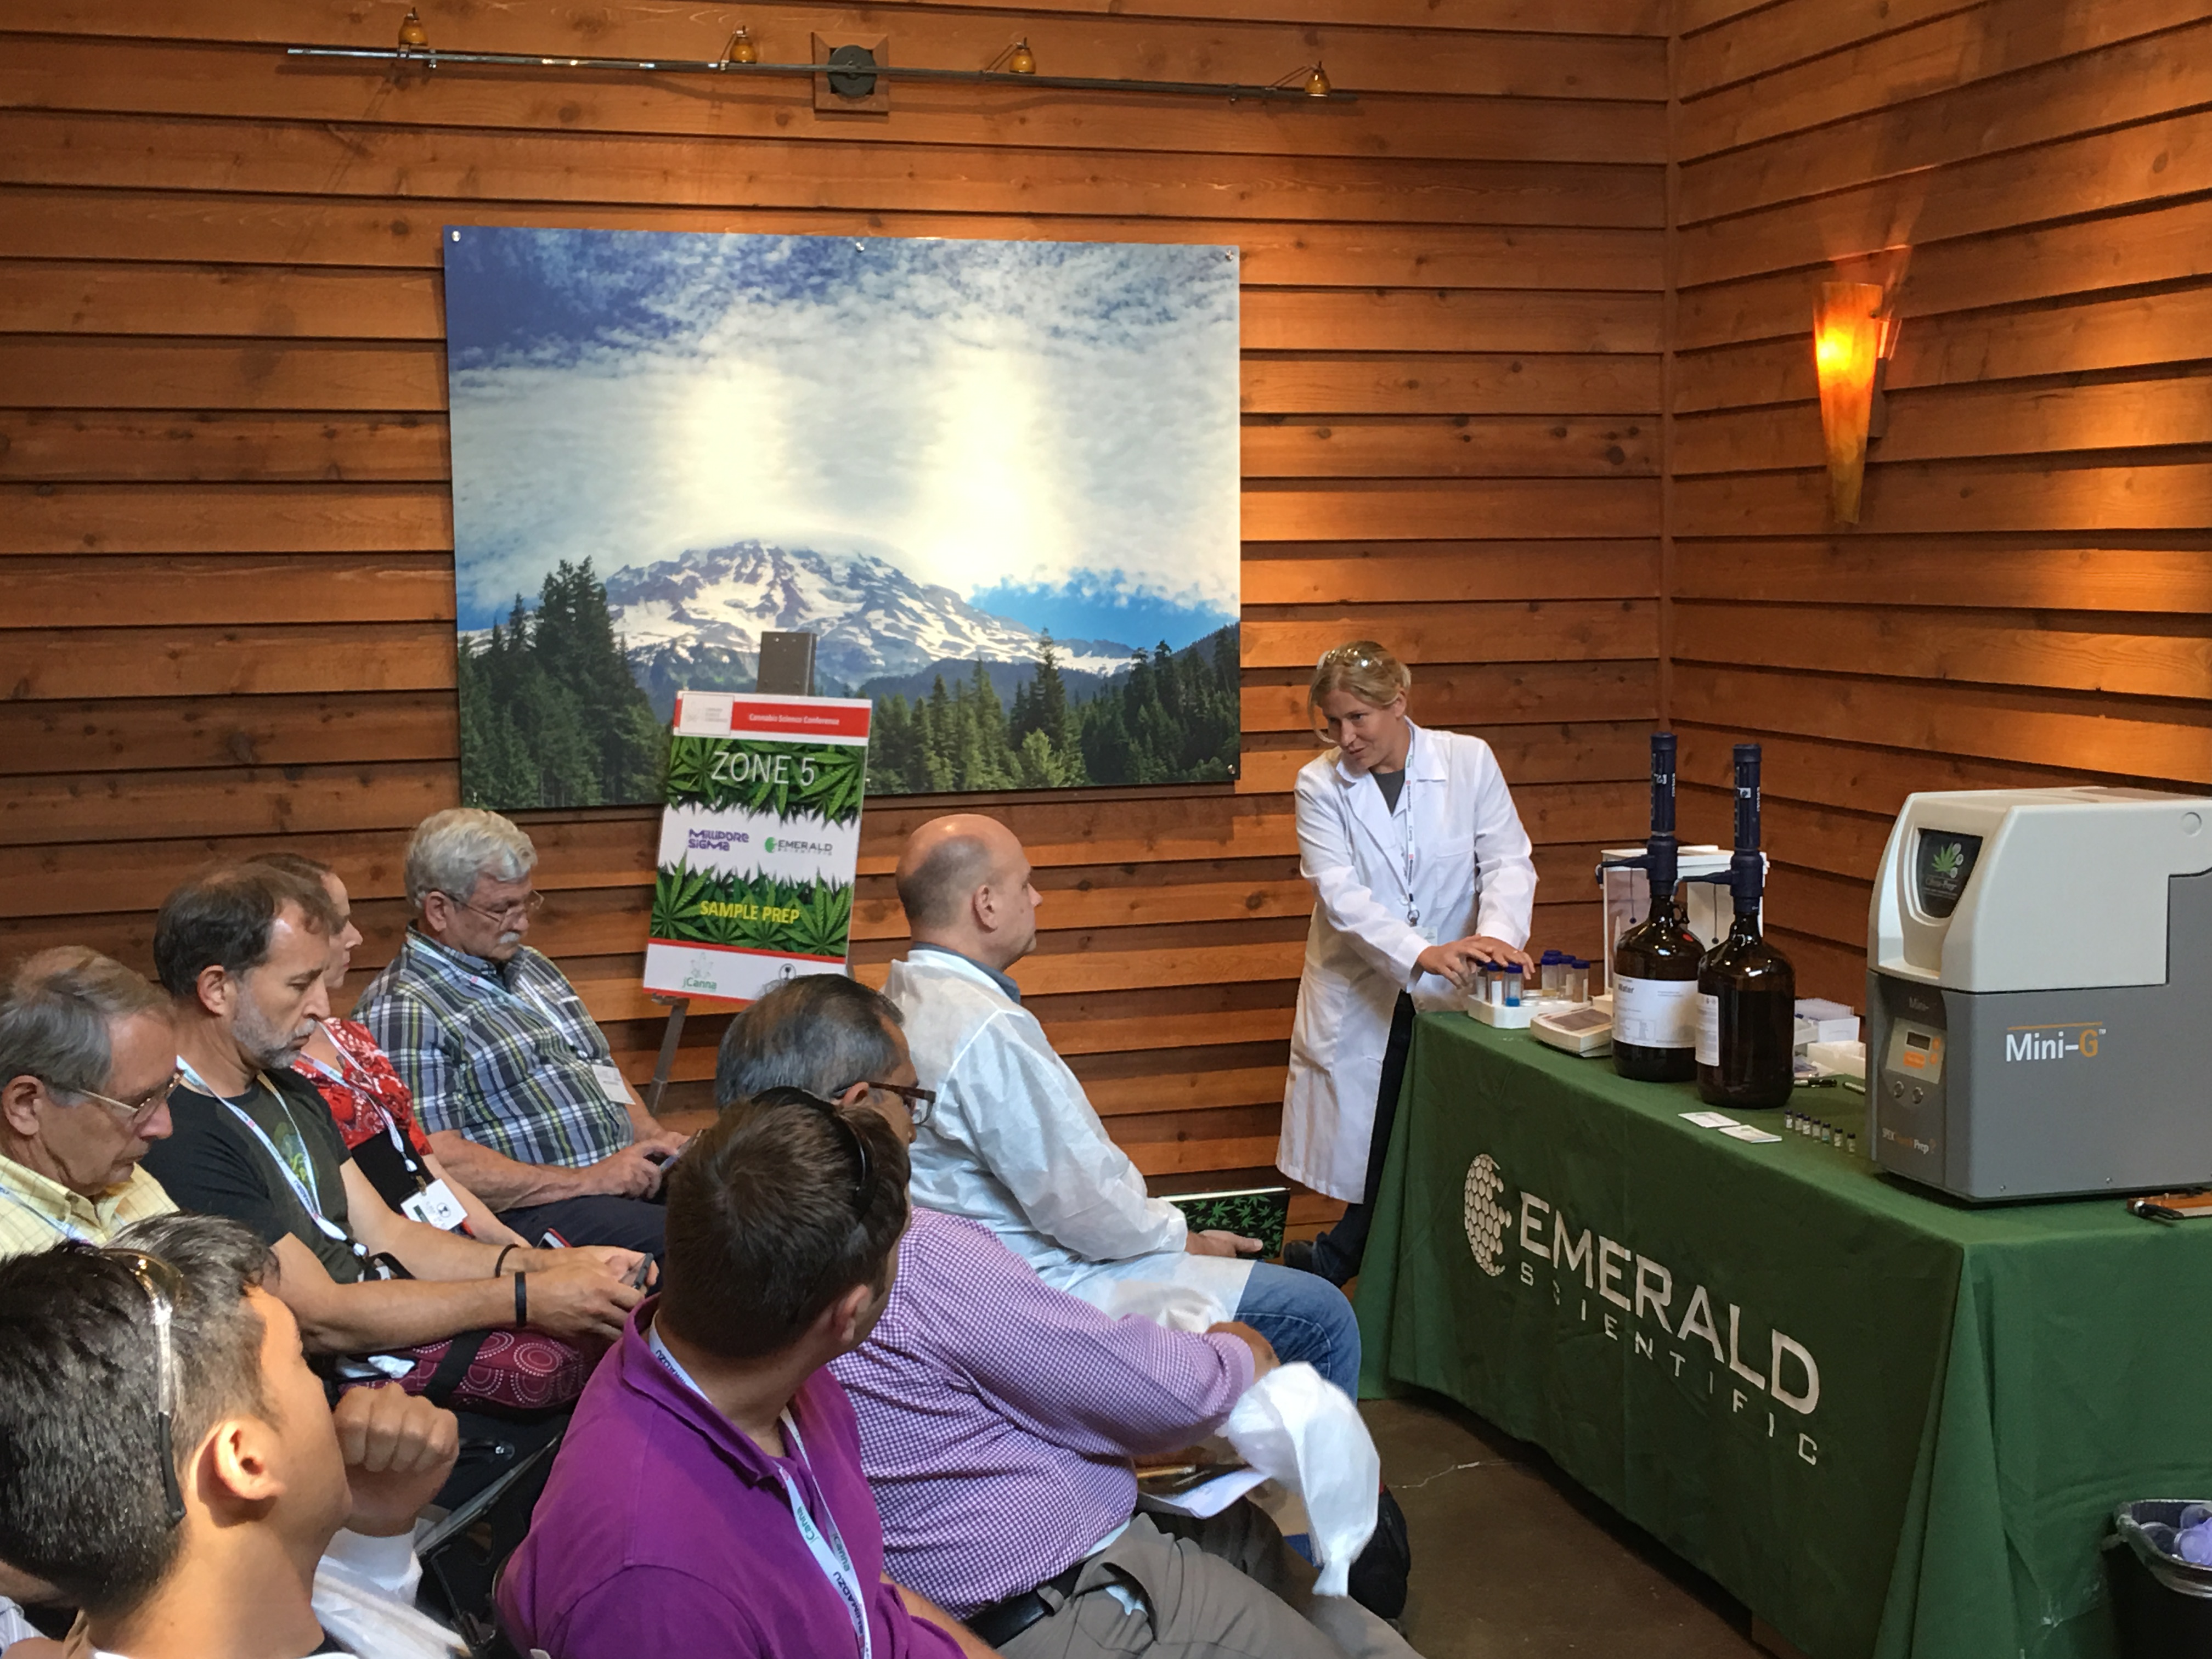
Amanda Rigdon, Emerald Scientific, showing some complex matrices in cannabis products
Amanda Rigdon, chief technical officer of Emerald Scientific, offered a demonstration of easy and adaptable sample preparation techniques for potency testing of infused product matrices. Rigdon showed attendees of the boot camp how wildly diverse cannabis products are and how challenging it can be for labs to test them.
The JCanna Canna Boot Camp is a good example of an educational event catered to the cannabis industry that offers real, hands-on experience and actionable advice. Before the two-day conference this week, the boot camp provided a bird’s eye view for attendees of the science of cannabis.
According to a press release published earlier this week, DB Labs achieved accreditation, becoming the first ISO 17025-accredited cannabis laboratory in Las Vegas. DB Labs received their accreditation with the help of Perry Johnson Laboratory Accreditation, Inc., an organization that provides third-party assessments to ISO/IEC 17025:2005. DB Labs was also the very first cannabis-testing lab in the state of Nevada.
According to Susan Bunce, president of DB Labs, ISO accreditation is one way the cannabis lab space is being standardized. “As the first cannabis-testing laboratory in Nevada, DB Labs has always taken patient safety very seriously and has always tried to raise the bar,” says Bunce. “The world of cannabis testing is often compared to the Wild West: each lab uses state regulations to set their standards, but it leaves a lot of room for subjective interpretations. The ISO accreditation removes the ambiguity and guarantees a consistent level of testing to users. We are proud to be a part of that.”
According to Tracy Szerszen, president and operations manager at Perry Johnson, ISO/IEC 17025:2005 is an international standard utilized to accredit testing laboratories. “This accreditation provides confidence to end-users that the test results they receive are reliable,” says Szerszen. “Laboratories achieving this accreditation have demonstrated their ability to adequately perform tests using appropriate equipment, environmental conditions and technical staff.” She says another requirement for that accreditation is a quality management system, which essentially helps manage operations and client needs. “Achieving this type of accreditation is quite challenging for laboratories especially with all of the new up-and-coming regulations, technologies and methods in the cannabis industry,” says Szerszen. “Laboratory testing is such a critical part of this industry and becoming accredited provides assurance that they are performing to the highest standard.”
As Szerszen points out, laboratory accreditation can provide a consumer that sense of confidence and trust in the product’s lab testing. “PJLA would like to commend DB Labs for achieving their ISO/IEC 17025:2005 accreditation and their commitment towards meeting the standard,” says Szerszen.
The news of their accreditation comes at an opportune time: With surging consumer demand at the outset of recreational sales, the state has raked in millions of dollars in sales within the first weekend. Recreational cannabis sales in Nevada began on July 1st, and a statewide cannabis product shortage recently led to Governor Sandoval issuing a statement of emergency, allowing more applications for distribution licenses to be considered.
Heavy metals are common environmental contaminants often resulting from mining operations, industrial waste, automotive emissions, coal fired power plants, amount other sources. Several remediation strategies exist that are common for the reduction/elimination of metals in the environment. Phytoremediation is one method for removing metals from soil, utilizing plants to uptake metals which then bioaccumulate in the plant matter. In one study, cesium concentrations were found to be 8,000 times greater in the plant roots compared to the surrounding water in the soil. In 1998, cannabis was specifically tested at the Chernobyl nuclear disaster site for its ability to remediate the contaminated soil. These examples demonstrate that cannabis must be carefully cultivated to avoid the uptake of toxic metals. Possible sources would not only include the growing environment, but also materials such as fertilizers. Many states publish metal content in fertilizer products allowing growers to select the cleanest product for their plants. For cannabis plant material and concentrates several states have specific limits for cadmium (Cd), Lead (Pb), Arsenic (As) and Mercury (Hg), based on absolute limits in product or daily dosage by body weight.
Analytical Approaches to Metals Determination
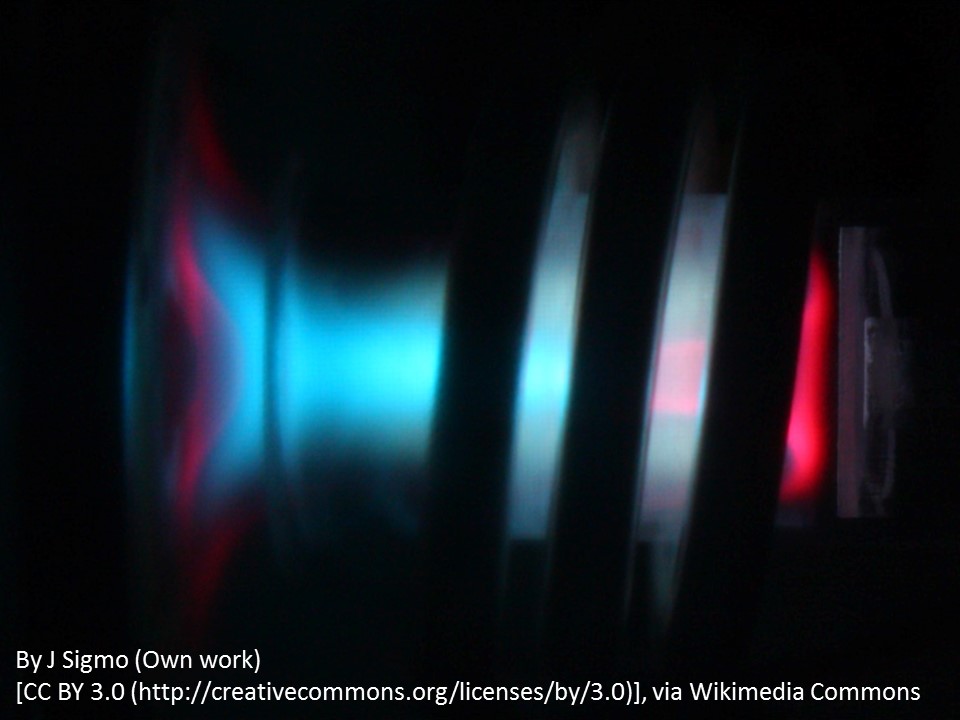
Inductively Coupled Plasma, Ionized Argon gas stream. Photo Courtesy: Sigma via Wikimedia Commons
Flame Atomic Absorption Spectroscopy (Flame AA) and Graphite Furnace Atomic Absorption Spectroscopy (GFAA) are both techniques that determine both the identity and quantity of specific elements. For both of these techniques, the absorption in intensity of a specific light source is measured following the atomization of the sample digestate using either a flame or an electrically heated graphite tube. Reference standards are analyzed prior to the samples in order to develop a calibration that relates the concentration of each element relative to its absorbance. For these two techniques, each element is often determined individually, and the light source, most commonly a hollow cathode lamp (HLC) or electrodeless discharge lamp (EDL) are specific for each element. The two most common types of Atomic Emission Spectroscopy (AES) are; Inductively Coupled Plasma Optical Emission Spectroscopy (ICP-OES) and ICP-Mass Spectrometry (ICP-MS). Both of these techniques use an argon plasma for atomization of the sample digestates. This argon plasma is maintained using a radio frequency generator that is capable of atomization and excitation of the majority of the elements on the periodic table. Due to the considerably higher energy of the plasma-based instruments, they are more capable than the flame or furnace based systems for measurement of a wide range of elements. Additionally, they are based on optical emission, or mass spectrometric detection, and are capable of analysis of all elements at essentially the same time.
Technique Selection
Flame AA is easy to use, inexpensive and can provide reasonable throughput for a limited number of elements. However, changes to light sources and optical method parameters are necessary when determining different metals. GFAA is also limited by similar needs to change the light sources, though it is capable of greater sensitivity for most elements as compared to flame AA. Runtimes are on the order of three minutes per element for each sample, which can result in lower laboratory throughput and greater sample digestate consumption. While the sensitivity of the absorption techniques is reasonable, the dynamic range can be more limited requiring re-analyses and dilutions to get the sample within the calibration range. ICP-OES allows the simultaneous analysis of over 70 elements in approximately a minute per sample with a much greater linear dynamic range. ICP-OES instruments cost about 2-5 times more than AA instruments. ICP-MS generally has the greatest sensitivity (sub-parts-per-trillion, for some elements) with the ability to determine over 70 elements per minute. Operator complexity, instrument expense and MS stability, as well as cost are some of the disadvantages. The US FDA has a single laboratory validated method for ICP-MS for elements in food using microwave assisted digestion, and New York State recently released a method for the analysis of metals in medical cannabis products by ICP-MS (NYS DOH LINC-250).
The use of fertilizers, and other materials, with low metal content is one step necessary to providing a safe product and maintaining customer confidence. The state-by-state cannabis regulations will continue to evolve which will require instrumentation that is flexible enough to quickly accommodate added metals to the regulatory lists, lower detection limits while adding a high level of confidence in the data.
Last Friday, the Bureau of Marijuana Control, the regulatory body overseeing California’s cannabis industry, released a set of proposed regulations for the lab testing market. The regulations are somewhat comprehensive, covering sampling, licensing, pesticide testing, microbiological contaminants, residual solvents, water activity and much more.
Formerly named the Bureau of Medical Cannabis Regulation under the state’s Department of Consumer Affairs, the Bureau of Marijuana Control is tasked with overseeing the development, implementation and enforcement of the regulations for the state’s cannabis industry. In their statement of reasons for the lab testing regulations, the bureau says they are designed with public health and safety at top of mind. At first glance, much of these laboratory rules seem loosely modeled off of Colorado and Oregon’s already implemented testing regulations.
The regulations lay out requirements for testing cannabis products prior to bringing them to market. That includes testing for residual solvents and processing chemicals, microbiological contaminants, mycotoxins, foreign materials, heavy metals, pesticides, homogeneity as well as potency in quantifying cannabinoids.
The microbiological impurities section lays out some testing requirements designed to prevent food-borne illness. Labs are required to test for E. coli, Salmonella and multiple species of the pathogenic Aspergillus. If a lab detects any of those contaminants, that batch of cannabis or cannabis products would then fail the test and could not be sold to consumers. A lab must report all of that information on a certificate of analysis, according to the text of the regulations.
The proposed regulations stipulate requirements for sampling, including requiring labs to develop sampling plans with standard operating procedures (SOPs) and requiring a lab-approved sampler to follow chain-of-custody protocols. The rules also propose requiring SOPs for analytical methodology. That includes some method development parameters like the list of analytes and applicable matrices. It also says all testing methods need to be validated and labs need to incorporate guidelines from the FDA’s Bacterial Analytical Manual, the U.S. Pharmacopeia and AOAC’s Official Methods of Analysis for Contaminant Testing, or other scientifically valid testing methodology.
Labs will be required to be ISO 17025-accredited in order to perform routine cannabis testing. Laboratories also need to participate in proficiency testing (PT) program “provided by an ISO 17043 accredited proficiency-test provider.” If a laboratory fails to participate in the PT program or fails to pass to receive a passing grade, that lab may be subject to disciplinary action against the lab’s license. Labs need to have corrective action plans in place if they fail to get a passing grade for any portion of the PT program.
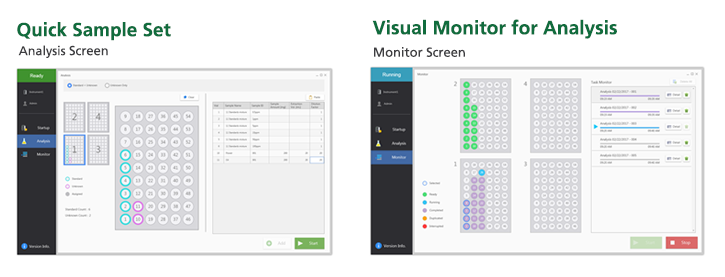
On Monday, March 6th, Shimadzu Scientific Instruments, a leading laboratory analytical instrumentation manufacturer, announced the launch of a new product focused on cannabis, according to a press release. Their Cannabis Analyzer for Potency is essentially a high-performance liquid chromatograph (HPLC) packaged with integrated hardware, software, workflows and all the supplies. The supplies include an analytical column, guard columns, mobile phase and a CRM standard mixture.
The instrument is designed to test for 11 cannabinoids in less time and with greater ease than traditional HPLC instruments. In the press release, they claim “operators are now able to produce accurate results with ease, regardless of cannabis testing knowledge or chromatography experience.” One very unique aspect of the instrument is the lack of experience required to run it, according to Bob Clifford, general manager of marketing at Shimadzu. “We have our typical chromatography software [LabSolutions] with an overlay that allows the user to analyze a sample in three simple steps,” says Clifford. Those in the cannabis industry that have a background in plant science, but not analytical chemistry, could run potency analyses on the instrument with minimal training. “This overlay allows ease of use for those not familiar with chromatography software,” says Clifford.
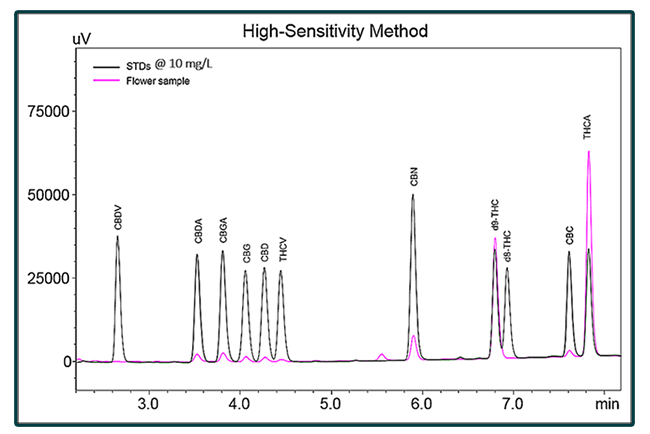
An overlay of a flower sample with the standards supplied in the High-Sensitivity Method package.
The instrument can determine cannabinoid percentages per dry weight in flower concentrates and edibles. “Once you open the software, it will get the flow rate started, heat the column up and automatically begin to prep for analysis,” says Clifford. Before the analysis begins, information like the sample ID number, sample name, sample weight, extraction volume and dilution volume are entered. After the analysis is complete all the test results are reported for each sample.
Because laboratories wouldn’t have to develop quantitative testing methodology, they argue this instrument would save a lot of time in the lab. “After one day of installation and testing, users are equipped with everything they need to obtain cannabis potency results,” states the press release. According to Clifford, method development for potency analysis in-house can take some labs up to three months. “We can bring this instrument to the lab and have it ready for testing almost immediately,” says Clifford. “The methods for this instrument were developed by a team of twenty scientists working on different platforms at our Innovation Center and was tested for ruggedness, repeatability and quantitative accuracy.”
Screenshots from the software on the instrument
The instrument’s workflow is designed to meet three methods of analysis depending on testing needs. The High Throughput method package can determine quantities of ten cannabinoids with less than eight minutes per sample. The method was developed in collaboration with commercial testing laboratories. The High Sensitivity method package adds THCV to that target analyte list with ten minutes per analysis. The method provides the sharpest chromatographic peaks and best sensitivity. The High Resolution method package offers full baseline resolution for those 11 cannabinoids in less than 30 minutes per analysis and the ability to add cannabinoids to that target list if regulations change.
The press release states the interface should allow users to reduce the number of steps needed in the analysis and simplify the workflow. The instrument comes with a three-year warranty, preventative maintenance plan and lifetime technical support.
Almost as soon as cannabis became recreationally legal, the public started to ask questions about the safety of products being offered by dispensaries – especially in terms of pesticide contamination. As we can see from the multiple recalls of product there is a big problem with pesticides in cannabis that could pose a danger to consumers. While The Nerd Perspective is grounded firmly in science and fact, the purpose of this column is to share my insights into the cannabis industry based on my years of experience with multiple regulated industries with the goal of helping the cannabis industry mature using lessons learned from other established markets. In this article, we’ll take a look at some unique challenges facing cannabis testing labs, what they’re doing to respond to the challenges, and how that can affect the cannabis industry as a whole.
Photo: Michelle Tribe, Flickr
The Big Challenge
Over the past several years, laboratories have quickly ‘grown up’ in terms of technology and expertise, improving their methods for pesticide detection to improve data quality and lower detection limits, which ultimately ensures a safer product by improving identification of contaminated product. But even though cannabis laboratories are maturing, they’re maturing in an environment far different than labs from regulated industry, like food laboratories. Food safety testing laboratories have been governmentally regulated and funded from almost the very beginning, allowing them some financial breathing room to set up their operation, and ensuring they won’t be penalized for failing samples. In contrast, testing fees for cannabis labs are paid for by growers and producers – many of whom are just starting their own business and short of cash. This creates fierce competition between cannabis laboratories in terms of testing cost and turnaround time. One similarity that the cannabis industry shares with the food industry is consumer and regulatory demand for safe product. This demand requires laboratories to invest in instrumentation and personnel to ensure generation of quality data. In short, the two major demands placed on cannabis laboratories are low cost and scientific excellence. As a chemist with years of experience, scientific excellence isn’t cheap, thus cannabis laboratories are stuck between a rock and a hard place and are feeling the squeeze.
Responding to the Challenge
One way for high-quality laboratories to win business is to tout their investment in technology and the sophistication of their methods; they’re selling their science, a practice I stand behind completely. However, due to the fierce competition between labs, some laboratories have oversold their science by using terms like ‘lethal’ or ‘toxic’ juxtaposed with vague statements regarding the discovery of pesticides in cannabis using the highly technical methods that they offer. This juxtaposition can then be reinforced by overstating the importance of ultra-low detection levels outside of any regulatory context. For example, a claim stating that detecting pesticides at the parts per trillion level (ppt) will better ensure consumer safety than methods run by other labs that only detect pesticides at concentrations at parts per billion (ppb) concentrations is a potentially dangerous claim in that it could cause future problems for the cannabis industry as a whole. In short, while accurately identifying contaminated samples versus clean samples is indeed a good thing, sometimes less isn’t more, bringing us to the second half of the title of this article.
Less isn’t always more…
The Milky Way
In my last article, I illustrated the concept of the trace concentrations laboratories detect, finishing up with putting the concept of ppb into perspective. I wasn’t even going to try to illustrate parts per trillion. Parts per trillion is one thousand times less concentrated than parts per billion. To put ppt into perspective, we can’t work with water like I did in my previous article; we have to channel Neil deGrasse Tyson.
The Milky Way galaxy contains about 100 billion stars, and our sun is one of them. Our lonely sun, in the vastness of our galaxy, where light itself takes 100,000 years to traverse, represents a concentration of 10 ppt. On the surface, detecting galactically-low levels of contaminants sounds wonderful. Pesticides are indeed lethal chemicals, and their byproducts are often lethal or carcinogenic as well. From the consumer perspective, we want everything we put in our bodies free of harmful chemicals. Looking at consumer products from The Nerd Perspective, however, the previous sentence changes quite a bit. To be clear, nobody – nerds included – wants food or medicine that will poison them. But let’s explore the gap between ‘poison’ and ‘reality’, and why that gap matters.
In reality, according to a study conducted by the FDA in 2011, roughly 37.5% of the food we consume every day – including meat, fish, and grains – is contaminated with pesticides. Is that a good thing? No, of course it isn’t. It’s not ideal to put anything into our bodies that has been contaminated with the byproducts of human habitation. However, the FDA, EPA, and other governmental agencies have worked for decades on toxicological, ecological, and environmental studies devoted to determining what levels of these toxic chemicals actually have the potential to cause harm to humans. Rather than discuss whether or not any level is acceptable, let’s take it on principle that we won’t drop over dead from a lethal dose of pesticides after eating a salad and instead take a look at the levels the FDA deem ‘acceptable’ for food products. In their 2011 study, the FDA states that “Tolerance levels generally range from 0.1 to 50 parts per million (ppm). Residues present at 0.01 ppm and above are usually measurable; however, for individual pesticides, this limit may range from 0.005 to 1 ppm.” Putting those terms into parts per trillion means that most tolerable levels range from 100,000 to 50,000,000 ppt and the lower limit of ‘usually measurable’ is 10,000 ppt. For the food we eat and feed to our children, levels in parts per trillion are not even discussed because they’re not relevant.
A specific example of this is arsenic. Everyone knows arsenic is very toxic. However, trace levels of arsenic naturally occur in the environment, and until 2004, arsenic was widely used to protect pressure-treated wood from termite damage. Because of the use of arsenic on wood and other arsenic containing pesticides, much of our soil and water now contains some arsenic, which ends up in apples and other produce. These apples get turned into juice, which is freely given to toddlers everywhere. Why, then, has there not an infant mortality catastrophe? Because even though the arsenic was there (and still is), it wasn’t present at levels that were harmful. In 2013, the FDA published draft guidance stating that the permissible level of arsenic in apple juice was 10 parts per billion (ppb) – 10,000 parts per trillion. None of us would think twice about offering apple juice to our child, and we don’t have to…because the dose makes the poison.
How Does This Relate to the Cannabis Industry?
The concept of permissible exposure levels (a.k.a. maximum residue limits) is an important concept that’s understood by laboratories, but is not always considered by the public and the regulators tasked with ensuring cannabis consumer safety. As scientists, it is our job not to misrepresent the impact of our methods or the danger of cannabis contaminants. We cannot understate the danger of these toxins, nor should we overstate their danger. In overstating the danger of these toxins, we indirectly pressure regulators to establish ridiculously low limits for contaminants. Lower limits always require the use of newer testing technologies, higher levels of technical expertise, and more complicated methods. All of this translates to increased testing costs – costs that are then passed on to growers, producers, and consumers. I don’t envy the regulators in the cannabis industry. Like the labs in the cannabis industry, they’re also stuck between a rock and a hard place: stuck between consumers demanding a safe product and producers demanding low-cost testing. As scientists, let’s help them out by focusing our discussion on the real consumer safety issues that are present in this market.
*average of domestic food (39.5% contaminated) and imported food (35.5% contaminated)
On December 7th, 374 Labs received ISO 17025 accreditation, becoming the first in Nevada to do so. The laboratory, based in Sparks, Nevada, is state-certified and now the only ISO 17025 accredited lab in the state, according to a press release. The laboratory is a member in both the Association of Commercial Cannabis Laboratories (ACCL) and the Nevada Cannabis Laboratory Association (NVCLA).
Managing Partner Alec Garcia at the LCMS/MS
“As Nevada transitions into an adult-use cannabis market, it’s very important that the state’s cannabis testing laboratories are held to the highest standards – and ISO 17025 is a requirement of top testing laboratories in all industries from biotech to forensics in most major countries,” says Dr. Jeff Angermann, assistant professor in the University of Nevada, Reno’s School of Community Health Sciences.
Laboratory Technician Bevan Meade working on sample preparation.
According to the release, 374 Labs was a driving force behind Nevada’s round robin cannabis lab testing program. That program, administered by the Nevada Division of Public and Behavioral Health (DPBH) and the Nevada Department of Agriculture (NDA), sends cannabis samples to each state-certified cannabis lab for a full analysis, measuring the consistency in test results across labs. “In other states proficiency involves testing pre-prepared, purified samples and neglects the challenges of coaxing out delicate analytes from the complex array of compounds found in actual marijuana,” says Laboratory Director Jason Strull. “I commend the DPBH and NDA for facilitating such an advanced quality program.”
Also notable is the announcing of their partnership with Clean Green Certified, a third-party certification (based on USDA organic certification) for sustainable, organically based cannabis cultivation. “Nevada allows certain levels of pesticides like Myclobutanil on its certified marijuana, so we wanted a way for patients and consumers to able to distinguish marijuana that is grown using organic methods,” said Laboratory Director Jason Strull. According to Michael Seibert, managing member of 374 Labs, they have already started performing inspections for the third-party certification and the first facility inspected was Silver State Trading in Sparks, Nevada (certified for both production and cultivation).
On Election Day, voters in California passed Proposition 64, establishing a recreational cannabis market and regulatory environment. While the state won’t issue the first licenses under the new regulatory scheme until 2018, the medical cannabis industry is already well established.
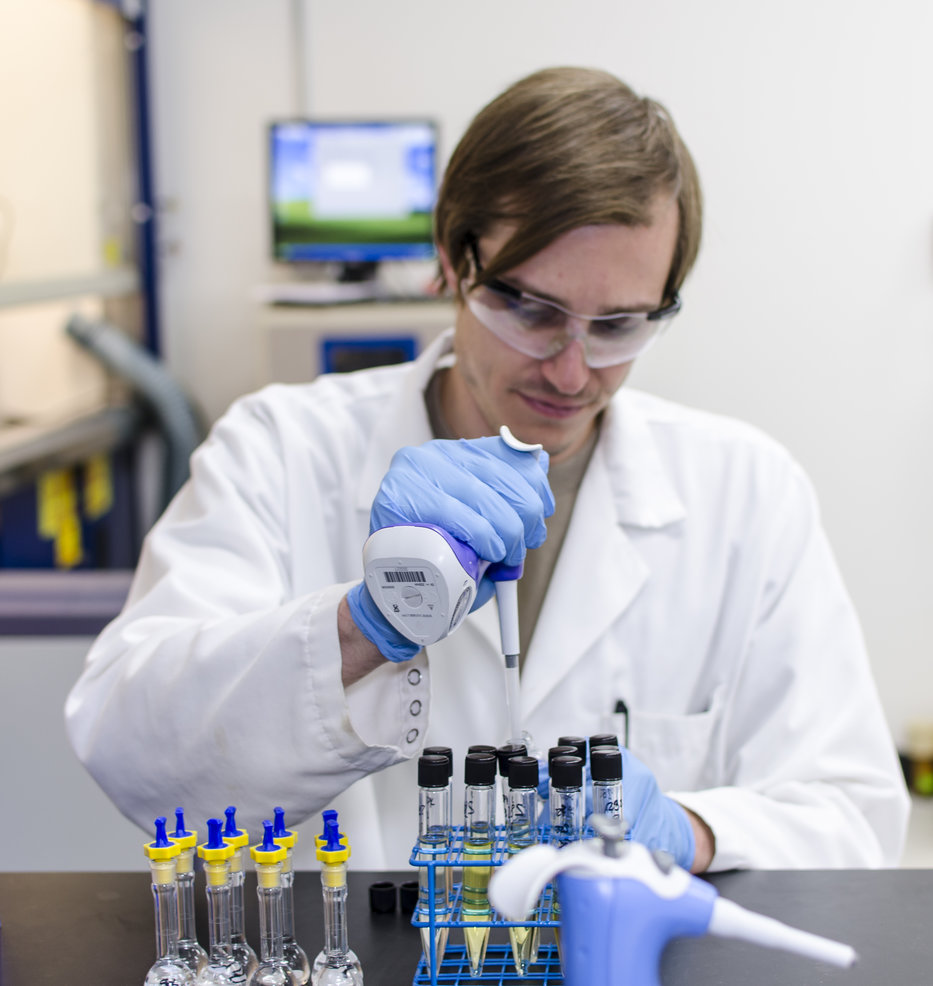
Steep Hill Labs, Inc., based in Berkeley, California, found in October that 84.3% of samples submitted tested positive for pesticide residue, according to a press release. The announcement came before Election Day, but is particularly eye opening given the massive new market created overnight by Prop 64.
Particularly concerning is their detection of Myclobutanil, which was found in more than 65% of samples submitted to the lab. According to the press release, when Myclobutanil is heated (i.e. smoked or vaporized), it is converted to Hydrogen Cyanide, which is extraordinarily toxic to humans and can be fatal in higher doses.
According to Reggie Gaudino, Ph.D., vice president of science, genetics and intellectual property at Steep Hill, their more recent study shows they detected pesticides in roughly 70% of the samples they received and 50% of those contained Myclobutanil. Gaudino says that up to a third of those samples would have failed under Oregon’s regulatory standards.
If a lab test were failed, it would contain pesticides at or higher than the required action level. Oregon’s action level, or the measured amount of pesticides in a product that the OHA deems potentially dangerous, for Myclobutanil is 0.2 parts-per-million (PPM). Steep Hill’s instrumentation has a method detection limit down to the parts-per-trillion (PPT) level, which is a more precise and smaller amount than Oregon’s action level.
“Those in the cannabis community who feel that all cannabis is safe are not correct given this data – smoking a joint of pesticide-contaminated cannabis could potentially expose the body to lethal chemicals,” says Jmichaele Keller, president and chief executive officer of Steep Hill. “As a community, we need to address this issue immediately and not wait until 2018.”
Potentially harmful pesticides, and specifically Myclobutanil, have been detected in Colorado and Washington’s recreational markets on a number of occasions, proving this is a widespread issue. Steep Hill’s release suggests that California regulators take a look at Oregon’s pesticide regulations for guidance when developing the regulatory framework.
What’s even more troubling is that not all laboratories have or had the capability of detecting pesticides at sufficiently low levels and because of this, other labs had significantly lower rates of pesticide detection, suggesting possible inconsistencies in testing methods, instrumentation, sample preparation or other variations. During a 30-day period in late September and early October, Steep Hill found, using publicly available data, or data from contracted testing, that other labs were only reporting between 3% and 21% pesticide detection.
Examination of cannabis prior to testing- credit Steep Hill Labs, Inc.
It is important to note that those samples were not identical and there could be a great degree in variation on the quality of samples sent to different laboratories, so it is not an entirely accurate comparison. Steep Hill does however detect pesticides down to the parts-per-trillion level, whereas many common methods for detecting pesticides look at the parts-per-billion level.
Reggie Gaudino says the Association of Commercial Cannabis Laboratories (ACCL) is using this data to work with Steep Hill and a number of other labs to address these issues. “As a member of the ACCL, and after discussion with ACCL, we have agreed that all future discussion of this issue should not include laboratory names, as this is about educating the industry in general, and making sure all members of the ACCL are developing the best possible methods for detecting pesticides,” says Gaudino. “The ACCL has responded to this data, by inquiring on a larger, industry-wide basis, which represents a better picture of the issue, rather than only in California’s still-technically unregulated market.” The important message is this is a major issue that needs addressing urgently. “As such, the troubling issue remains, across the larger ACCL membership, there is still detection of pesticides in at least 50% of the cannabis being tested.”
According to Jeffrey Raber, Ph.D., president of the ACCL, the industry is experiencing a pesticide problem, but it is very difficult to quantify. “It is fair to say that around 50% of the cannabis being tested contains pesticides, but we really don’t know that exact number until a much more comprehensive statistical analysis is performed,” says Raber. “We agree this is a big problem and that it needs to be addressed, but we are not sure just how big of a problem it really is.” With so much variation in labs in a state where not everyone is required to test products, it is very difficult to pin down how consistent lab results are and how contaminated the cannabis really is. “If all of the labs had the same methodology, samples and shared statistical analyses for a real study then we can look at it closely but it seems we are a ways off from that. I can say confidently however that this is a pretty significant problem that needs addressing.”
Still, Steep Hill detecting pesticides in a majority of their samples and some labs finding as little as 3% should raise some eyebrows. “Unfortunately, our recent study discovered that 84.3% of the samples assessed by our triple quadrupole mass spectrometer contained pesticides,” says Keller. “As of today, this tainted product could be sold in most dispensaries throughout the state of California without any way of informing the patients about the risks of pesticide exposure.”
These findings could mean potentially enormous health risks for medical and recreational cannabis consumers alike, unless regulators, labs and growers take quick action to address the problem.
Last week, news of problems facing Oregon’s cannabis laboratory accreditation program surfaced, leading some to speculate about possible delays for the recreational cannabis market. According to The Register-Guard, ORELAP administrator Gary Ward believed the program was “on the precipice of collapse.”
According to Jonathan Modie, spokesman for the Oregon Health Authority (OHA), the Oregon Environmental Laboratory Accreditation Program (ORELAP) was anticipating over 30 cannabis laboratories applying for accreditation and they doubled their staff from two to four to prepare for the uptick in applications.
In June, the agency had zero labs applying for accreditation but within two months, 37 labs applied. However, the Oregon Department of Environmental Quality (DEQ) just provided three additional staff members on Monday to help with the application process, says Modie.
Some believe the issues could mean the state may not have enough accredited labs by October 1st, when the recreational cannabis market is expected to go into full swing. “It is difficult to say exactly how many labs we can accredit by October 1,” says Modie. “We have seven labs today which would bring it to nine labs waiting for assessment, but our goal is to get as many labs assessed and hopefully accredited as soon as possible.”
With the additional staff members, Modie is hopeful this will jumpstart the program. “We really appreciate our collaboration with the DEQ and look forward to boosting our capacity a bit to help us get through this busy time,” says Modie.
Part of the reason some laboratories might have trouble meeting prerequisites is simply because the requirements are very strict. “The process involves submitting a quality manual, standard operating procedures, method validation, submitting proficiency testing data and finally undergoing an ORELAP assessment by our staff, so it is a very rigorous process,” says Modie. “This speaks to our concern for making sure they have the right systems in place so public health is protected.” Modie said there were at least three labs that did not pass the assessment.
Roger Voelker, lab director at OG Analytical
Bethany Sherman, chief executive officer of OG Analytical, believes the hardest part of the process involves getting accredited for testing pesticides. OG Analytical, based in Eugene, Oregon, has already received their accreditation, one of the first to do so. “The pesticide testing requires our most expensive instrumentation and the sample preparation for testing pesticides is the most time consuming,” says Sherman. “Not only does it require very specific instrumentation, it also requires a real know-how and expertise to ensure we are cleaning samples appropriately, minimizing background noise and looking at the pesticides in trace quantities.” According to Sherman, laboratories are also left to their own devices to develop methodologies specifically for the cannabis matrix, adding to the difficulties.
Rodger Voelker, Ph.D., lab director at OG Analytical, seems confident that the state will be able to handle it. “It is a relief they were able to get some resources from the DEQ and I think the state will not allow a program with this kind of importance to fall apart,” says Voelker. He believes after this initial phase of putting the program in place, the workload will go down. “It is easier to maintain a program than it is to implement,“ adds Voelker. In his eyes, it is crucial for the program to require rigorous science. “People are forced to reconcile that there is a tremendous amount of controls to be considered to produce legally defensible data and I think it is great that the requirements are so strict.”
The OHA’s job is to essentially safeguard public health and they do not want to leave any stone unturned when it comes to potential contamination, says Modie. “This is not just about getting as many labs accredited as possible, this is about protecting public health.”
Despite the title, this article is not about weight loss – it is about generating valid analytical data for quantitative analyses. In the last installment of The Practical Chemist, I introduced instrument calibration and covered a few ways we can calibrate our instruments. Just because we have run several standards across a range of concentrations and plotted a curve using the resulting data, it does not mean our curve accurately represents our instrument’s response across that concentration range. In order to be able to claim that our calibration curve accurately represents our instrument response, we have to take a look at a couple of quality indicators for our curve data:
correlation coefficient (r) or coefficient of determination (r2)
back-calculated accuracy (reported as % error)
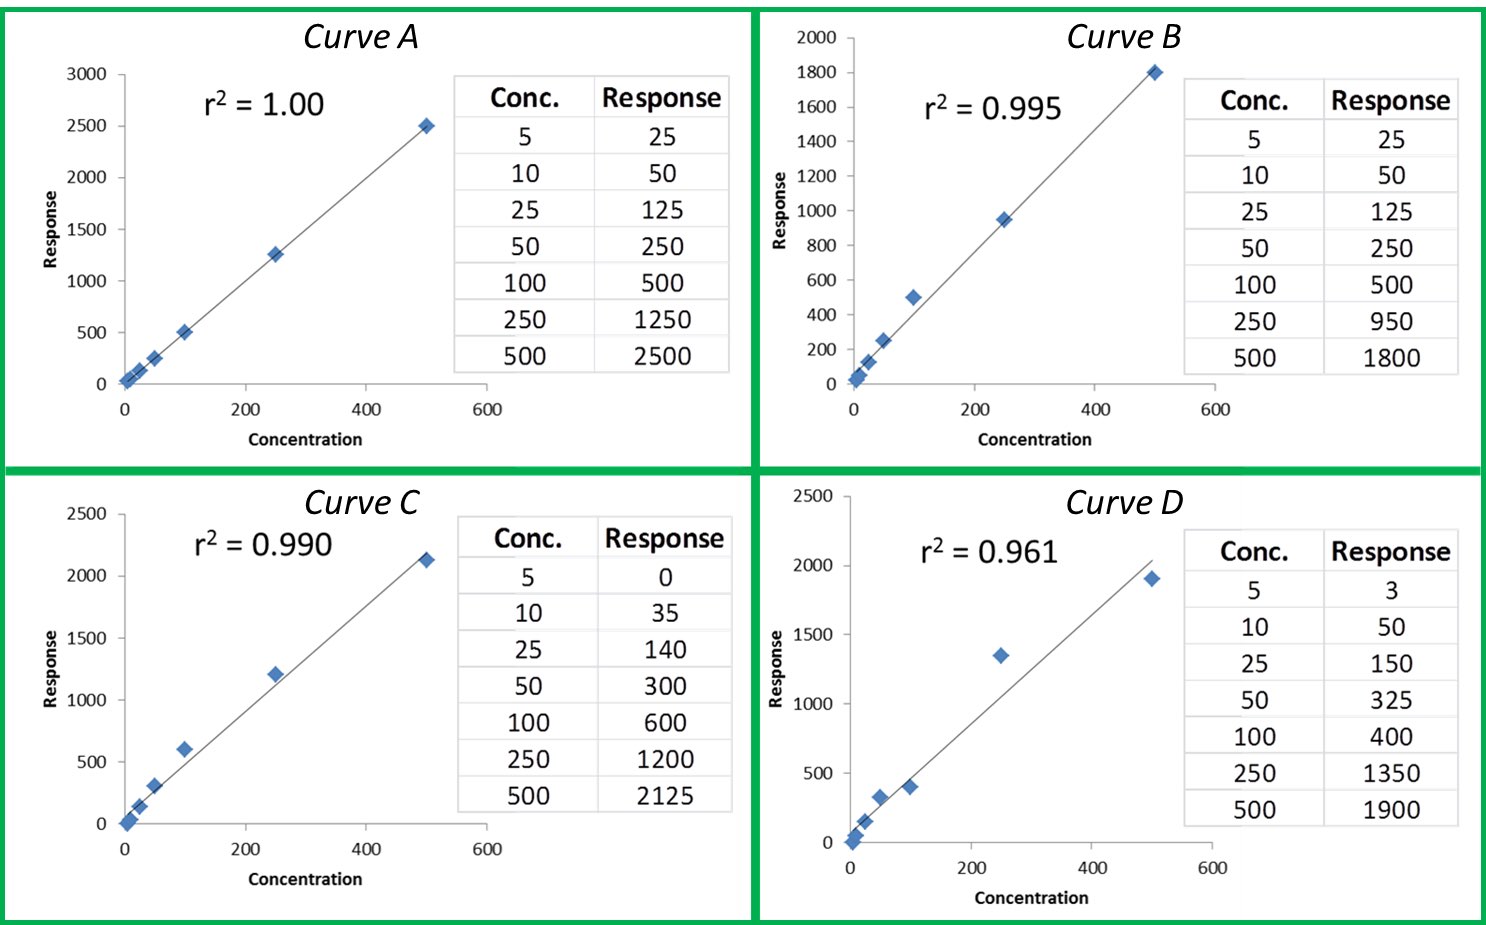
The r or r2 values that accompany our calibration curve are measurements of how closely our curve matches the data we have generated. The closer the values are to 1.00, the more accurately our curve represents our detector response. Generally, r values ≥0.995 and r2 values ≥ 0.990 are considered ‘good’. Figure 1 shows a few representative curves, their associated data, and r2 values (concentration and response units are arbitrary).
Figure 1: Representative Curves and r2 values
Let’s take a closer look at these curves:
Curve A: This represents a case where the curve perfectly matches the instrument data, meaning our calculated unknown values will be accurate across the entire calibration range.
Curve B: The r2 value is good and visually the curve matches most of the data points pretty well. However, if we look at our two highest calibration points, we can see that they do not match the trend for the rest of the data; the response values should be closer to 1250 and 2500. The fact that they are much lower than they should be could indicate that we are starting to overload our detector at higher calibration levels; we are putting more mass of analyte into the detector than it can reliably detect. This is a common problem when dealing with concentrated samples, so it can occur especially for potency analyses.
Curve C: We can see that although our r2 value is still okay, we are not detecting analytes as we should at the low end of our curve. In fact, at our lowest calibration level, the instrument is not detecting anything at all (0 response at the lowest point). This is a common problem with residual solvent and pesticide analyses where detection levels for some compounds like benzene are very low.
Curve D: It is a perfect example of our curve not representing our instrument response at all. A curve like this indicates a possible problem with the instrument or sample preparation.
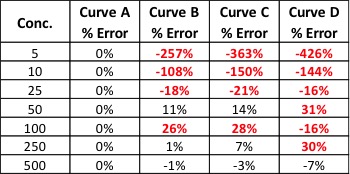
So even if our curve looks good, we could be generating inaccurate results for some samples. This brings us to another measure of curve fitness: back-calculated accuracy (expressed as % error). This is an easy way to determine how accurate your results will be without performing a single additional run.
Back-calculated accuracy simply plugs the area values we obtained from our calibrators back into the calibration curve to see how well our curve will calculate these values in relation to the known value. We can do this by reprocessing our calibrators as unknowns or by hand. As an example, let’s back-calculate the concentration of our 500 level calibrator from Curve B. The formula for that curve is: y = 3.543x + 52.805. If we plug 1800 in for y and solve for x, we end up with a calculated concentration of 493. To calculate the error of our calculated value versus the true value, we can use the equation: % Error = [(calculated value – true value)/true value] * 100. This gives us a % error of -1.4%. Acceptable % error values are usually ±15 – 20% depending on analysis type. Let’s see what the % error values are for the curves shown in Figure 1.
Table 1: % Error for Back-Calculated Values for Curves A – D
Our % error values have told us what our r2 values could not. We knew Curve D was unacceptable, but now we can see that Curves B and C will yield inaccurate results for all but the highest levels of analyte – even though the results were skewed at opposite ends of the curves.
There are many more details regarding generating calibration curves and measuring their quality that I did not have room to mention here. Hopefully, these two articles have given you some tools to use in your lab to quickly and easily improve the quality of your data. If you would like to learn more about this topic or have any questions, please don’t hesitate to contact me at amanda.rigdon@restek.com.
This website uses cookies so that we can provide you with the best user experience possible. Cookie information is stored in your browser and performs functions such as recognising you when you return to our website and helping our team to understand which sections of the website you find most interesting and useful.
Strictly Necessary Cookies
Strictly Necessary Cookie should be enabled at all times so that we can save your preferences for cookie settings.
We use tracking pixels that set your arrival time at our website, this is used as part of our anti-spam and security measures. Disabling this tracking pixel would disable some of our security measures, and is therefore considered necessary for the safe operation of the website. This tracking pixel is cleared from your system when you delete files in your history.
We also use cookies to store your preferences regarding the setting of 3rd Party Cookies.
If you disable this cookie, we will not be able to save your preferences. This means that every time you visit this website you will need to enable or disable cookies again.


 According to Susan Bunce, president of DB Labs, ISO accreditation is one way the cannabis lab space is being standardized. “As the first cannabis-testing laboratory in Nevada, DB Labs has always taken patient safety very seriously and has always tried to raise the bar,” says Bunce. “The world of cannabis testing is often compared to the Wild West: each lab uses state regulations to set their standards, but it leaves a lot of room for subjective interpretations. The ISO accreditation removes the ambiguity and guarantees a consistent level of testing to users. We are proud to be a part of that.”


 In reality, according to a