Tag Archives: MS

Terpene_KAS2
From The Lab

The Other Side of Cannabis: Terpenes

By Dr. Zacariah Hildenbrand, Allegra Leghissa, Dr. Kevin A. Schug
2 Comments
Terpene_KAS2

Have you ever wondered why all beers have that strong, characteristic smell? Or why you could tell the smell of cannabis apart from any other plant? The answer is simple – terpenes.

These 55,000 different molecules are responsible for a majority of the odors and fragrances around us, from a pine forest, to the air diffuser in your house 1–3. They all share the same precursor, isoprene, and because of that, they are all related and have similar molecular structures. Unfortunately, it is this uncanny similarity that makes their analysis so challenging; we still lack a complete list of which terpenes expected to be found in each given plant species 1,2.

Many different methods have been developed in an effort to provide a time-optimized and straightforward analysis. Gas chromatography (GC) is usually center stage due to the volatility of the terpenes. Therefore, there is significant concern with the type of GC detector used 2.

The flame ionization detector (FID) is a good quantitative detector for GC, but qualitatively it does not provide any information, except for retention time; the differentiation between terpene species is achieved solely by use of retention indices (RI), which are based on elution times from a particular GC stationary phase. The best part of the FID is its low cost, reliability, and relatively easy interface, which make it an effective tool for quality control (QC) but less so with respect to research and discovery 2.

The primary choice for a research setting is the mass spectrometer (MS) detector. It is more expensive and complicated than FID, but importantly, it provides both good quantitative capabilities, and it provides mass spectra for each species that elutes from the chromatograph. However, for terpene analysis, it may still not be the best detector choice. Since terpene class molecules share many structural and functional similarities, even their fragmentation and sub-sequential identification by MS may lead to inconsistent results, which need to be confirmed by use of RI. Still, MS is a better qualitative analysis tool than the FID, especially for distinguishing non-isobaric terpenes 2.

Recently, new technology based on vacuum ultraviolet spectroscopy (VUV) has been developed as a new GC detector. The VUV detector enables analysis of virtually all molecules; virtually all chemical compounds absorb light in the range in the 125-240 nm wavelength range probed by the detector, making it an essentially universal detector 4–11. Previously, spectroscopic absorption detectors for GC have lacked sufficient energy to measure absorption of most GC-amenable species. The VUV detector fills a niche, which is complementary to MS detection in terms of the qualitative information it provides.
Terpene_KAS2
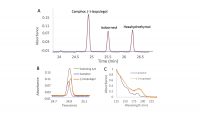
Figure 1: A, Section of the chromatographic separation of a terpenes standard mix; B, highlight of the co-eluting terpenes, camphor and (-)-isopulegol; C, differences in the absorbance spectra of camphor and (-)-isopulegol.

With the VUV detector, each compound exhibits its own unique absorbance spectrum. Even isomers and isobars, which are prevalent in terpene mixtures and can be difficult to distinguish different species by their electron ionization mass spectra, can be well differentiated based on their VUV spectra 6,9,10.  Nevertheless, because analytes exhibit different spectra, it is not required to achieve a perfect chromatographic separation of the mixture components. Co-eluting peaks can be separated post-run through the use of library spectra and software inherent to the instrument 4,10. This ability is called “deconvolution”, and it is based on the fact that two co-eluting terpenes will give a peak with an absorbance spectrum equal to the sum of the two single absorbance spectra 4. Figure 1 shows the deconvolution process for two co-eluting terpenes, camphor and (-)-isopulegol. Due to their different absorbance spectra (Figure 1C), it is possible to fully separate the two peaks in post-run, obtaining sharp peaks for both analytes 6.

The deconvolution process has been shown to yield precise and accurate results. Thus, chromatographic resolution can be sacrificed in favor of spectroscopic resolution; this enables the development of methods with faster run times. With the ability to deconvolve unresolved peaks, a long temperature ramp to chromatographically separate all isomeric terpenes is not required 6. Additionally, the presence of coeluting components, which might normally go undetected with some GC detectors, can be easily judged based on comparison of the measured spectra with pure reference spectra contained in the VUV spectral library.

The other issue in terpenes analysis is the extraction process. Terpenes can be extracted with the use of solvents (e.g., methanol, ethanol, hexane, and cyclohexane, among others), but the process is usually time-consuming, costly and not so environmentally-friendly 2. The plant needs to be manually crushed and then aliquots of solvent are used to extract components from the plant, ideally at least 3 times and combined to achieve acceptable results. The problem is that some terpenes may respond better to a certain solvent, making their extraction easier and more optimized than for others 2. The choice of solvent can cause discrimination against the extraction some terpenes, which limits the comprehensiveness of analysis.

Headspace is another technique that can be used for the sample preparation of terpenes. Headspace sampling is based on heating the solid or liquid sample inside a sealed vial, and then analyzing the air above it after sufficient equilibration. In this way, only volatile analytes are extracted from the solid/liquid sample into the gas phase; this allows relatively interference-free sampling 12–14.

How do we know whether our extraction analysis methods are correct and comprehensive for a certain plant sample? Unfortunately, there is not a complete list of available molecules for each plant species, and even if two specimens may smell really similar to our nose, their terpenes profiles may be notably different. When working with a new plant material, it is difficult to predict the extraction efficiency for the vast array of terpenes that may be present. We can only perform it with different extraction and detection methods, and compare the results.

The route for a comprehensive and fast analysis of terpenes is therefore still long; however, their intoxicating aromas and inherent medicinal value has provided a growing impetus for researchers around the world. Considering the evolving importance of Cannabis and the growing body of evidence on the synergistic effects between terpenes and cannabinoids, it is likely that newly improved extraction and analysis methods will be developed, paving the way for a more complete list of terpene species that can be found in different cultivars. The use of new analytical technologies, such as the VUV detector for GC, should aid considerably in this endeavor.


References:

[1]          Breitmaier E., Terpenes: Flavors, Fragrances, Pharmaca, Pheromones. John Wiley & Sons 2006.

[2]          Leghissa A., Hildenbrand Z. L., Schug K. A., A Review of Methods for the Chemical Characterization of Cannabis Natural Products. J. Sep. Sci.2018, 41, 398–415 .

[3]          Benvenuto E., Misra B. B., Stehle F., Andre C. M., Hausman J.-F., Guerriero G., Cannabis sativa: The Plant of the Thousand and One Molecules. Front. Plant Sci2016, 719, DOI: 10.3389/fpls.2016.00019.

[4]          Schug K. A., Sawicki I., Carlton D. D., Fan H.,Mcnair H. M.,Nimmo J. P., Kroll P.,Smuts J.,Walsh P., Harrison D., Vacuum Ultraviolet Detector for Gas Chromatography. Anal. Chem.2014, 86, 8329–8335 .

[5]          Fan H.,Smuts J., Walsh P.,Harrison D., Schug K. A., Gas chromatography-vacuum ultraviolet spectroscopy for multiclass pesticide identification. J. Chromatogr. A2015, DOI: 10.1016/j.chroma.2015.02.035.

[6]          Qiu C.,Smuts J., Schug K. A., Analysis of terpenes and turpentines using gas chromatography with vacuum ultraviolet detection. J. Sep. Sci.2017, 40, 869–877 .

[7]          Leghissa A., Smuts J., Qiu C., Hildenbrand Z. L., Schug K. A., Detection of cannabinoids and cannabinoid metabolites using gas chromatography-vacuum ultraviolet spectroscopy. Sep. Sci. Plus2018, 1.

[8]          Bai L.,Smuts J., Walsh P., Fan H., Hildenbrand Z., Wong D., Wetz D., Schug K. A., Permanent gas analysis using gas chromatography with vacuum ultraviolet detection. J. Chromatogr. A2015,1388, 244–250 .

[9]          Skultety L., Frycak P., Qiu C.,Smuts J., Shear-Laude L., Lemr K., Mao J. X., Kroll P., Schug K. A., Szewczak A., Vaught C., Lurie I., Havlicek V., Resolution of isomeric new designer stimulants using gas chromatography – Vacuum ultraviolet spectroscopy and theoretical computations. Anal. Chim. Acta2017, 971, 55–67 .

[10]       Bai L., Smuts J., Walsh P., Qiu C., McNair H. M., Schug K. ., Pseudo-absolute quantitative analysis using gas chromatography–vacuum ultraviolet spectroscopy–a tutorial. Anal. Chim. Acta2017, 953, 10–22 .

[11]       Schenk J., Nagy G., Pohl N. L. B., Leghissa A., Smuts J., Schug K. A., Identification and deconvolution of carbohydrates with gas chromatography-vacuum ultraviolet spectroscopy. J. Chromatogr. A2017, 1513, 210–221 .

[12]       Van Opstaele F., De Causmaecker B., Aerts G., De Cooman L., Characterization of novel varietal floral hop aromas by headspace solid phase microextraction and gas chromatography-mass spectrometry/olfactometry. J. Agric. Food Chem.2012, 60, 12270−12281 .

[13]       Hamm S., Bleton J., Connan J., Tchapla A., A chemical investigation by headspace SPME and GC-MS of volatile and semi-volatile terpenes in various olibanum samples. Phytochemistry2005,66, 1499–1514 .

[14]       Aberl A., Coelhan M., Determination of volatile compounds in different hop Varieties by headspace-trap GC/MS-in comparison with conventional hop essential oil analysis. J. Agric. Food Chem.2012, 60, 2785−2792 .

Soapbox

Poland Legalizes Medical Cannabis

By Marguerite Arnold
1 Comment

Poland has now legalized cannabis for medical purposes.

That said, it will be some time before patients have access to the drug. While Poles can now technically access medical pot, the scheme approved by the Polish Parliament that went into effect on November 1st is regressive, to say the least. Certainly compared with even other countries in Europe that are now finally admitting that cannabis is a drug with medical efficacy, the Polish experiment looks “old-fashioned.”

What Does Medical Cannabis Reform Look Like in Poland?

Like most conservative countries, Poland is sticking with a highly restrictive approach that still puts patients in the hot seat. In addition to getting a doctor’s prescription, the chronically ill must be approved by a state authority – a regional pharmaceutical inspector. They must get a license first, in other words. They must then find about $500 a month to pay for cannabis. To put this in perspective, that is roughly the total amount such patients get from the state to live on each month.

Warsaw, Poland
Image: Nikos Roussos, Flickr

The multiple steps mean that only patients with financial resources– and an illness which is chronic but still allows them to negotiate the many government hurdles, including cost –will now be able to access medical cannabis. Unlike Germany which makes no such distinctions, Polish law now recognizes the drug as an effective form of treatment only for chronic pain, chemo-induced nausea, MS and drug-resistant epilepsy.

The heavily amended legislation also outlaws home growing. And while 90% of pharmacies will be able to dispense the drug, this is again, a technicality. Where will the pharmacies get the cannabis in the first place?

So the question remains: will this step really mean reform? There is no medical cultivation planned. And no companies (yet) have been licensed to import the drug.

This is what is clear. Much like the conversation in Georgia and other southern American states several years ago, legislators are bowing to popular demand if not scientific evidence, to legalize medical use. But patients still cannot get it – even if they jump through all the hoops.

In Poland, patients who cannot find legal cannabis in the country (which is all of them at this point) now do have the right to travel to other EU countries in search of medicine. But the unanswered question in all of this is still present. How, exactly is this supposed to work? Patients must come up with the money to pay for their medical cannabis (at local prices) plus regular transportation costs. Then they must pay sky high fees to access local doctors (if they can find them) at “retail cost” uncovered by any insurance.

The issue of countries legalizing cannabis on paper, but not in action, is a problem now facing legalization advocates in the EUThe most obvious route for Polish patients with resources and the ability to travel is Germany. The catch? Medical cannabis costs Just on this front, the idea of regular country hopping for script refills – even if “just” across the border – is ludicrous. And who protect such patients legally if caught at the border, with a three month supply?

Poland, in other words, has adopted something very similar to Georgia’s regulations circa 2015. Medical cannabis is now technically legal but still inaccessible because of cost and logistics. Reform, Polish-style, appears to actually just be more window-dressing.

And while it is an obvious step for the country to start issuing import licenses to Canadian, Israeli and Australian exporters, how long will that take?

The Next Step Of Reform – Unfettered Patient Access

While things are still bad in Poland, right across the border in Germany where presumably Polish patients could theoretically buy their medical cannabis, all is still not copacetic. Even for the “locals.” Germany’s situation remains dire. But even before legalization in March, Germany was importing bud cannabis from Holland and began a trickle of imports last summer from Canada. That trickle has now expanded considerably with new import licences this year. And presumably, although nobody is sure, there will be some kind of domestic cultivation by 2019.

At Deutsche Hanfverband’s Cannabis Normal activist’s conference in Berlin held on the same weekend as Poland decided to legalize medical cannabis, a Gen X patient expressed his frustration with the situation of legalization in general. Oliver Waack-Jurgensen is now suing his German public insurer. He expects to wait another year and a half before he wins. In the meantime, he is organizing other patients. “They [political representatives] are bowing to political expediency but completely ignoring patient needs,” says Waack-Jurgensen. “How long is this conversation going to take? I am tired of it. Really, really tired of this.”

The issue of countries legalizing cannabis on paper, but not in action, is a problem now facing legalization advocates in the EU and elsewhere who have achieved legislative victories, but still realize this is an unfinished battle. Germany is the only country in Europe with a federal mandate to cover the drug under insurance (for Germans only). And that process is taking time to implement.But even in Germany, patients are having to sue their insurance companies

Germany, Italy and Turkey are also the only countries in Europe as of now with any plans to grow the drug domestically under a federally mandated regulation scheme. Import from Holland, Canada and even Australia appears to be the next step in delaying full and unfettered reform in Europe. See Croatia, Slovenia and Bosnia. How Spanish or Portuguese-grown cannabis will play into this discussion is also an open question mark. Asking Polish patients suffering from cancer to “commute” to Portugal is also clearly unfeasible.

Unlike the United States, however, European countries do have public healthcare systems, which are supposed to cover the majority of the population. What gives? And what is likely to happen?

A Brewing Battle At The EU Human Rights Court?

While the Polish decision to “legalize” medical use is a step in the right direction, there is still a long way to go. If the idea is to halt the black market trade, giving patients real access is a good idea. But even in Germany, patients are having to sue their insurance companies. And are now doing so in large numbers. In a region where lawsuits are much less common than the U.S., this is shocking enough.

But the situation is so widespread and likely to continue for some time, that class action lawsuits – and on the basis of human rights violations over lack of access to a life-saving drug – may finally come to the continent and at an EU (international) level court.

Patients are literally dying in the meantime. And those who aren’t are joining the calls for hunger strikes and other direct civil action. Sound far-fetched? There is legal precedent. See Mexico.

And while Poland may or may not be the trigger for this kind of concerted legal action, this idea is clearly gathering steam in advocacy circles across Europe.

Quality Assurance In The Field: Instruments For Growers & Processors

By Aaron G. Biros
2 Comments

As the cannabis marketplace evolves, so does the technology. Cultivators are scaling up their production and commercial-scale operations are focusing more on quality. That greater attention to detail is leading growers, extractors and infused product manufacturers to use analytical chemistry as a quality control tool.

Previously, using analytical instrumentation, like mass spectrometry (MS) or gas chromatography (GC), required experience in the laboratory or with chromatography, a degree in chemistry or a deep understanding of analytical chemistry. This leaves the testing component to those that are competent enough and scientifically capable to use these complex instruments, like laboratory personnel, and that is still the case. As recent as less than two years ago, we began seeing instrument manufacturers making marketing claims that their instrument requires no experience in chromatography.

Instrument manufacturers are now competing in a new market: the instrument designed for quality assurance in the field. These instruments are more compact, lighter and easier to use than their counterparts in the lab. While they are no replacement for an accredited laboratory, manufacturers promise these instruments can give growers an accurate estimate for cannabinoid percentages. Let’s take a look at a few of these instruments designed and marketed for quality assurance in the field, specifically for cannabis producers.

Ellutia GC 200 Series

Shamanics, a cannabis extractor in Amsterdam, uses Ellutia’s 200 series for QA testing

Ellutia is an instrument manufacturer from the UK. They design and produce a range of gas chromatographs, GC accessories, software and consumables, most of which are designed for use in a laboratory. Andrew James, marketing director at Ellutia, says their instrument targeting this segment was originally designed for educational purposes. “The GC is compact in size and lightweight in stature with a full range of detectors,” says James. “This means not only is it portable and easy to access but also easy to use, which is why it was initially intended for the education market.”

Andrew James, marketing director at Ellutia

That original design for use in teaching, James says, is why cannabis producers might find it so user-friendly. “It offers equivalent performance to other GC’s meaning we can easily replace other GC’s performing the same analysis, but our customers can benefit from the lower space requirement, reduced energy bills, service costs and initial capital outlay,” says James. “This ensures the lowest possible cost of ownership, decreasing the cost per analysis and increasing profits on every sample analyzed.”

Shamanics, a cannabis oil extraction company based in Amsterdam, uses Ellutia’s 200 series for quality assurance in their products. According to Bart Roelfsema, co-founder of Shamanics, they have experienced a range of improvements in monitoring quality since they started using the 200 series. “It is very liberating to actually see what you are doing,” says Roelfsema. “If you are a grower, a manufacturer or a seller, it is always reassuring to see what you have and prove or improve on your quality.” Although testing isn’t commonplace in the Netherlands quite yet, the consumer demand is rising for tested products. “We also conduct terpene analysis and cannabinoid acid analysis,” says Roelfsema. “This is a very important aspect of the GC as now it is possible to methylate the sample and test for acids; and the 200 Series is very accurate, which is a huge benefit.” Roelfsema says being able to judge quality product and then relay that information to retail is helping them grow their business and stay ahead of the curve.

908 Devices G908 GC-HPMS

908 Devices, headquartered in Boston, is making a big splash in this new market with their modular G908 GC-HPMS. The company says they are “democratizing chemical analysis by way of mass spectrometry,” with their G908 device. That is a bold claim, but rather appropriate, given that MS used to be reserved strictly for the lab environment. According to Graham Shelver, Ph.D., commercial leader for Applied Markets at 908 Devices Inc., their company is making GC-HPMS readily available to users wanting to test cannabis products, who do not need to be trained analytical chemists.

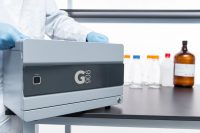
The G908 device.

Shelver says they have made the hardware modular, letting the user service the device themselves. This, accompanied by simplified software, means you don’t need a Ph.D. to use it. “The “analyzer in a box” design philosophy behind the G908 GC-HPMS and the accompanying JetStream software has been to make using the entire system as straightforward as possible so that routine tasks such as mass axis calibration are reduced to simple single actions and sample injection to results reporting becomes a single button software operation,” says Shelver.

He also says while it is designed for use in the field, laboratories also use it to meet higher-than-usual demand. Both RM3 Labs in Colorado, and ProVerde in Massachusetts, use G908. “RM3’s main goal with the G908 is increased throughput and ProVerde has found it useful in adding an orthogonal and very rapid technique (GC-HPMS) to their suite of cannabis testing instruments,” says Shelver.

Orange Photonics LightLab Cannabis Analyzer

Orange Photonics’ LightLab Cannabis Analyzer

Dylan Wilks, a third generation spectroscopist, launched Orange Photonics with his team to produce analytical tools that are easy to use and can make data accessible where it has been historically absent, such as onsite testing within the cannabis space. According to Stephanie McArdle, president of Orange Photonics, the LightLab Cannabis Analyzer is based on the same principles as HPLC technology, combining liquid chromatography with spectroscopy. Unlike an HPLC however, LightLab is rugged, portable and they claim you do not need to be a chemist to use it.

“LightLab was developed to deliver accurate repeatable results for six primary cannabinoids, D9THC, THC-A, CBD, CBD-A, CBG-A and CBN,” says McArdle. “The sample prep is straightforward: Prepare a homogenous, representative sample, place a measured portion in the provided vial, introduce extraction solvent, input the sample into LightLab and eight minutes later you will have your potency information.” She says their goal is to ensure producers can get lab-grade results.

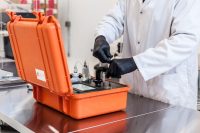
The hard plastic case is a unique feature of this instrument

McArdle also says the device is designed to test a wide range of samples, allowing growers, processors and infused product manufacturers to use it for quality assurance. “Extracts manufacturers use LightLab to limit loss- they accurately value trim purchases on the spot, they test throughout their extraction process including tests on spent material (raffinate) and of course the final product,” says McArdle. “Edibles manufacturers test the potency of their raw ingredients and check batch dosing. Cultivators use LightLab for strain selection, maturation monitoring, harvesting at peak and tinkering.”

Orange Photonics’ instrument also connects to devices via Wi-Fi and Bluetooth. McArdle says cannabis companies throughout the supply chain use it. “We aren’t trying to replace lab testing, but anyone making a cannabis product is shooting in the dark if they don’t have access to real time data about potency,” says McArdle.

The Practical Chemist

Instrumentation Used for Terpene Analysis

By Tim Herring
2 Comments

Terpenes are a group of volatile, unsaturated hydrocarbons found in the essential oils of plants. They are responsible for the characteristic smells and flavors of most plants, such as conifers, citrus, as well as cannabis. Over 140 terpenes have been identified to date and these unique compounds may have medicinal properties. Caryophyllene, for example, emits a sweet, woody, clove taste and is believed to relieve inflammation and produce a neuroprotective effect through CB2 receptor activation. Limonene has a citrus scent and may possess anti-cancer, anti-bacterial, anti-fungal and anti-depression effects. Pinene is responsible for the pine aroma and acts as a bronchodilator. One theory involving terpenes is the Entourage Effect, a synergistic benefit from the combination of cannabinoids and terpenes.

Many customers ask technical service which instrumentation is best, GC or HPLC, for analysis of terpenes. Terpenes are most amenable to GC, due to their inherent volatility. HPLC is generally not recommended; since terpenes have very low UV or MS sensitivity; the cannabinoids (which are present in percent levels) will often interfere or coelute with many of the terpenes.

Figure 1: Terpene profile via headspace, courtesy of ProVerde Laboratories.

Headspace (HS), Solid Phase Microextraction of Headspace (HS-SPME) or Split/Splitless Injection (SSI) are viable techniques and have advantages and disadvantages. While SPME can be performed by either direct immersion with the sample or headspace sampling, HS-SPME is considered the most effective technique since this approach eliminates the complex oil matrix. Likewise, conventional HS also targets volatiles that include the terpenes, leaving the high molecular weight oils and cannabinoids behind (Figure 1). SSI eliminates the complexity of a HS or SPME concentrator/autosampler, however, sensitivity and column lifetime become limiting factors to high throughput, since the entire sample is introduced to the inlet and ultimately the column.

The GC capillary columns range from thicker film, mid-polarity (Rxi-624sil MS for instance) to thinner film, non-polar 100% polysiloxane-based phases, such as an Rxi-1ms. A thicker film provides the best resolution among the highly volatile, early eluting compounds, such as pinene. Heavier molecular weight compounds, such as the cannabinoids, are difficult to bake off of the mid-polarity phases. A thinner, non-polar film enables the heavier terpenes and cannabinoids to elute efficiently and produces sharp peaks. Conversely the early eluting terpenes will often coelute using a thin film column. Columns that do not contain cyano-functional groups (Rxi-624Sil MS), are more robust and have higher temperature limits and lower bleed.

For the GC detector, a Mass Spectrometer (MS) can be used, however, many of the terpenes are isobars, sharing the same ions used for identification and quantification. Selectivity is the best solution, regardless of the detector. The Flame Ionization Detector (FID) is less expensive to purchase and operate and has a greater dynamic range, though it is not as sensitive, nor selective for coeluting impurities.

By accurately and reproducibly quantifying terpenes, cannabis medicines can be better characterized and controlled. Strains, which may exhibit specific medical and psychological traits, can be identified and utilized to their potential. The lab objectives, customer expectations, state regulations, available instrumentation, and qualified lab personnel will ultimately determine how the terpenes will be analyzed.

Chris English
The Practical Chemist

Accurate Detection of Residual Solvents in Cannabis Concentrates

By Chris English
2 Comments
Chris English

Edibles and vape pens are rapidly becoming a sizable portion of the cannabis industry as various methods of consumption popularize beyond just smoking dried flower. These products are produced using cannabis concentrates, which come in the form of oils, waxes or shatter (figure 1). Once the cannabinoids and terpenes are removed from the plant material using solvents, the solvent is evaporated leaving behind the product. Extraction solvents are difficult to remove in the low percent range so the final product is tested to ensure leftover solvents are at safe levels. While carbon dioxide and butane are most commonly used, consumer concern over other more toxic residual solvents has led to regulation of acceptable limits. For instance, in Colorado the Department of Public Health and Environment (CDPHE) updated the state’s acceptable limits of residual solvents on January 1st, 2017.

Headspace Analysis

Figure 1: Shatter can be melted and dissolved in a high molecular weight solvent for headspace analysis (HS). Photo Courtesy of Cal-Green Solutions.

Since the most suitable solvents are volatile, these compounds are not amenable to HPLC methods and are best suited to gas chromatography (GC) using a thick stationary phase capable of adequate retention and resolution of butanes from other target compounds. Headspace (HS) is the most common analytical technique for efficiently removing the residual solvents from the complex cannabis extract matrix. Concentrates are weighed out into a headspace vial and are dissolved in a high molecular weight solvent such as dimethylformamide (DMF) or 1,3-dimethyl-3-imidazolidinone (DMI). The sealed headspace vial is heated until a stable equilibrium between the gas phase and the liquid phase occurs inside the vial. One milliliter of gas is transferred from the vial to the gas chromatograph for analysis. Another approach is full evaporation technique (FET), which involves a small amount of sample sealed in a headspace vial creating a single-phase gas system. More work is required to validate this technique as a quantitative method.

Gas Chromatographic Detectors

The flame ionization detector (FID) is selective because it only responds to materials that ionize in an air/hydrogen flame, however, this condition covers a broad range of compounds. When an organic compound enters the flame; the large increase in ions produced is measured as a positive signal. Since the response is proportional to the number of carbon atoms introduced into the flame, an FID is considered a quantitative counter of carbon atoms burned. There are a variety of advantages to using this detector such as, ease of use, stability, and the largest linear dynamic range of the commonly available GC detectors. The FID covers a calibration of nearly 5 orders of magnitude. FIDs are inexpensive to purchase and to operate. Maintenance is generally no more complex than changing jets and ensuring proper gas flows to the detector. Because of the stability of this detector internal standards are not required and sensitivity is adequate for meeting the acceptable reporting limits. However, FID is unable to confirm compounds and identification is only based on retention time. Early eluting analytes have a higher probability of interferences from matrix (Figure 2).

Figure 2: Resolution of early eluting compounds by headspace – flame ionization detection (HS-FID). Chromatogram Courtesy of Trace Analytics.

Mass Spectrometry (MS) provides unique spectral information for accurately identifying components eluting from the capillary column. As a compound exits the column it collides with high-energy electrons destabilizing the valence shell electrons of the analyte and it is broken into structurally significant charged fragments. These fragments are separated by their mass-to-charge ratios in the analyzer to produce a spectral pattern unique to the compound. To confirm the identity of the compound the spectral fingerprint is matched to a library of known spectra. Using the spectral patterns the appropriate masses for quantification can be chosen. Compounds with higher molecular weight fragments are easier to detect and identify for instance benzene (m/z 78), toluene (m/z 91) and the xylenes (m/z 106), whereas low mass fragments such as propane (m/z 29), methanol (m/z 31) and butane (m/z 43) are more difficult and may elute with matrix that matches these ions. Several disadvantages of mass spectrometers are the cost of equipment, cost to operate and complexity. In addition, these detectors are less stable and require an internal standard and have a limited dynamic range, which can lead to compound saturation.

Regardless of your method of detection, optimized HS and GC conditions are essential to properly resolve your target analytes and achieve the required detection limits. While MS may differentiate overlapping peaks the chances of interference of low molecular weight fragments necessitates resolution of target analytes chromatographically. FID requires excellent resolution for accurate identification and quantification.

The Practical Chemist

Pesticide Analysis in Cannabis and Related Products: Part 3

By Julie Kowalski
No Comments

As mentioned in Part 1, pesticides residue analysis is very challenging especially considering the complexity of cannabis and the variety of flower, concentrates and infused products. In addition, pesticides are tested at low levels typically at parts-per-billion (ppb). For example, the food safety industry often uses 10 ppb as a benchmark limit of quantification. To put that in perspective, current pesticides limits in cannabis range from 10 ppb default (Massachusetts Regulatory Limit) to a more typical range of 100 ppb to 2 ppm in other states. Current testing is also complicated by evolving regulations.

Despite these challenges, adaptation of methods used by the food safety industry have proved successful for testing pesticides in cannabis. These methods typically rely on mass spectrometric detection paired with sample preparation methods to render the sample clean enough to yield quality data.

Pesticide Analysis Methods: Sample preparation and Analytical Technique Strategy

Generally, methods can be divided into two parts; sample preparation and analytical testing where both are critical to the success of pesticide residue testing and are inextricably linked. Reliance on mass spectrometric techniques like tandem mass spectrometry and high resolution accurate mass (HRAM) mass spectrometry is attributed to the substantial sensitivity and selectivity provided. The sensitivity and selectivity achievable by the detector largely dictates the sample preparation that will be required. The more sensitive and selective the detector, the less rigorous and resource intensive sample preparation can be.

Analytical technique: Gas and Liquid Chromatography Tandem Mass Spectrometry 

The workhorse approach for pesticide residue analysis involves using gas chromatography and liquid chromatography tandem mass spectrometry (MS/MS) in the ion transition mode. This ion transition mode, often referred to as multiple reaction monitoring (MRM) or selected reaction monitoring (SRM), adds the selectivity and sensitivity needed for trace level analysis. Essentially, a pesticide precursor ion is fragmented into product ions. The detector monitors the signal for a specified product ion known to have originated from the pesticide precursor ion. This allows the signal to be corrected, associated with the analyte and not with other matrix components in the sample. In addition, because only ions meeting the precursor/product ion requirements are passed to the detector with little noise, there is a benefit to the observed signal to noise ratio allowing better sensitivity than in other modes. Even though ion transitions are specific, there is the possibility a matrix interference that also demonstrates that same ion transition could result in a false positive. Multiple ion transitions for each analyte are monitored to determine an ion ratio. The ion ratio should remain consistent for a specific analyte and is used to add confidence to analyte identification.

The best choice for pesticide analysis between gas chromatography (GC) and liquid chromatography (LC) is often questioned. To perform comprehensive pesticide screening similar to the way the food safety market approaches this challenge requires both techniques. It is not uncommon for screening methods to test for several hundred pesticides that vary in physiochemical properties. It may be possible that with a smaller list of analytes, only one technique will be needed but often in order to reach the low limits for pesticide residues both GC and LC are required.

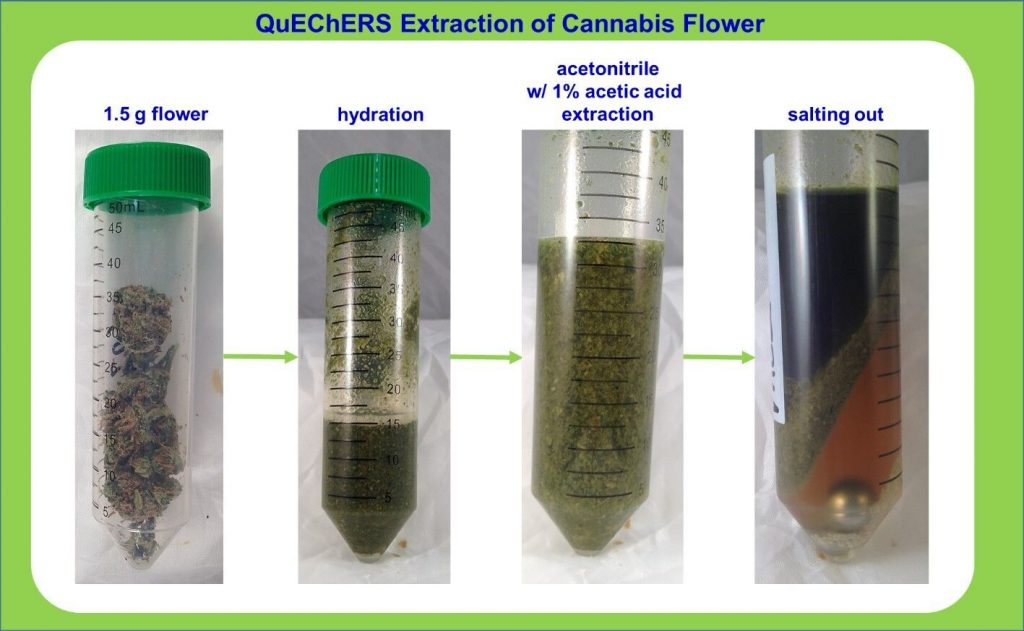
Modified QuEChERS extraction using 1.5 grams of cannabis flower. Courtesy of Julie Kowalski (Restek Corporation), Jeff Dahl (Shimadzu Scientific Instruments) and Derek Laine (Trace Analytics).

Analytical technique: Sample Preparation

Less extensive sample preparation is possible when combined with sensitive and selective detectors like MS/MS. One popular method is the QuEChERS approach. QuEChERS stands for Quick, Easy, Cheap, Effective, Rugged and Safe. It consists of a solvent extraction/salting out step followed by a cleanup using dispersive solid phase extraction. Originally designed for fruit and vegetable pesticide testing, QuEChERS has been modified and used for many other commodity types including cannabis. Although QuEChERS is a viable method, sometimes more cleanup is needed and this can be done with cartridge solid phase extraction. This cleanup functions differently and is more labor intensive, but results in a cleaner extract. A cleaner extract helps to secure quality data and is sometimes needed for difficult analyses.

The Practical Chemist

Appropriate Instrumentation for the Chemical Analysis of Cannabis and Derivative Products: Part 1

By Rebecca Stevens
1 Comment

Election Day 2016 resulted in historic gains for state level cannabis prohibition reform. Voters in California, Maine, Massachusetts and Nevada chose to legalize adult use of Cannabis sp. and its extracts while even traditionally conservative states like Arkansas, Florida, Montana and North Dakota enacted policy allowing for medical use. More than half of the United States now allows for some form of legal cannabis use, highlighting the rapidly growing need for high quality analytical testing.

For the uninitiated, analytical instrumentation can be a confusing mix of abbreviations and hyphenation that provides little obvious information about an instrument’s capability, advantages and disadvantages. In this series of articles, my colleagues and I at Restek will break down and explain in practical terms what instruments are appropriate for a particular analysis and what to consider when choosing an instrumental technique.

Potency Analysis

Potency analysis refers to the quantitation of the major cannabinoids present in Cannabis sp. These compounds are known to provide the physiological effects of cannabis and their levels can vary dramatically based on cultivation practices, product storage conditions and extraction practices.

The primary technique is high performance liquid chromatography (HPLC) coupled to ultraviolet absorbance (UV) detection. Gas chromatography (GC) coupled to a flame ionization detector (FID) or mass spectrometry (MS) can provide potency information but suffers from issues that preclude its use for comprehensive analysis.

Pesticide Residue Analysis

Pesticide residue analysis is, by a wide margin, the most technically challenging testing that we will discuss here. Trace levels of pesticides incurred during cultivation can be transferred to the consumer both on dried plant material and in extracts prepared from the contaminated material. These compounds can be acutely toxic and are generally regulated at part per billion parts-per-billion levels (PPB).

Depending on the desired target pesticides and detection limits, HPLC and/or GC coupled with tandem mass spectrometry (MS/MS) or high resolution accurate mass spectrometry (HRAM) is strongly recommended. Tandem and HRAM mass spectrometry instrumentation is expensive, but in this case it is crucial and will save untold frustration during method development.

Residual Solvents Analysis

When extracts are produced from plant material using organic solvents such as butane, alcohols or supercritical carbon dioxide there is a potential for the solvent and any other contaminants present in it to become trapped in the extract. The goal of residual solvent analysis is to detect and quantify solvents that may remain in the finished extract.

Residual solvent analysis is best accomplished using GC coupled to a headspace sample introduction system (HS-GC) along with FID or MS detection. Solid phase microextraction (SPME) of the sample headspace with direct introduction to the GC is another option.

Terpene Profile Analysis

While terpene profiles are not a safety issue, they provide much of the smell and taste experience of cannabis and are postulated to synergize with the physiologically active components. Breeders of Cannabis sp. are often interested in producing strains with specific terpene profiles through selective breeding techniques.

Both GC and HPLC can be employed successfully for terpenes analysis. Mass spectrometry is suitable for detection as well as GC-FID and HPLC-UV.

Heavy Metals Analysis

Metals such as arsenic, lead, cadmium, chromium and mercury can be present in cannabis plant material due to uptake from the soil, fertilizers or hydroponic media by a growing plant. Rapidly growing plants like Cannabis sp. are particularly efficient at extracting and accumulating metals from their environment.

Several different types of instrumentation can be used for metals analysis, but the dominant technology is inductively coupled plasma mass spectrometry (ICP-MS). Other approaches can also be used including ICP coupled with optical emission spectroscopy (ICP-OES).

Rebecca is an Applications Scientist at Restek Corporation and is eager to field any questions or comments on cannabis analysis, she can be reached by e-mail, rebecca.stevens@restek.com or by phone at 814-353-1300 (ext. 2154)

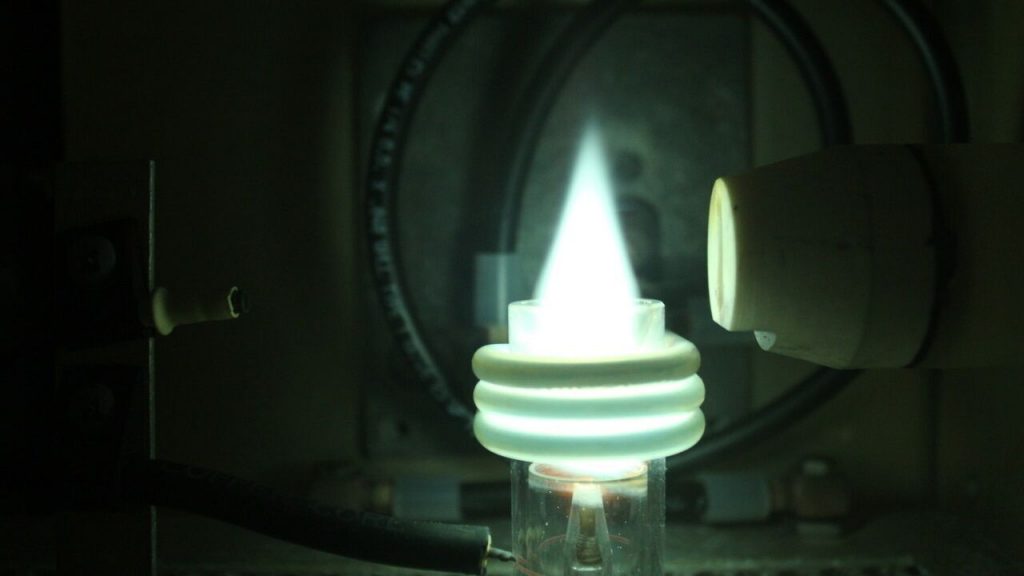
An inductively coupled plasma torch used in MS reaches local temperatures rivaling the surface of the sun. Image by W. Blanchard, Wikimedia
An inductively coupled plasma torch used in Optical Emission Spectroscopy (OES) reaches local temperatures rivaling the surface of the sun. Image by W. Blanchard, Wikimedia
amandarigdon
The Practical Chemist

Calibration Part II – Evaluating Your Curves

By Amanda Rigdon
No Comments
amandarigdon

Despite the title, this article is not about weight loss – it is about generating valid analytical data for quantitative analyses. In the last installment of The Practical Chemist, I introduced instrument calibration and covered a few ways we can calibrate our instruments. Just because we have run several standards across a range of concentrations and plotted a curve using the resulting data, it does not mean our curve accurately represents our instrument’s response across that concentration range. In order to be able to claim that our calibration curve accurately represents our instrument response, we have to take a look at a couple of quality indicators for our curve data:

  1. correlation coefficient (r) or coefficient of determination (r2)
  2. back-calculated accuracy (reported as % error)

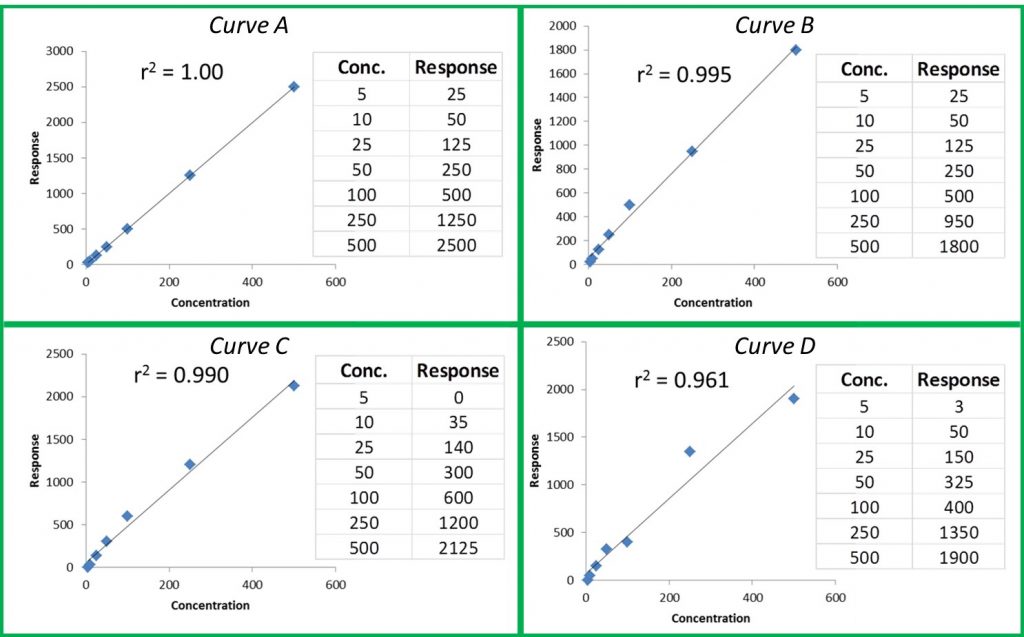
The r or r2 values that accompany our calibration curve are measurements of how closely our curve matches the data we have generated. The closer the values are to 1.00, the more accurately our curve represents our detector response. Generally, r values ≥0.995 and r2 values ≥ 0.990 are considered ‘good’. Figure 1 shows a few representative curves, their associated data, and r2 values (concentration and response units are arbitrary).

Figure 1: Representative Curves and r2 values

Let’s take a closer look at these curves:

Curve A: This represents a case where the curve perfectly matches the instrument data, meaning our calculated unknown values will be accurate across the entire calibration range.

Curve B: The r2 value is good and visually the curve matches most of the data points pretty well. However, if we look at our two highest calibration points, we can see that they do not match the trend for the rest of the data; the response values should be closer to 1250 and 2500. The fact that they are much lower than they should be could indicate that we are starting to overload our detector at higher calibration levels; we are putting more mass of analyte into the detector than it can reliably detect. This is a common problem when dealing with concentrated samples, so it can occur especially for potency analyses.

Curve C: We can see that although our r2 value is still okay, we are not detecting analytes as we should at the low end of our curve. In fact, at our lowest calibration level, the instrument is not detecting anything at all (0 response at the lowest point). This is a common problem with residual solvent and pesticide analyses where detection levels for some compounds like benzene are very low.

Curve D: It is a perfect example of our curve not representing our instrument response at all. A curve like this indicates a possible problem with the instrument or sample preparation.

So even if our curve looks good, we could be generating inaccurate results for some samples. This brings us to another measure of curve fitness: back-calculated accuracy (expressed as % error). This is an easy way to determine how accurate your results will be without performing a single additional run.

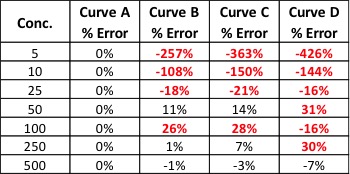
Back-calculated accuracy simply plugs the area values we obtained from our calibrators back into the calibration curve to see how well our curve will calculate these values in relation to the known value. We can do this by reprocessing our calibrators as unknowns or by hand. As an example, let’s back-calculate the concentration of our 500 level calibrator from Curve B. The formula for that curve is: y = 3.543x + 52.805. If we plug 1800 in for y and solve for x, we end up with a calculated concentration of 493. To calculate the error of our calculated value versus the true value, we can use the equation: % Error = [(calculated value – true value)/true value] * 100. This gives us a % error of -1.4%. Acceptable % error values are usually ±15 – 20% depending on analysis type. Let’s see what the % error values are for the curves shown in Figure 1.

practical chemist table 1
Table 1: % Error for Back-Calculated Values for Curves A – D

Our % error values have told us what our r2 values could not. We knew Curve D was unacceptable, but now we can see that Curves B and C will yield inaccurate results for all but the highest levels of analyte – even though the results were skewed at opposite ends of the curves.

There are many more details regarding generating calibration curves and measuring their quality that I did not have room to mention here. Hopefully, these two articles have given you some tools to use in your lab to quickly and easily improve the quality of your data. If you would like to learn more about this topic or have any questions, please don’t hesitate to contact me at amanda.rigdon@restek.com.