Tag Archives: potency

amandarigdon
The Nerd Perspective

‘Instant’ Cannabis Potency Testing: Different Approaches from Different Manufacturers

By Amanda Rigdon
5 Comments
amandarigdon

This is the first piece of a regular column that CIJ has been so kind to allow me to write for their publication. Some readers might recognize my name from The Practical Chemist column in this publication. Since the inception of that column, I’ve finally taken the plunge into the cannabis industry as chief technical officer of Emerald Scientific. Unlike The Practical Chemist, I will not spend the entire first article introducing the column. The concept is simple: while I find the textbook-esque content of The Practical Chemist scintillating, I have a feeling that the content is a little too heavy to spring on someone who is looking for engaging articles over their precious coffee break. Instead, The Nerd Perspective will consist of less-technical writing focusing on my experience and insights for the cannabis industry as a whole. But don’t worry – I’m sure I will not be able to refrain from technical jargon altogether.

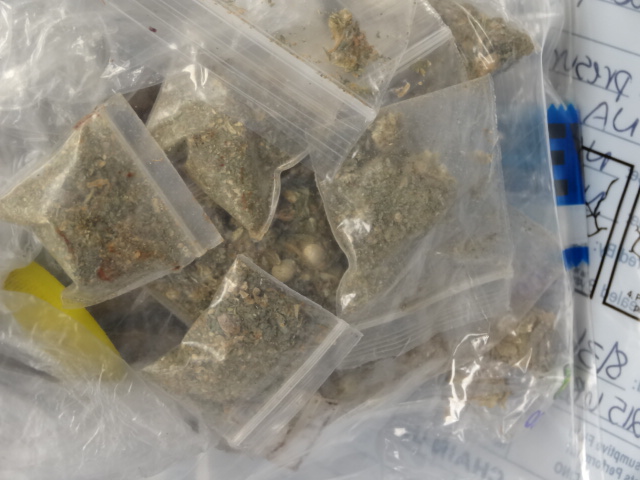
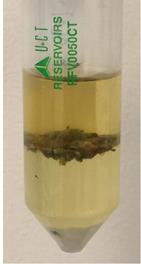
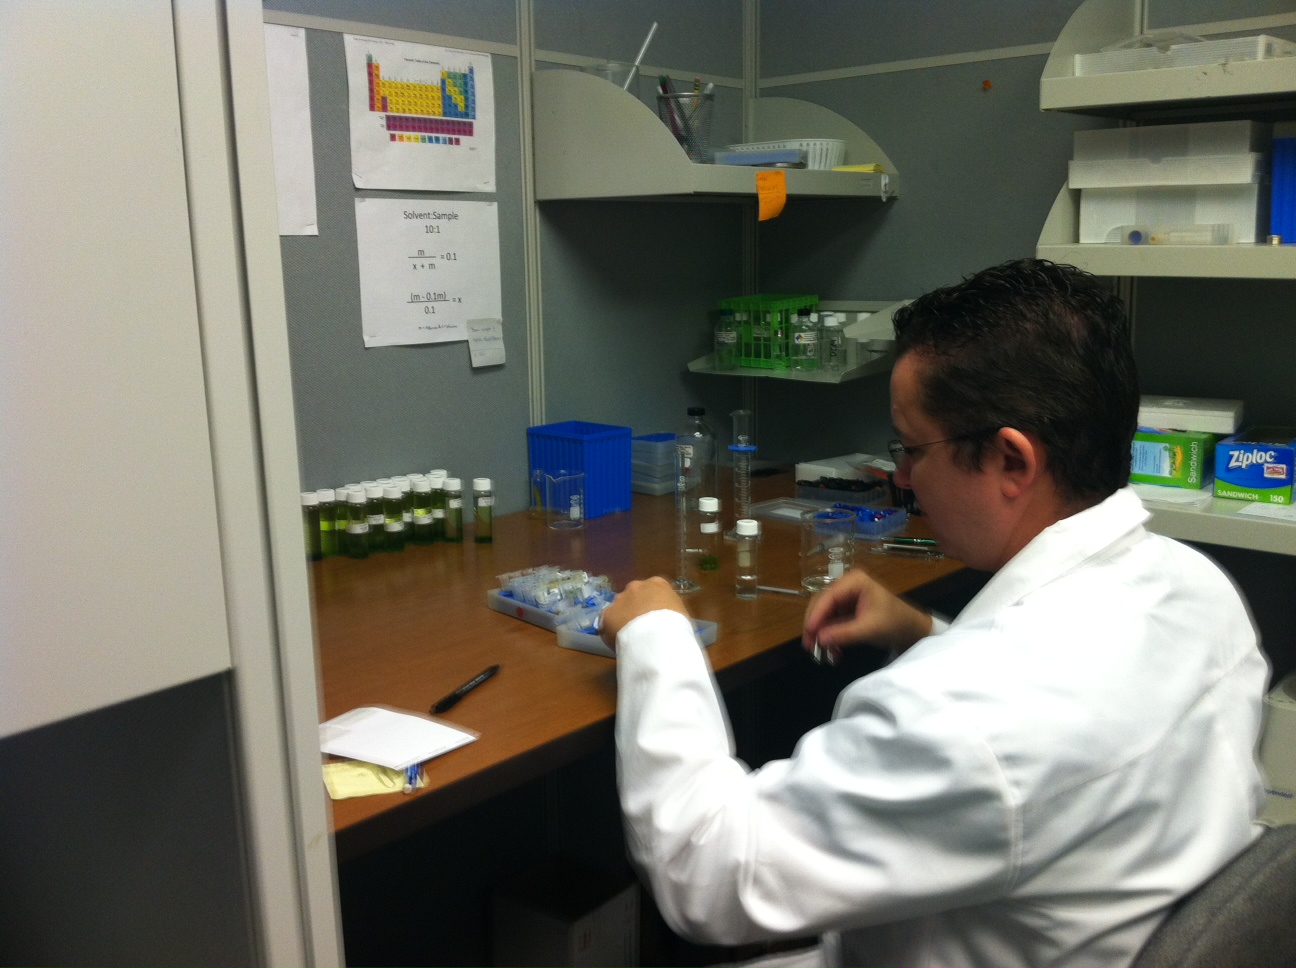
To kick off the column, I want to talk about instrumentation for ‘instant’ cannabis potency testing. At this point, it’s common knowledge in the cannabis analytics industry that the most accurate way to test cannabis potency is through extraction then analysis by HPLC-UV. I agree wholeheartedly with that sentiment, but HPLC analyses have one drawback: they can be either inexpensive or fast – not both. There are some instruments entering the market now that– while not as directly quantitative as HPLC-UV – promise to solve the inexpensive/fast conundrum. During my most recent trip to California, I was able to spend some quality time with two well-known instrument manufacturers: SRI Instruments and PerkinElmer, both of whom manufacture instruments that perform fast, inexpensive cannabis potency analyses. From my previous home at the heights of The Ivory Tower of Chromatography: Home of the Application Chemists, SRI and PE couldn’t be more different. But as seen through the eyes of a company who deals with a wide range of customers and analytical needs, it turns out that SRI and PE are much the same – not only in their open and honest support of the cannabis industry, but also in terms of their love of all things technical.

My first stop was SRI Instruments. They are a relatively small company located in an unassuming building in Torrance, CA. Only a few people work in that location, and I spent my time with Hugh Goldsmith (chief executive officer) and Greg Benedict (tech service guru). I have worked with these guys for a few years now, and since the beginning, I have lovingly referred to them as the MacGyvers of chromatography. Anyone familiar with SRI GCs knows that what they lack in aesthetics, they make up for in practicality – these instruments truly reflect Hugh and Greg’s character (that’s meant as a compliment).

SRI specializes in relatively inexpensive portable and semi-portable instruments that are easy to set up, easy to operate, and most importantly – engineered for a purpose. It’s actually really hard to manufacture an instrument that meets all three of these criteria, and the folks at SRI accomplish this with their passionate and unique approach to problem solving. What I love about these guys is that for them, nothing is impossible. Here’s an example: the price of the portable GC-FID instruments SRI builds is inflated because the instruments require separate – and pricey – hydrogen generators. That’s a big problem – hydrogen generators are all pretty much the same, and none of them are cheap. This didn’t faze SRI: they just decided to design their own super small on-board hydrogen generator capable of supplying hydrogen to a simple GC macgyver
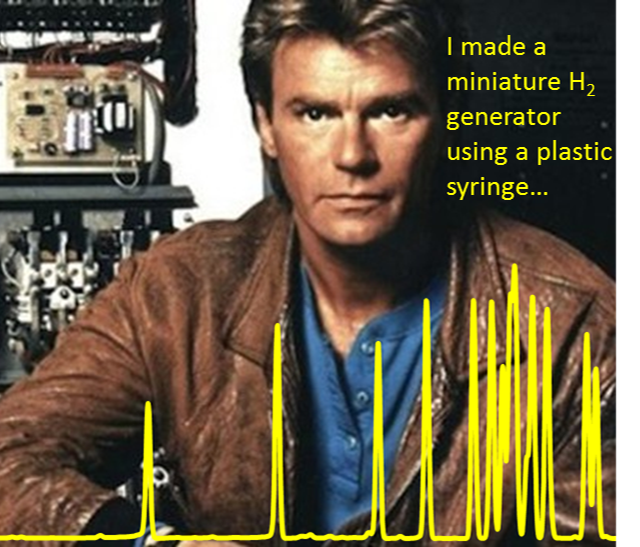
system for six hours with just 20mL of distilled water from the grocery store! I’m not kidding – I saw it in action on their new Model 420 GC (more on that in some future pieces). Was the final product pretty? Not in the least. Did it work? Absolutely. This kind of MacGyver-esque problem solving can only be done successfully with a deep understanding of the core principles behind the problem. What’s more, in order to engineer instruments like these, SRI has to have mastery over the core principles of not only chromatographic separation, but also of software development, electrical engineering, and mechanical engineering – just to name a few. These quirky, unassuming guys are smart. SRI is a company that’s been unapologetically true to themselves for decades; they’ll never be a contender for beauty queen, but they get the job done.

On the surface, PerkinElmer (PE) contrasts with SRI in almost every way possible. With revenue measured in billions of dollars and employees numbering in the thousands, PE is a behemoth that plays not only in the analytical chemistry industry but also in clinical diagnostics and other large industries. Where SRI instruments have a characteristic look of familiar homeliness, PE instruments are sleek and sexy. However, PerkinElmer and SRI are more alike than it would seem; just like the no-frills SRI, the hyper-technical PE instruments are engineered for a purpose by teams of very smart, passionate people.

DoogieWith its modest price tag and manual sample introduction, the SRI Model 420 is engineered for lower throughput users to be a fast, simple, and inexpensive approach to semi-quantitative process control. The purpose of the instruments manufactured by PE is to produce the highest-quality quantitative results as quickly as possible for high-throughput labs. PE instruments are built using the best technology available in order to eke out every last ounce of quantitative accuracy and throughput possible. Fancy technology is rarely inexpensive, and neither is rigorous product development that can last years in some cases. In a way, PE is Doogie Howser to SRI’s MacGyver. Like MacGyver, Doogie is super smart, and his setting is a sterile hospital rather than a warzone.

I had a wonderful conversation with Tim Ruppel, PE’s headspace-GC specialist, on the sample introduction technology incorporated into the TurboMatrix Headspace Sampler, where I also learned that the basic technology for all PerkinElmer headspace-GC instruments was designed by the men who wrote The Book on headspace gas chromatography: Bruno Kolb and Leslie Ettre**. Later, I was able to get a much-needed lesson on FT-IR and the Spectrum Two IR Spectrometer from Brian Smith, PE’s spectroscopy expert, who actually wrote the book on quantitative spectroscopy***. Tim and Brian’s excitement over their technology mirrored that of Hugh and Greg. It turns out that SRI and PerkinElmer are more alike than I thought.

These two instrument manufacturers have addressed the fast/inexpensive conundrum of cannabis potency testing in two different ways: SRI’s instrument is extremely inexpensive, easy to operate, and will provide semi-quantitative values for THC, CBD, and CBN in just a few minutes; PE’s instrument is more expensive up front, but provides quantitative (though not directly quantitative) values for all of the major cannabinoids almost instantly, and requires almost no maintenance or consumables. These two instruments were designed for specific uses: one for inexpensive, easy use, and the other for more comprehensive results with a higher initial investment. The question consumers have to ask themselves is “Who do I need to solve my problem?” For some, the answer will be MacGyver, and for others, Doogie Howser will provide the solution – after all, both are heroes.


** B. Kolb, L. Ettre, Static Headspace-Gas Chromatography: Theory and Practice, John Wiley & Sons, Hoboken, NJ, 2006.

*** Brian C. Smith, Quantitative Spectroscopy: Theory and Practice, Elsevier, Boston, MA, 2002.

The Emerald Test Yields Positive Results for Cannabis Labs

By Aaron G. Biros
No Comments

Emerald Scientific recently announced results for their latest round of the semi-annual Inter-Laboratory Comparison and Proficiency Test (ILC/PT), and the outcomes may bode well for one of the most vital quality and safety aspects of the cannabis industry. According to Cynthia Ludwig, director of technical services at the American Oil Chemists’ Society (AOCS), there are no official methods for cannabis testing from an internationally recognized non-profit organization known to provide ‘official methods’ to various industries, so method validation needs to be done in-house, which is very costly and time-consuming. Cannabis testing labs are charged with the difficult task of providing honest, consistent and accurate results for potency, pesticide residue, residual solvents and contaminants. AOCS partnered with Emerald Scientific in this round of ILC/PT and preformed the statistical analysis and reports. For the first time in The Emerald Test’s history, participants were able to review all of the raw data and were given a consensus mean, z-scores and kernel density plots in order to compare themselves to other participants.emerald test retail

rsz_emerald-scientific_letterhead-1Emerald Scientific’s ILC/PT program measures how accurately a cannabis lab performs along with comparing it to other labs for an indicator of variability and ways to improve, according to a press release. 46 cannabis laboratories participated in The Emerald Test’s latest round of proficiency testing for potency and residual solvents. Cynthia Ludwig sits on the advisory panel to give direction and industry insights, addressing specific needs for cannabis laboratories. Kirsten Blake, director of sales at Emerald Scientific, believes that proficiency testing is the first step in bringing consistency to cannabis analytics. “The goal is to create some level of industry standards for testing,” says Blake. Participants in the program are given data sets, judged by a consensus mean, so labs can see their score compared to the rest of the cannabis testing industry.

Steep_Hill_Washington_2016_Spring_Emerald_Test_Potency_award_badgeProficiency tests like The Emerald Test give labs the ability to view how consistent their results are compared to the industry’s results overall. According to Ludwig, the results were pleasantly surprising. “The results were better than expected across the board; the vast majority of labs were within the acceptable range,” says Ludwig. The test is anonymous so individual labs can participate freely. “The overall performance of the participating labs in the Potency and Solvent Residue Emerald Test were very encouraging,” says Ludwig. “All but a couple of labs had the majority of their results fall within two standard deviations of the consensus mean, which is generally accepted as being within the acceptable limits to most evaluators.” Although requirements for labs testing cannabis differ in each state, Ludwig says the results show the ability of these labs to competently perform the tests and generate reliable results. “Given the lack of harmonized regulations, this is a testament to the self-imposed quality standards the industry is trying to achieve.”

Reggie Gaudino, Ph.D., vice president of scientific operations and director of genetics at Steep Hill Laboratories. (photo credit: Preston Gannaway)

Among the laboratories that participated, Steep Hill Laboratories joined the test at two of their locations. Reggie Gaudino, Ph.D., vice president of scientific operations and director of genetics at Steep Hill Laboratories, believes that tests like the Emerald Test ensure that the cannabis labs are performing their function to the best of their ability, which is extraordinarily important. “We, and not just Steep Hill, but all testing labs, are the custodians of quality and safety for the cannabis industry,” says Gaudino. “If we are not doing our best to ensure the quality of our science is beyond reproach, then we are failing the consumer; if even one person gets sick or dies because a lab cut corners and tried to make extra money, that is one person too many.” Accurate testing comes from internal and external proficiency testing.

According to Gaudino, how cannabis labs perform in The Emerald Test can affect every aspect of cannabis consumption: “Correct dosing from potency analysis reports, identification of as many, if not all, active compounds known to enable the consumer to make a determination as to which strain, edible or concentrate would be most beneficial and assurance that there are no harmful chemicals or biological contaminants on cannabis or cannabis derivatives; all of it stems from being able to accurately test.” Gaudino is a major proponent of The Emerald Test because it provides some measure of consistency and accuracy in the cannabis industry. Until more consistent regulations for cannabis testing are formed on a national scale, self-imposed quality standards such as The Emerald Test helps labs, growers and consumers know they are getting reliable data.

amandarigdon
The Practical Chemist

Calibration Part II – Evaluating Your Curves

By Amanda Rigdon
No Comments
amandarigdon

Despite the title, this article is not about weight loss – it is about generating valid analytical data for quantitative analyses. In the last installment of The Practical Chemist, I introduced instrument calibration and covered a few ways we can calibrate our instruments. Just because we have run several standards across a range of concentrations and plotted a curve using the resulting data, it does not mean our curve accurately represents our instrument’s response across that concentration range. In order to be able to claim that our calibration curve accurately represents our instrument response, we have to take a look at a couple of quality indicators for our curve data:

  1. correlation coefficient (r) or coefficient of determination (r2)
  2. back-calculated accuracy (reported as % error)

The r or r2 values that accompany our calibration curve are measurements of how closely our curve matches the data we have generated. The closer the values are to 1.00, the more accurately our curve represents our detector response. Generally, r values ≥0.995 and r2 values ≥ 0.990 are considered ‘good’. Figure 1 shows a few representative curves, their associated data, and r2 values (concentration and response units are arbitrary).

Figure 1: Representative Curves and r2 values

Let’s take a closer look at these curves:

Curve A: This represents a case where the curve perfectly matches the instrument data, meaning our calculated unknown values will be accurate across the entire calibration range.

Curve B: The r2 value is good and visually the curve matches most of the data points pretty well. However, if we look at our two highest calibration points, we can see that they do not match the trend for the rest of the data; the response values should be closer to 1250 and 2500. The fact that they are much lower than they should be could indicate that we are starting to overload our detector at higher calibration levels; we are putting more mass of analyte into the detector than it can reliably detect. This is a common problem when dealing with concentrated samples, so it can occur especially for potency analyses.

Curve C: We can see that although our r2 value is still okay, we are not detecting analytes as we should at the low end of our curve. In fact, at our lowest calibration level, the instrument is not detecting anything at all (0 response at the lowest point). This is a common problem with residual solvent and pesticide analyses where detection levels for some compounds like benzene are very low.

Curve D: It is a perfect example of our curve not representing our instrument response at all. A curve like this indicates a possible problem with the instrument or sample preparation.

So even if our curve looks good, we could be generating inaccurate results for some samples. This brings us to another measure of curve fitness: back-calculated accuracy (expressed as % error). This is an easy way to determine how accurate your results will be without performing a single additional run.

Back-calculated accuracy simply plugs the area values we obtained from our calibrators back into the calibration curve to see how well our curve will calculate these values in relation to the known value. We can do this by reprocessing our calibrators as unknowns or by hand. As an example, let’s back-calculate the concentration of our 500 level calibrator from Curve B. The formula for that curve is: y = 3.543x + 52.805. If we plug 1800 in for y and solve for x, we end up with a calculated concentration of 493. To calculate the error of our calculated value versus the true value, we can use the equation: % Error = [(calculated value – true value)/true value] * 100. This gives us a % error of -1.4%. Acceptable % error values are usually ±15 – 20% depending on analysis type. Let’s see what the % error values are for the curves shown in Figure 1.

practical chemist table 1
Table 1: % Error for Back-Calculated Values for Curves A – D

Our % error values have told us what our r2 values could not. We knew Curve D was unacceptable, but now we can see that Curves B and C will yield inaccurate results for all but the highest levels of analyte – even though the results were skewed at opposite ends of the curves.

There are many more details regarding generating calibration curves and measuring their quality that I did not have room to mention here. Hopefully, these two articles have given you some tools to use in your lab to quickly and easily improve the quality of your data. If you would like to learn more about this topic or have any questions, please don’t hesitate to contact me at amanda.rigdon@restek.com.

UCT-Dspe

Pesticide & Potency Analysis of Street-Grade versus Medicinal Cannabis

By Danielle Mackowsky
2 Comments
UCT-Dspe

In states where cannabis is legalized, some analytical laboratories are tasked with identifying and quantifying pesticide content in plant material. This is a relatively new concept in the study of cannabis as most forensic laboratories that work with seized plant material are only concerned with positively identifying the sample as cannabis. Laboratories of this nature, often associated with police departments, the office of the chief medical examiner or the local department of public health are not required to identify the amount of THC and other cannabinoids in the plant. While data is abundant that compares the average THC content in today’s recreational cannabis to that commonly consumed in the 1960s and 1970s, limited scientific studies can be found that discuss the pesticide content in street-grade cannabis.

cannabis-siezed
Street-grade cannabis that is ground into a fine powder

Using the QuEChERS approach, which is the industry gold-standard in food analysis for pesticides, a comparison study was carried out to analyze the pesticide and cannabinoid content in street-grade cannabis versus medicinal cannabis. For all samples, one gram of plant material was ground into a fine powder prior to hydration with methanol. The sample was then ready to be placed into an extraction tube, along with 10 mL of acetonitrile and one pouch of QuEChERS salts. After a quick vortex, all samples were then shaken for 1 minute using a SPEX Geno/Grinder prior to centrifugation.

Quenchers-analysis
Formation of layers following QuEChERS extraction

For pesticide analysis, a one mL aliquot of the top organic layer was then subjected to additional dispersive solid phase extraction (dSPE) clean-up. The blend of dSPE salts was selected to optimize the removal of chlorophyll and other interfering compounds from the plant material without compromising the recovery of any planar pesticides. Shaken and centrifuged under the same conditions as described above, an aliquot of the organic layer was then transferred to an auto-sampler vial and diluted with deionized water. Cannabinoid analysis required serial dilutions between 200 to 2000 times, depending on the individual sample. Both pesticide and cannabinoid separation was carried out on a UCT Selectra® Aqueous C18 HPLC column and guard column coupled to a Thermo Scientific Dionex UltiMate 3000 LC System/ TSQ VantageTM tandem MS.

UCT-Dspe
Supernatant before and after additional dispersive SPE clean-up using UCT’s Chlorofiltr

Pesticide Results

Due to inconsistent regulations among states that have legalized medicinal or recreational cannabis, a wide panel of commonly encountered pesticides was selected for this application. DEET, recognized by the EPA as not evoking health concerns to the general public when applied topically, was found on all medical cannabis samples tested. An average of 28 ng/g of DEET was found on medicinal samples analyzed. Limited research as to possible side effects, if any, of having this pesticide present within volatilized medical-grade product is available. Street-grade cannabis was found to have a variety of pesticides at concentrations higher than what was observed in the medical-grade product.

Potency Results

Tetrahydrocannabinolic acid A (THCA-A) is the non-psychoactive precursor to THC. Within fresh plant material, up to 90% of available THC is found in this form. Under intense heating such as when cannabis is smoked, THCA-A is progressively decarboxylated to the psychoactive THC form. Due to possible therapeutic qualities of this compound, medical cannabis samples specifically were tested for this analyte in addition to other cannabinoids. On average, 17% of the total weight in each medical cannabis sample came from the presence of THCA-A. In both medical and recreational samples, the percentage of THC contribution ranged from 0.9-1.7.

Summary

A fast and effective method was developed for the determination of pesticide residues and cannabis potency in recreational and medical cannabis samples. Pesticide residues and cannabinoids were extracted using the UCT QuEChERS approach, followed by either additional cleanup using a blend of dSPE sorbents for pesticide analysis, or serial dilutions for cannabinoid potency testing.

macropistil/trichome

Using LIMS in Cannabis Laboratories

By Aaron G. Biros
No Comments
macropistil/trichome

LIMS (laboratory information management systems) is a software-based information management tool that can streamline laboratory workflows, data management, automate repetitive steps, and improve instrumentation efficiency. The cannabis industry’s rapid growth, coupled with fluctuating state regulations, gave rise to a number of cannabis testing laboratories nationwide. Cannabis labs test primarily for potency, but testing regulations for pathogens, pesticides, and other contaminants are on their way to approval in California and Colorado.

limsbud
A dried flower prior to sample-preparation to be used for testing

Founded in 2010, BGASoft developed LIMSABC last year. The cloud-based laboratory informatics system is a platform that can manage all of a cannabis testing laboratory’s operational needs, while providing the tracking and audit trails required by some state’s regulations.

“The recreational and medical cannabis industry is in its infancy and many cannabis laboratories are small operations that need to be very capital efficient as they navigate a rapidly changing regulatory environment,” says Tim Kutz, vice president of business development at BGASoft.

“LIMSABC provides a flexible, modern platform to handle all of a testing laboratory’s operational needs while providing the rigorous tracking and audit trail required by today’s regulations, with the ability adapt to future regulations.”

macropistil/trichome
A macro view of the trichomes and pistils on the plant

According to Kutz, LIMS can help cannabis laboratories with bi-directional instrument and automation integration, and automate client reporting to help improve efficiencies and reduce errors. Because the software is cloud-based, the system is accessible through a secure web browser connection from any device.

trichome close up
The fine outgrowths, referred to as trichomes, house the majority of the plant’s resin, which is particularly important for sample-preparation in potency testing

“As legalization efforts advance nationwide, many states are putting in place strict regulatory requirements for the testing and handling of cannabis,” says Kutz. “Many states require or will require testing for pesticide levels, terpenes, cannabinoid levels, moisture, heavy metal, fungi and molds.”

As a result of strict sampling requirements, laboratories must account for all the sample test results from a variety of instruments as well as for every gram of the sample, from receiving it to consumption in testing to disposal.

“These requirements can quickly overwhelm even the most efficient laboratory trying to maintain paper and excel based records,” says Kutz. “LIMS allows laboratory personnel to keep sample and requisition-centric records, track the sample quantity and location, integrate all the test data, provide client reports all while providing an audit trail of each and every step.”

As testing regulations continue to roll out, cannabis laboratories will be required to use information management systems for traceability in compliance with state and local laws. 

dana and dani luce

Setting a Benchmark in Cannabis Testing: GOAT Labs

By Aaron G. Biros
No Comments
dana and dani luce

GOAT Labs, Inc. is a veteran-owned, i502-certified cannabis testing company with laboratories in Vancouver, Washington and Portland, Oregon. The laboratory launched in 2010 by Dana Luce, the owner, with a personal mission to provide safe and tested cannabis to patients in need.

Dana Luce’s daughter, Dani Luce, CEO of GOAT Labs, has previous experience working in dialysis and watched cancer patients lose their battle to the illness. Many years later, Dani’s oldest son was diagnosed with stage IV Hodgkin lymphoma. Cannabis proved instrumental in alleviating the side effects of chemotherapy. “With a severely compromised immune system, we had to find a place to test all the raw foods given to him, including cannabis,” says Dani Luce.

dana and dani luce
Dana Luce (left), owner of GOAT Labs, and Dani Luce (right), CEO, in the GOAT Labs office.

Dani Luce’s son was in remission nine months after starting chemotherapy in conjunction with cannabis and has now been in remission for five years. “We want to ensure patients are not ingesting something potentially toxic and that proper testing is done, which includes not only potency, but testing for microbials, pathogens, and pesticides.”

GOAT Labs is a member of the Cannabis Coalition for Standards and Ethics (CCSE) along with the American Oil Chemist Society (AOCS), where they participate in the Expert Committee for Cannabis Oil.

With pesticide use on cannabis recently entering the spotlight, there is a growing need for standards in cannabis testing. “We need better regulatory oversight so that all laboratories are standardized, including proficiency testing done by the state,” argues the Luce’s.

billlucesample
Bill Luce, lab technician at GOAT Labs, preparing samples for testing

Roger Brauninger, biosafety program manager of A2LA (American Association for Lab Accreditation), is working on an accreditation process for cannabis laboratories that would be accepted nationally. “We believe that an accreditation process would increase efficacy of lab results, reduce laboratory shopping, and create consistency with results across different laboratories,” says Brauninger.

GOAT Labs, among a number of other laboratories and organizations, is working toward putting cannabis in the lens of mainstream medicine. Not only are they looking to achieve a safe standard for medicine, they are advancing legalization efforts nationwide by setting the benchmark for getting patients access to safe, lab-tested cannabis.