Tag Archives: sample

Rapid Pathogen Detection for the 21st Century: A Look at PathogenDx

By Aaron G. Biros
No Comments

In 1887, Julius Petri invented a couple of glass dishes, designed to grow bacteria in a reproducible, consistent environment. The Petri dish, as it came to be known, birthed the scientific practice of agar cultures, allowing scientists to study bacteria and viruses. The field of microbiology was able to flourish with this handy new tool. The Petri dish, along with advancements in our understanding of microbiology, later developed into the modern field of microbial testing, allowing scientists to understand and measure microbial colonies to detect harmful pathogens in our food and water, like E. coli and Salmonella, for example.

The global food supply chain moves much faster today than it did in the late 19th century. According to Milan Patel, CEO of PathogenDx, this calls for something a little quicker. “Traditional microbial testing is tedious and lengthy,” says Patel. “We need 21st century pathogen detection solutions.”

Milan Patel first joined the parent company of PathogenDx back in 2012, when they were more focused on clinical diagnostics. “The company was predominantly built on grant funding [a $12 million grant from the National Institute of Health] and focused on a niche market that was very specialized and small in terms of market size and opportunity,” says Patel. “I realized that the technology had a much greater opportunity in a larger market.”

Milan Patel, CEO of PathogenDx
Photo: Michael Chansley

He thought that other markets could benefit from that technology greatly, so the parent company licensed the technology and that is how PathogenDx was formed. Him and his team wanted to bring the product to market without having to obtain FDA regulatory approval, so they looked to the cannabis market. “What we realized was we were solving a ‘massive’ bottleneck issue where the microbial test was the ‘longest test’ out of all the tests required in that industry, taking 3-6 days,” says Patel. “We ultimately realized that this challenge was endemic in every market – food, agriculture, water, etc. – and that the world was using a 140-year-old solution in the form of petri dish testing for microbial organisms to address challenges of industries and markets demanding faster turnaround of results, better accuracy, and lower cost- and that is the technology PathogenDx has invented and developed.”

While originally a spinoff technology designed for clinical diagnostics, they deployed the technology in cannabis testing labs early on. The purpose was to simplify the process of testing in an easy approach, with an ultra-low cost and higher throughput. Their technology delivers microbial results in less than 6 hours compared to 24-36 hours for next best option.

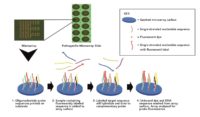
The PathogenDx Microarray

Out of all the tests performed in a licensed cannabis testing laboratory, microbial tests are the longest, sometimes taking up to a few days. “Other tests in the laboratory can usually be done in 2-4 hours, so growers would never get their microbial testing results on time,” says Patel. “We developed this technology that gets results in 6 hours. The FDA has never seen something like this. It is a very disruptive technology.”

When it comes to microbial contamination, timing is everything. “By the time Petri dish results are in, the supply chain is already in motion and products are moving downstream to distributors and retailers,” Patel says. “With a 6-hour turnaround time, we can identify where exactly in the supply chain contaminant is occurring and spreading.”

The technology is easy to use for a lab technician, which allows for a standard process on one platform that is accurate, consistent and reproduceable. The technology can deliver results with essentially just 12 steps:

  1. Take 1 gram of cannabis flower or non-flower sample. Or take environmental swab
  2. Drop sample in solution. Swab should already be in solution
  3. Vortex
  4. Transfer 1ml of solution into 1.5ml tube

    A look at how the sample is added to the microarray
  5. Conduct two 3-minute centrifugation steps to separate leaf material, free-floating DNA and create a small pellet with live cells
  6. Conduct cell lysis by adding digestion buffer to sample on heat blocks for 1 hour
  7. Conduct Loci enhancement PCR of sample for 1 hour
  8. Conduct Labelling PCR which essentially attaches a fluorescent tag on the analyte DNA for 1 hour
  9. Pipette into the Multiplex microarray well where hybridization of sample to probes for 30 minutes
  10. Conduct wash cycle for 15 minutes
  11. Dry and image the slide in imager
  12. The imager will create a TIFF file where software will analyze and deliver results and a report

Their DetectX product can test for a number of pathogens in parallel in the same sample at the same time down to 1 colony forming unit (CFU) per gram. For bacteria, the bacterial kit can detect E. coli, E. coli/Shigella spp., Salmonella enterica, Listeria and Staph aureus, Stec 1 and Stec 2 E.coli. For yeast and mold, the fungal kit can test for Aspergillus flavus, Aspergillus fumigatus, Aspergillus niger and Aspergillus terreus.

Their QuantX is the world’s first and only multiplex quantification microarray product that can quantify the microbial contamination load for key organisms such as total aerobic bacteria, total yeast & mold, bile tolerant gram negative, total coliform and total Enterobacteriaceae over a dynamic range from 100 CFU/mL up to 1,000,000 CFU/mL.

Not all of the PathogenDx technology is designed for just microbial testing of cannabis or food products. Their EnviroX technology is designed to help growers, processors or producers across any industry identify areas of microbial contamination, being used as a tool for quality assurance and hazard analysis. They conducted industry-wide surveys of the pathogens that are creating problems for cultivators and came up with a list of more than 50 bacterial and fungal pathogens that the EnviroX assay can test for to help growers identify contamination hotspots in their facilities.

Using the EnviroX assay, growers can swab surfaces like vents, fans, racks, workbenches and other potential areas of contamination where plants come in contact. This helps growers identify potential areas of contamination and remediate those locations. Patel says the tool could help growers employ more efficient standard operating procedures with sanitation and sterilization, reducing the facility’s incidence of pathogens winding up on crops, as well as reduction in use of pesticides and fungicides on the product.

Deploying this technology in the cannabis industry allowed Milan Patel and the PathogenDx team to bring something new to the world of microbial testing. Their products are now in more than 90 laboratories throughout the country. The success of this technology provides another shining example of how the cannabis market produces innovative and disruptive ideas that have a major impact on the world, far beyond cannabis itself.

3 Essential Components of Microbial Safety Testing

By Heather Ebling
1 Comment

Microbial contamination on cannabis products represents one of the most significant threats to cannabis consumers, particularly immunocompromised patients who are at risk of developing harmful and potentially fatal infections.

As a result, regulatory bodies in the United States and Canada mandate testing cannabis products for certain microbes. The two most popular methods for microbial safety testing in the cannabis industry are culture-based testing and quantitative polymerase chain reaction (qPCR).

When considering patient safety, labs should choose a method that provides an accurate account of what is living on the sample and can specifically target the most harmful microbes, regardless of the matrix.

1. The Method’s Results Must Accurately Reflect the Microbial Population on the Sample

The main objective of any microbial safety test is to give the operator an indication of the microbial population present on the sample.

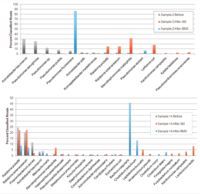
Figure 1: MA data collected directly from plant material before and after culture on 3M petrifilm and culture-based platforms.

Culture-based methods measure contamination by observing how many organisms grow in a given medium. However, not all microbial organisms grow at the same rate. In some cases, certain organisms will out-compete others and as a result, the population in a post-culture environment is radically different than what was on the original sample.

One study analyzed fifteen medicinal cannabis samples using two commercially available culture-based methods. To enumerate and differentiate bacteria and fungi present before and after growth on culture-based media, all samples were further subjected to next-generation sequencing (NGS) and metagenomic analyses (MA). Figure 1 illustrates MA data collected directly from plant material before and after culture on 3M petrifilm and culture-based platforms.

The results demonstrate substantial shifts in bacterial and fungal growth after culturing on the 3M petrifilm and culture-based platforms. Thus, the final composition of microbes after culturing is markedly different from the starting sample. Most concerning is the frequent identification of bacterial species in systems designed for the exclusive quantification of yeast and mold, as quantified by elevated total aerobic count (TAC) Cq values after culture in the total yeast and mold (TYM) medium. The presence of bacterial colonies on TYM growth plates or cartridges may falsely increase the rejection rate of cannabis samples for fungal contamination. These observations call into question the specificity claims of these platforms.

The Live Dead Problem

Figure 2: The enzyme is instantaneously inactivated when lysis buffer is added

One of the common objections to using qPCR for microbial safety testing is the fact that the method does not distinguish between live and dead DNA. PCR primers and probes will amplify any DNA in the sample that matches the target sequence, regardless of viability. Critics claim that this can lead to false positives because DNA from non-viable organisms can inflate results. This is often called the Live-Dead problem. However, scientists have developed multiple solutions to this problem. Most recently, Medicinal Genomics developed the Grim Reefer Free DNA Removal Kit, which eliminates free DNA contained in a sample by simply adding an enzyme and buffer and incubating for 10 minutes. The enzyme is instantaneously inactivated when lysis buffer is added, which prevents the Grim Reefer Enzyme from eliminating DNA when the viable cells are lysed (see Figure 2).

2. Method Must Be Able to Detect Specific Harmful Species 

Toxic Aspergillus spp., which is responsible for at least one confirmed death of a cannabis patient, grows poorly in culture mediums and is severely underreported by current culture-based platforms. And even when Aspergillus does grow in culture, there is a certain non-pathogenic Aspergillus species that look remarkably similar to their pathogenic cousins, making it difficult to speciate using visual identification alone.

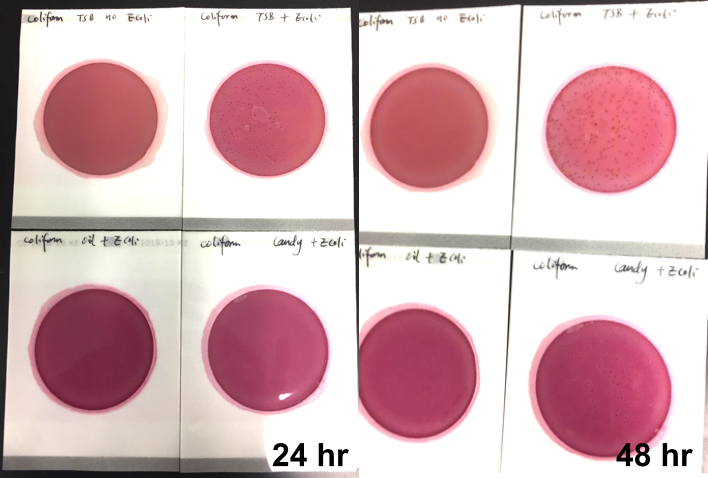
Figure 3: The team spiked a known amount of live E. coli into three different environments

Conversely, qPCR assays, such as the PathoSEEK, are designed to target DNA sequences that are unique to pathogenic Aspergillus species, and they can be run using standard qPCR instruments such as the Agilent AriaMx. The primers are so specific that a single DNA base difference in the sequence can determine whether binding occurs. This specificity reduces the frequency of false positives in pathogen detection, a frequent problem with culture-based cannabis testing methods.

Additionally, Medicinal Genomics has developed a multiplex assay that can detect the four pathogenic species of Aspergillus (A. flavus, A. fumigatus, A. niger, and A. terreus) in a single reaction.

3. The Method Must Work on Multiple Matrices 

Figure 4: The team also placed TSB without any E. coli onto a petrifilm to serve as a control.

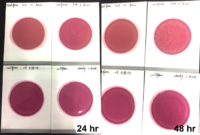
Marijuana infused products (MIPs) are a very diverse class of matrices that behave very differently than cannabis flowers. Gummy bears, chocolates, oils and tinctures all present different challenges to culture-based techniques as the sugars and carbohydrates can radically alter the carbon sources available for growth. To assess the impact of MIPs on colony-forming units per gram of sample (CFU/g) enumeration, The Medicinal Genomics team spiked a known amount of live E. coli into three different environments: tryptic soy broth (TSB), hemp oil and hard candy. The team then homogenized the samples, pipetted amounts from each onto 3M™ Petrifilm E. coli / Coliform Count (EC) Plates, and incubated for 96 hours. The team also placed TSB without any E. coli onto a petrifilm to serve as a control. Figures 3 and 4 show the results in 24-hour intervals.

Table 1: DNA was spiked into various MIPs

This implies the MIPs are interfering with the reporter assay on the films or that the MIPs are antiseptic in nature.

Many MIPs use citric acid as a flavoring ingredient which may interfere with 3M reporter chemistry. In contrast, the qPCR signal from the Agilent AriaMx was constant, implying there is microbial contamination present on the films, but the colony formation or reporting is inhibited.

Table 3: SenSATIVAx DNA extraction can successfully lyse the cells of the microbes
Table 2: Different numbers of DNA copies spiked into chocolate

This is not an issue with DNA-based methods, so long as the DNA extraction method has been validated on these matrices. For example, the SenSATIVAx DNA extraction method is efficient in different matrices, DNA was spiked into various MIPs as shown in Table 1, and at different numbers of DNA copies into chocolate (Table 2). The SenSATIVAx DNA extraction kit successfully captures the varying levels of DNA, and the PathoSEEK detection assay can successfully detect that range of DNA. Table 3 demonstrates that SenSATIVAx DNA extraction can successfully lyse the cells of the microbes that may be present on cannabis for a variety of organisms spiked onto cannabis flower samples.

Analytical Instruments You Need to Start a Cannabis Testing Laboratory

By Bob Clifford
8 Comments

The cannabis industry is growing exponentially, and the use of cannabis for medical purposes is being adopted across the nation. With this boom in cannabis consumers, there has been an increasing need for knowledge about the product.

The role of testing labs has become crucial to the process, which makes owning and operating a lab more lucrative. Scientists testing for potency, heavy metals, pesticides, residual solvents, moisture, terpene profile, microbial and fungal growth, and mycotoxins/aflatoxins are able to make meaningful contributions to the medical industry by making sure products are safe, while simultaneously generating profits and a return on investment.

Here are the key testing instruments you need to conduct these critical analyses. Note that cannabis analytical testing requirements may vary by state, so be sure to check the regulations applicable to the location of your laboratory.

Potency Testing

High-performance liquid chromatograph (HPLC) designed for quantitative determination of cannabinoid content.

The most important component of cannabis testing is the analysis of cannabinoid profiles, also known as potency. Cannabis plants naturally produce cannabinoids that determine the overall effect and strength of the cultivar, which is also referred to as the strain. There are many different cannabinoids that all have distinct medicinal effects. However, most states only require testing and reporting for the dry weight percentages of delta-9-tetrahydrocannabinol (Δ9-THC) and cannabidiol (CBD). It should be noted that delta-9-tetrahydrocannabinolic acid (Δ9-THCA) can be converted to THC through oxidation with heat or light.

For potency testing, traditional high-performance liquid chromatography (HPLC) is recommended and has become the gold standard for analyzing cannabinoid profiles. Look for a turnkey HPLC analyzer that delivers a comprehensive package that integrates instrument hardware, software, consumables and proven HPLC methods.

Heavy Metal Testing

ICP-MS instrument for detecting heavy metals in cannabis.

Different types of metals can be found in soils and fertilizers, and as cannabis plants grow, they tend to draw in these metals from the soil. Heavy metals are a group of metals considered to be toxic, and the most common include lead, cadmium, arsenic and mercury. Most labs are required to test and confirm that samples are under the allowable toxic concentration limits for these four hazardous metals.

Heavy metal testing is performed by inductively coupled plasma mass spectrometry (ICP-MS). ICP-MS uses the different masses of each element to determine which elements are present within a sample and at what concentrations. Make sure to include accompanying software that provides assistant functions to simplify analysis by developing analytical methods and automatically diagnosing spectral interference. This will provide easy operation and analytical results with exceptionally high reliability.

To reduce running costs, look for a supporting hardware system that reduces the consumption of argon gas and electricity. For example, use a plasma ignition sequence that is optimized for lower-purity argon gas (i.e., 99.9% argon as opposed to more expensive 99.9999%).

Pesticide Testing

The detection of pesticides in cannabis can be a challenge. There are many pesticides that are used in commercial cannabis grow operations to kill the pests that thrive on the plants and in greenhouses. These chemicals are toxic to humans, so confirming their absence from cannabis products is crucial. The number of pesticides that must be tested for varies from state to state, with Colorado requiring only 13 pesticides, whereas Oregon and California require 59 and 66 respectively. Canada has taken it a step further and must test for 96 pesticides, while AOAC International is developing methods for testing for 104 pesticides. The list of pesticides will continue to evolve as the industry evolves.

Testing for pesticides is one of the more problematic analyses, possibly resulting in the need for two different instruments depending on the state’s requirements. For a majority of pesticides, liquid chromatography mass spectrometry (LCMS) is acceptable and operates much like HPLC but utilizes a different detector and sample preparation.

With excellent sensitivity and ultra-low detection limits, LC-MS/MS is an ideal technique for the analysis of pesticides.

Pesticides that do not ionize well in an LCMS source require the use of a gas chromatography mass spectrometry (GCMS) instrument. The principles of HPLC still apply – you inject a sample, separate it on a column and detect with a detector. However, in this case, a gas (typically helium) is used to carry the sample.

Look for a LC-MS/MS system or HPLC system with a triple quadrupole mass spectrometer that provides ultra-low detection limits, high sensitivity and efficient throughput. Advanced systems can analyze more than 200 pesticides in 12 minutes.

For GCMS analysis, consider an instrument that utilizes a triple quadrupole mass spectrometer to help maximize the capabilities of your laboratory. Select an instrument that is designed with enhanced functionality, analysis software, databases and a sample introduction system. Also include a headspace autosampler, which can also be used for terpene profiles and residual solvent testing.

Residual Solvent Testing

Residual solvents are chemicals left over from the process of extracting cannabinoids and terpenes from the cannabis plant. Common solvents for such extractions include ethanol, butane, propane and hexane. These solvents are evaporated to prepare high-concentration oils and waxes. However, it is sometimes necessary to use large quantities of solvent in order to increase extraction efficiency and to achieve higher levels of purity. Since these solvents are not safe for human consumption, most states require labs to verify that all traces of the substances have been removed.

Testing for residual solvents requires gas chromatography (GC). For this process, a small amount of extract is put into a vial and heated to mimic the natural evaporation process. The amount of solvent that is evaporated from the sample and into the air is referred to as the “headspace.” The headspace is then extracted with a syringe and placed in the injection port of the GC. This technique is called full-evaporated technique (FET) and utilizes the headspace autosampler for the GC.

Look for a GCMS instrument with a headspace autosampler, which can also be used for pesticide and terpene analysis.

Terpene Profile Testing

Terpenes are produced in the trichomes of the cannabis leaves, where THC is created, and are common constituents of the plant’s distinctive flavor and aroma. Terpenes also act as essential medicinal hydrocarbon building blocks, influencing the overall homeopathic and therapeutic effect of the product. The characterization of terpenes and their synergistic effect with cannabinoids are key for identifying the correct cannabis treatment plan for patients with pain, anxiety, epilepsy, depression, cancer and other illnesses. This test is not required by most states, but it is recommended.

The instrumentation that is used for analyzing terpene profiles is a GCMS with headspace autosampler with an appropriate spectral library. Since residual solvent testing is an analysis required by most states, all of the instrumentation required for terpene profiling will already be in your lab.

As with residual solvent testing, look for a GCMS instrument with a headspace autosampler (see above). 

Microbe, Fungus and Mycotoxin Testing

Most states mandate that cannabis testing labs analyze samples for any fungal or microbial growth resulting from production or handling, as well as for mycotoxins, which are toxins produced by fungi. With the potential to become lethal, continuous exposure to mycotoxins can lead to a buildup of progressively worse allergic reactions.

LCMS should be used to qualify and identify strains of mycotoxins. However, determining the amount of microorganisms present is another challenge. That testing can be done using enzyme linked immunosorbent assay (ELISA), quantitative polymerase chain reaction (qPCR) or matrix-assisted laser desorption/ionization time-of-flight mass spectrometry (MALDI-TOF MS), with each having their advantages and disadvantages.

For mycotoxin analysis, select a high-sensitivity LC-MS/MS instrument. In addition to standard LC, using an MS/MS selective detector enables labs to obtain limits of detection up to 1000 times greater than conventional LC-UV instruments.

For qPCR and its associated needs, look for a real-time PCR amplification system that combines thermal cyclers with optical reaction modules for singleplex and multiplex detection of fluorophores. These real-time PCR detection systems range from economical two-target detection to sophisticated five-target or more detection systems. The real-time detection platform should offer reliable gradient-enabled thermal cyclers for rapid assay optimization. Accompanying software built to work with the system simplifies plate setup, data collection, data analysis and data visualization of real-time PCR results.

Moisture Content and Water Activity Testing

Moisture content testing is required in some states. Moisture can be extremely detrimental to the quality of stored cannabis products. Dried cannabis typically has a moisture content of 5% to 12%. A moisture content above 12% in dried cannabis is prone to fungal growth (mold). As medical users may be immune deficient and vulnerable to the effects of mold, constant monitoring of moisture is needed. Below a 5% moisture content, the cannabis will turn to a dust-like texture.

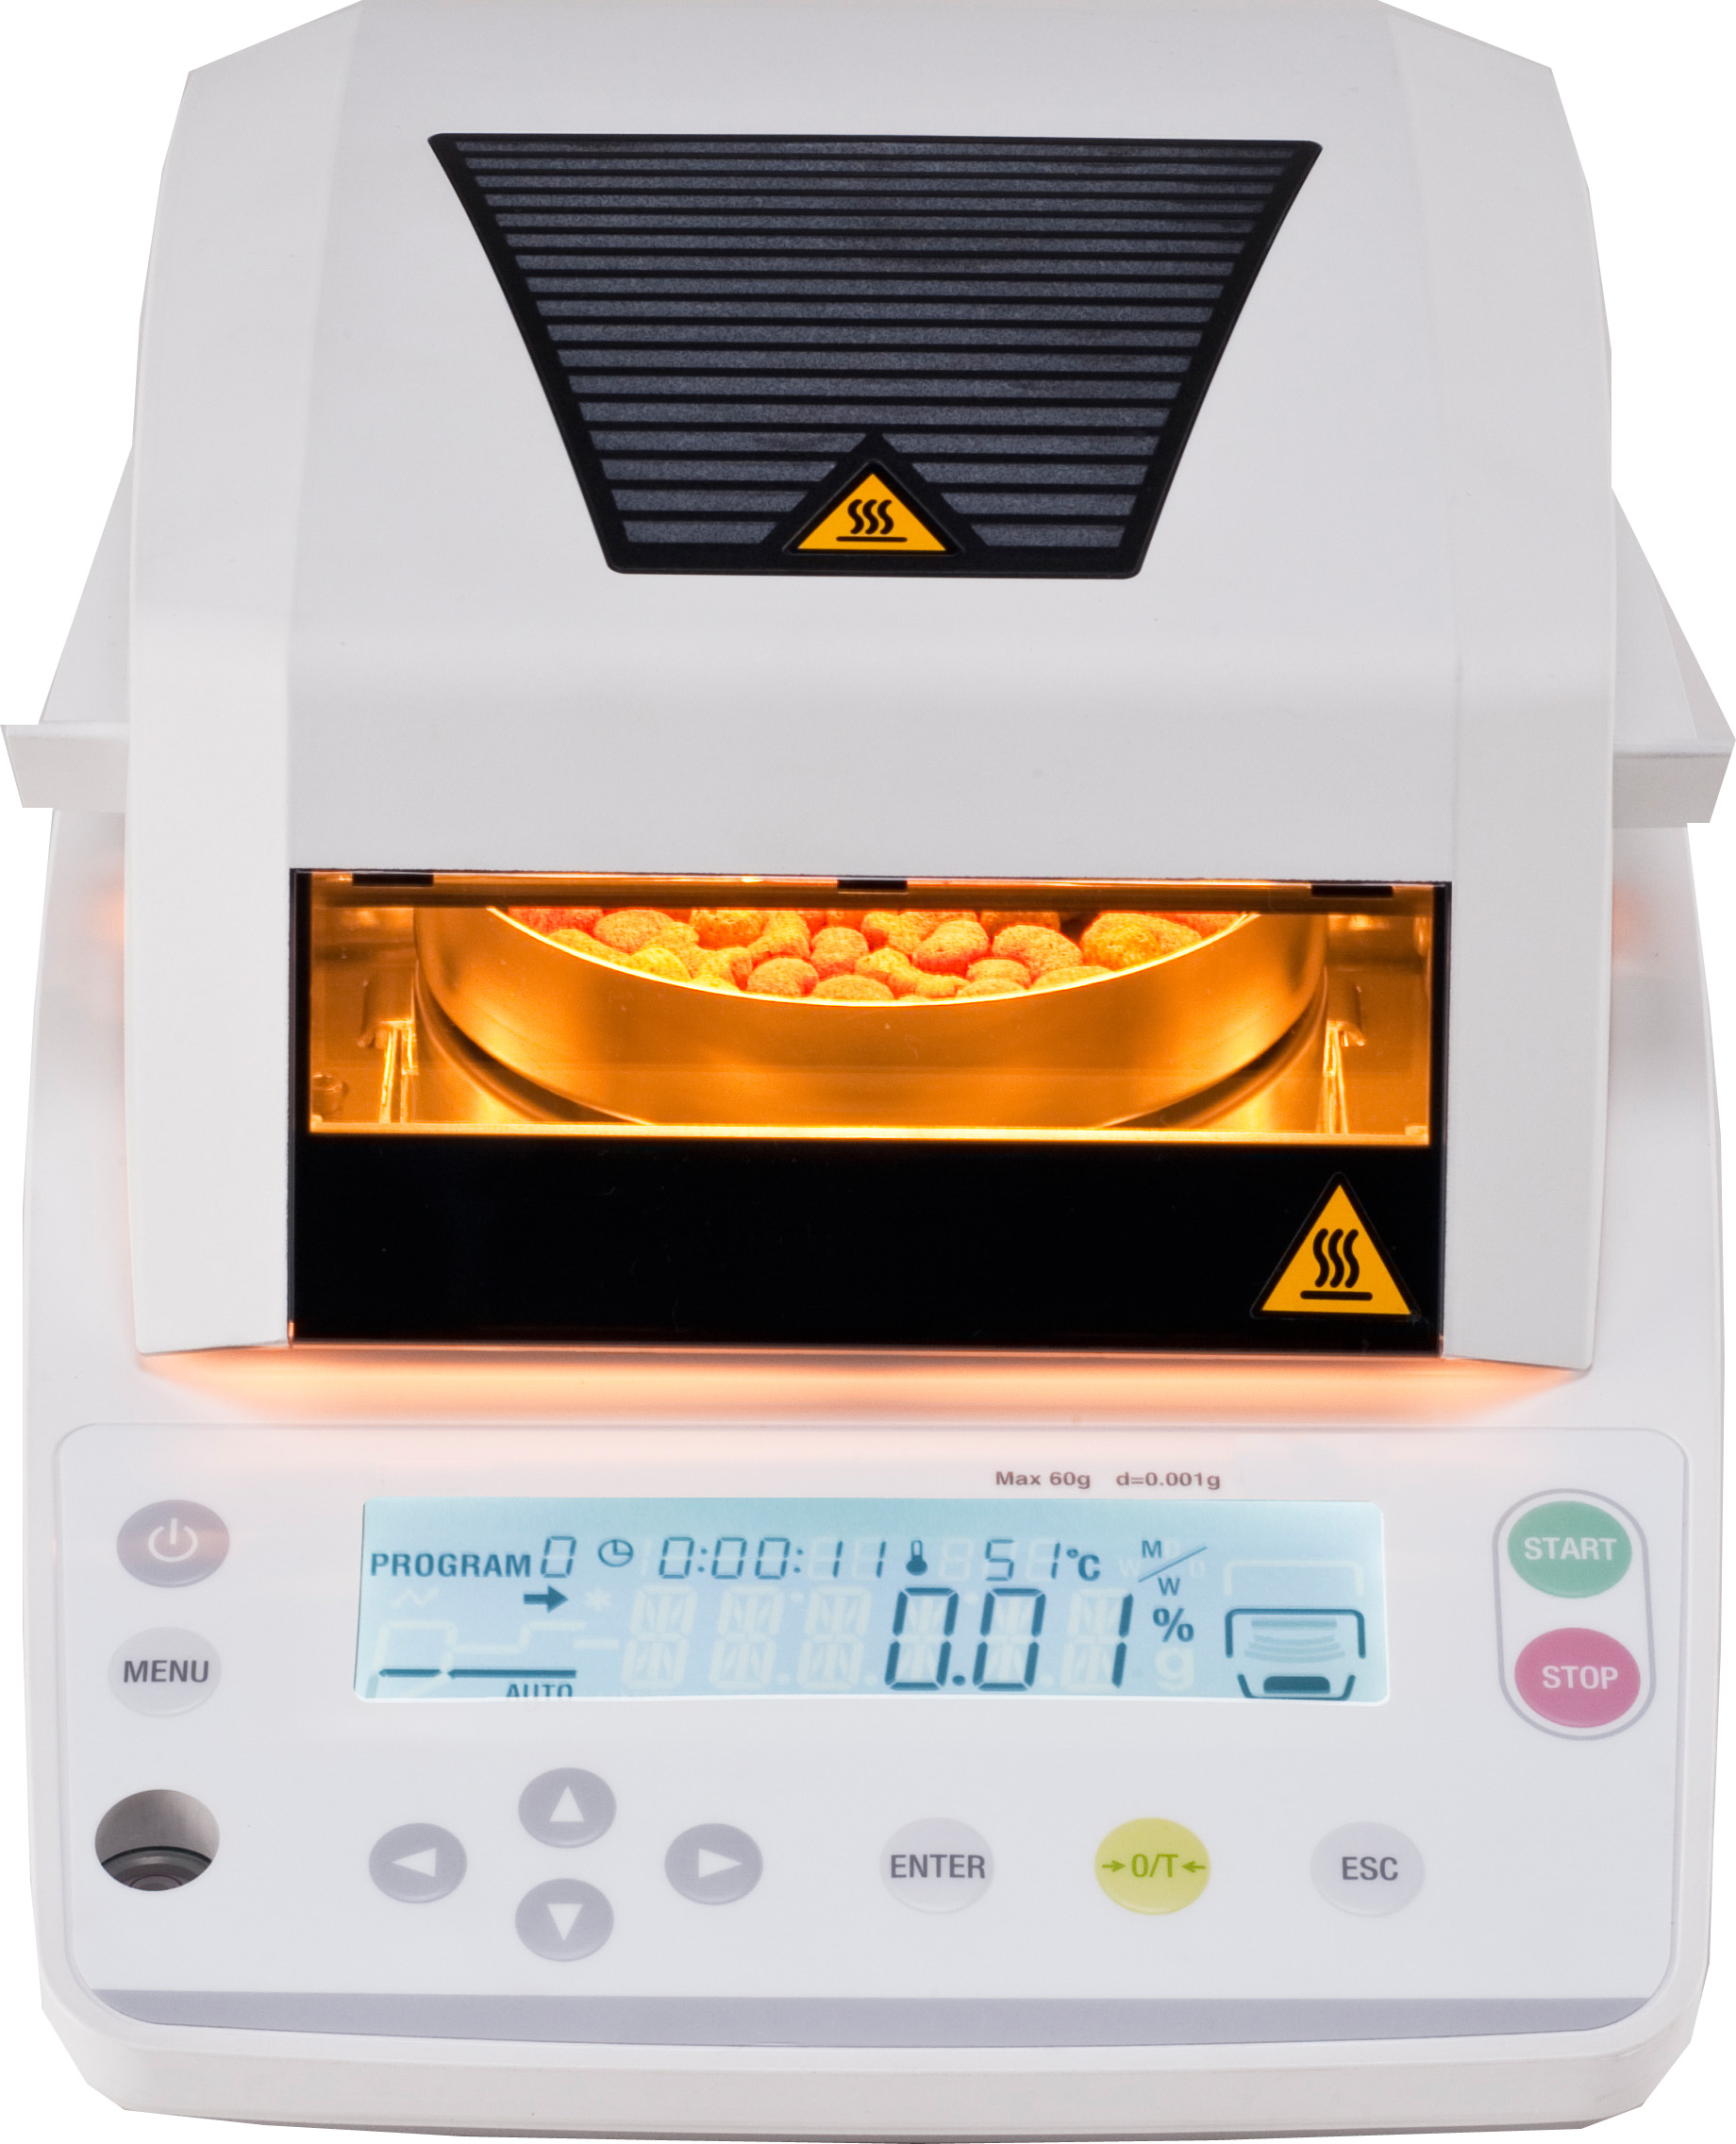
The best way to analyze the moisture content of any product is using the thermogravimetric method with a moisture balance instrument. This process involves placing the sample of cannabis into the sample chamber and taking an initial reading. Then the moisture balance instrument heats up until all the moisture has been evaporated out of the sample. A final reading is then taken to determine the percent weight of moisture that was contained in the original sample.

A moisture balance can provide accurate determination of moisture content in cannabis.

Look for a moisture balance that offers intuitive operation and quick, accurate determination of moisture content. The pan should be spacious enough to allow large samples to be spread thinly. The halogen heater and reflector plate should combine to enable precise, uniform heating. Advanced features can include preset, modifiable measurement modes like automated ending, timed ending, rapid drying, slow drying and step drying.

Another method for preventing mold is monitoring water activity (aW). Very simply, moisture content is the total amount of water available, while water activity is the “free water” that could produce mold. Water activityranges from 0 to 1. Pure water would have an aW of 1.0. ASTM methods D8196-18 and D8297-18 are methods for monitoring water activity in dry cannabis flower. The aW range recommended for storage is 0.55 to 0.65. Some states recommend moisture content to be monitored, other states monitor water activity, and some states such as California recommend monitoring both.

Final Thoughts

As you can see, cannabis growers benefit tremendously from cannabis testing. Whether meeting state requirements or certifying a product, laboratory testing reduces growers’ risk and ensures delivery of a quality product. As medicinal and recreational cannabis markets continue to grow, analytical testing will ensure that consumers are receiving accurately

labeled products that are free from contamination. That’s why it is important to invest in the future of your cannabis testing lab by selecting the right analytical equipment at the start of your venture.

Denver Plans Crackdown on Contaminants

By Aaron G. Biros
1 Comment

Earlier this month, Colorado cannabis producer Herbal Wellness LLC recalled dozens of batches of cannabis due to positive yeast and mold tests. The Colorado Department of Public Health and Environment (CDPHE) issued a health and safety advisory following the news of microbial contamination.

The Colorado Department of Revenue then identified batches of both medical and recreational cannabis produced by Herbal Wellness that were not even tested for microbial contaminants, which is a requirement for licensed producers in the state. Just a few days later, the Denver Department of Public Health & Environment (DDPHE) issued a bulletin announcing their plans to conduct random tests at dozens of dispensaries.

“In the coming weeks, the Denver Department of Public Health & Environment (DDPHE) will be conducting an assessment in approximately 25 retail marijuana stores to evaluate contaminants in products on store shelves,” reads the bulletin. “DDPHE has worked with epidemiological partners at Denver Public Heath to create the assessment methodology. Participating stores will be randomly identified for inclusion in the assessment.”

“Current METRC inventory lists for each store will be used to randomly identify samples of flower, trim/shake, and pre-rolls. Each sample will be tested for pesticides and total yeast and mold by a state- and ISO-certified marijuana testing facility. Results of their respective testing will be shared with each facility and will also be shared broadly within a write-up of results.”

EVIO Logo

EVIO Labs Florida Achieves ISO17025:2017 Accreditation

By Aaron G. Biros
No Comments
EVIO Logo

EVIO Labs Florida received their ISO 17025:2005 accreditation in February of 2018. Last week, EVIO Labs Florida announced via a press release that they completed their ISO 17025:2017 accreditation and received a certification from AOAC International. The accreditation helped them to further expand their testing scope to shelf life and stability testing, the ability to detect harmful bacteria and calculate degradation in samples.

The certification that they received from AOAC helps verify their ability to conduct accurate and fair 3rd party testing, meeting Florida’s requirements for the market. Back when the laboratory first started in 2017, there were no requirements for lab testing cannabis products under Florida’s regulations.

Chris Martinez
Chris Martinez, co-founder and president of EVIO Labs Florida

Upon expanding to their Gainesville location in November last year and getting accredited to ISO 17025:2017 last week, EVIO Labs Florida expects the new location to be compliant and operational by April 2019, in preparation for the state’s new regulations. “Our team has worked diligently to maintain our stance as the Gold Standard in Cannabis Testing,” says Chris Martinez, co-founder and president of EVIO Lab Florida. “The ability to obtain the recent ISO 17025:2017 and AOAC certification is a testament to our dedication in maintaining public safety and product integrity in an ever-growing industry.”

Martinez is also presenting during the 2ndAnnual Cannabis Labs Virtual Conference on April 2, where he will discuss how EVIO Labs Florida began as a laboratory and how they were able to expand to a second location and grow their market presence in Florida. Click here to register for his talk.

8 Mistakes Businesses Make When Managing Product Labels: Part 1

By Rob Freeman
2 Comments

Editor’s Note: This article contains the first four common labeling mistakes that businesses can make. Click here to view the next four common labeling mistakes


Whether you’re a small business owner or a production manager of a large manufacturer, if you’ve ever experienced problems with your product labels you know it can quickly turn into a serious issue until that problem is resolved. From the time it’s applied to your product all the way to the POS (Point of Sale), labels always seem to be the least significant part of the production process- until something goes wrong. And when it does go wrong, it can create major branding issues and cost your company tens of thousands of dollars due to hefty supply chain late penalties and/or even government fines.

This article aims to provide insight as to how a company like Label Solutions Inc. helps businesses and manufacturers create new labels for their products as well as what to look for should you experience label failure at your retail locations. Topics discussed in this article do not cover all possible issues, but these common mistakes will hopefully help you better understand how creating a product label works, and how to possibly prevent your own problems in the future.

Mistake #1: Not Understanding the Importance Between the “Construction” Versus the “Artwork & Compliance” of the Label

This may seem like common sense, but it is often overlooked. Especially when dealing with fast-track projects.

Construction of the Label is the material selected and production process to produce the label. When creating a new label from the ground up, it is important to factor in how your product will be produced, necessary shipping and supply chain needs, how it is stored in inventory and how it will be presented at the POS. Understanding what environments your product will be exposed to throughout its life cycle will give you an advantage when approving substrate material, inks, and the strength of adhesive that might be necessary for your application.

The Artwork & Compliance of the Label refers to the overall design of the label, artwork, customer messaging, bar codes and regulatory requirements you need to follow in order to avoid serious government fines that might relate to your industry (Referring to agencies such as OSHA, DOT, and the FDA).In most cases the construction of the label does not apply to the compliance of the label.

Most label providers do not have the in-house expertise to offer compliance assistance. Although it is still the manufacturer who is liable for all final artwork approvals on their product, label providers that do offer advisory services can help update label content when regulatory changes are enacted. This “safety net” can save your company from extra production costs and, potentially, excessive legal time and material costs. In short, you should always review final label artwork approvals with your compliance team and/or legal expert, but it never hurts to have a “safety net” to help eliminate unnecessary orders or production delays.

In most cases the construction of the label does not apply to the compliance of the label. An exception to this statement would be industries such as the electronics industry that use UL (Underwriter Laboratories) labels that must meet UL specifications and be produced under recognized UL files. In other words, the compliance of a UL label is the construction of the label.

Best Method Approach: An excellent example of companies that understand the difference between the Construction vs. Artwork & Compliance of the label would be the compressed gas industry. Gas suppliers and distributors require long term regulatory compliant labels on their cylinders and micro-bulk tanks. These gas tanks are used in a wide variety of industries such as for manufacturing, welding, medical procedures, and specialty gas mixes for the micro-electronics industry.

The compressed gas industry requires that their labels follow strict, up-to-date OHSA and DOT compliance requirements. As for the construction of the label, it is common practice that the label remains legible on the cylinder for an average of five years. The 5-year duration is due to the millions of tanks that are in circulation throughout the US and Canada. What’s more, each label is produced to adhere to the cylinder’s metal surface during extreme outdoor weather conditions such as fluctuating temperatures, freezing rain, high winds, and direct sunlight year-round.

Mistake #2: Applying Labels Incorrectly to Your Products

Whether the label is applied to the product surface by hand or automatically with a label applicator, the label itself may not be applied level or evenly. Besides this being a major branding issue, this could also affect how the bar codes are scanned and could eventually impact your delivery times while trying to correct a batch.

Best Method Approach: There are construction alternatives that you can choose from to potentially reduce the impact of incorrect label application. For example, products with certain label adhesives allow your production team to reposition the label within a few minutes before the tack completely sets to the surface. The type of surface (cardboard, metal, plastic, glass, etc.) and the type of adhesive will determine how much time your production team will have before the tack sets.

The best practice is to apply labels prior to filling the bottles and cans as opposed to filling first and then applying the label in your production line.A good example of this best practice can be seen in the beverage market. Whether the client produces a uniquely crafted beer, or a rare ingredient infused into a new health drink, labels that are auto-applied to bottles and cans will sometimes experience equipment tension issues that need to be recalibrated. Once labels are applied off-alignment, a delayed tack setting can allow the label to be quickly repositioned by hand when needed. The best practice is to apply labels prior to filling the bottles and cans as opposed to filling first and then applying the label in your production line. The reason, excess spillage from filling can interfere with most adhesives.

This same repositionable adhesive is excellent to keep in mind for large equipment production assembly lines that apply prime (branding) labels and warning labels by hand. Even with large wide-format labels, the adhesive tack can be formulated so your employees have a few minutes to adjust, straighten, and smooth away trapped air bubbles once it has been placed on the surface. Knowing you have this option can help reduce label inventory waste, additional production material wastes and avoid delaying production time. More importantly, this option keeps your brand and your warning/instructional labels looking fresh.

Mistake #3: Not Sharing Your Production Run Schedules with Your Label ProviderSupply chain management (SCM) models are excellent examples of the best approach.

Some of Label Solutions’ largest accounts have the most efficient real-time tracking supply chain models in North America, but even they cannot avoid sudden increased orders for their products stemming from high customer demand or similar issues. It is a good problem to have, but it is a problem, nonetheless. Manufacturers utilize supply chain management tools to notify their suppliers of their monthly order forecasts, which in turn helps suppliers manage their materials and deliveries more efficiently.

On the other side of the spectrum, when small businesses share their production schedules with a supplier it means that both parties (the manufacturer and label provider) understand when to expect higher or lower order quantities each month. Label providers should back date their label production schedules, so they have the materials available to handle your busier months while ensuring on-time deliveries.

Best Method Approach: Supply chain management (SCM) models are excellent examples of the best approach. Although SCM’s are designed for scalability and real-time tracking, the benefit to you also helps your label supplier. For example, our large retail and industrial manufacturing clients notify the Label Solutions team to produce their labels according to their Supply Chain portal demand schedules. This, in turn, allows label suppliers to allocate production time and materials more efficiently for your last-minute rush orders.

Smaller companies can take a much more simplified approach (without the SCM tracking) to help their suppliers manage their orders – even if they do not use supply chain management. A simple Excel report of production runs over a 12-month time frame is ideal. If your label provider does not already practice this or similar methodology, it might be time to start looking for a more proactive label provider. If you’re unsure you want to share your information, then you might consider requiring your label provider to sign an NDA (Non-disclosure Agreement).

Mistake #4: Not Accepting Alternative Sizes of the Label to Allow for Better Pricing

If your product needs a label with, for example, a dimension of 5.25 X 6.75 inches, there might be a much better price point offered to you if you’re open to switching to a slightly different dimension label of, say, 5 X 7 inches.  Obviously, you need to make sure the new dimension would fit your product(s) and work with your production line. But, if alternate dimensions are within the scope of the project, a modified SKU could potentially cut down on cost and production time.

Best Method Approach: You might not have the time or ability to change your label if you already market that product in retail stores. But, if you are changing your branding, creating a new style of label, or releasing a completely new product, this is the ideal time to consider implementing better continuity between your products. This could include elements such as matching colors and label/packaging design.

In addition to updating your SKU’s, this might also be an opportunity for your company to consolidate multiple products onto a universal label size. By applying the same sized labels to multiple SKU’s, you can increase efficiency regarding repeated label orders, especially for label printers that use digital printers. Combine this approach with your expected annual quantity estimates and you’ll be positioned for very efficient ordering options as your company grows.


Editor’s Note: We’ll cover the next four most common labeling mistakes in Part Two coming next week. Stay tuned for more!

Pesticide Testing: Methods, Strategies & Sampling

By Charles Deibel
No Comments

Editor’s Note: The following is based on research and studies performed in their Santa Cruz Lab, with contributions from Mikhail Gadomski, Lab Manager, Ryan Maus, Technical Services Analyst, Dr. Laurie Post, Director of Food Safety & Compliance, Andy Sechler, Lab Director, Toby Astill, Senior Business Development Leader at Perkin Elmer and Charles Deibel, President of Deibel Cannabis Labs.


Pesticides represent the leading cause of batch failures in the cannabis industry. They are also the hardest tests to run in the laboratory, even one equipped with state-of-the-art equipment. The best instruments on the market are HPLC and GC dual mass spectrometer detectors, called “HPLC-qqq”, “GC-qqq,” or just triple quads.

As non-lab people, we envision a laboratory that can take a cannabis sample, inject it into a triple quad and have the machine quickly and effortlessly print out a report of pesticide values. Unfortunately, this is far from reality. The process is much more hands on and complex.In the current chemistry lab, trained analysts have to first program the triple quads to look for the pesticides of concern; in cannabis pesticide testing, this is done by programming the first of two mass spectrometers to identify a single (precursor) mass that is characteristic of the pesticide in question. For BCC requirements in California, this has to be done for all 66 pesticides, one at a time.

Next, these precursor ions are degraded into secondary chemicals called the “product” ions, also called transition ions. The second of the two mass spectrometers is used to analyze these transition ions. This process is graphed and the resulting spectrum is analyzed by trained chemists in the lab, pesticide by pesticide, for all the samples processed that day. If the lab analyzes 10 samples, that translates to 660 spectra to analyze (66 pesticides x 10 samples). When looking at the spectra for each pesticide, the analysts must compare the ratios of the precursor ions to the product ions.

Confirmation Testing

If these spectra indicate a given pesticide may be present, the chemists must then compare the ratios between the precursor and the products. If these ratios are not what is expected, then the analyst must perform confirmation testing to prove the precursor mass either is or is not the pesticide of concern. If the ratios are not what is expected, it means the molecule is similar to the pesticide in question, but may not be that pesticide. This confirmatory testing is key to producing accurate results and not failing batches when dealing with closely related chemicals. This process of analyzing spectra is done in all labs that are performing pesticide testing. In this fledgling industry, there are few published cannabis pesticide methods. 

The need for this type of confirmation testing doesn’t happen all of the time, but when it does, it will take longer than our targeted three-day turn-around time. In the picture above, one precursor mass is ionized into several product masses; but only two are large enough to be used for comparison. In this hypothetical situation, two product masses are produced for every one precursor, the expected ion abundance ratio should be less than 30%. When performing any confirmatory testing, if the ion abundance ratio is >30%, it means the original precursor molecule was not the pesticide of concern. For example, if the ion abundance ratio was 50%, then the original molecule broke down into too many parts; it was not the pesticide we were looking for. This ion abundance ratio threshold was established by FANCO, the international organization that sets guidelines for all pesticide testing.

Testing Strategies

Methodology: In this fledgling industry, there are few published cannabis pesticide methods. The identification of the precursor mass and product ions are not always published, leaving labs to research which ions should be used. This adds to the potential for differences between lab results. Once selected, labs should validate their research, through a series of experiments to ensure the correct precursor and transition (product) ions are being used in the method.

Sample Preparation: Beyond the time-consuming work that is required to develop sound pesticide methods, the extraction step is absolutely critical for credible results. If the pesticides aren’t fully extracted from the cannabis product, then the results will be lower than expected. Sample preparations are often not standardized between labs, so unless a given extraction technique is validated for accuracy, there is the possibility for differences between labs.

Getting a Representative Sample

The current California recommended amount of sample is one gram of product per batch. Batch sizes can vary greatly and it is entirely likely that two different one gram samples can have two different results for pesticides. Has the entire plant been evenly coated with exactly the same amount of pesticide onto every square inch of its leaves? No, probably not. That is why it is imperative to take a “random” sample, by taking several smaller samples from different areas of the entire batch.

Sampling Plans: We can learn a lot from the manufacturing and sampling best practices developed by the food industry through the years. If a food manufacturer is concerned with the possibility of having a bacteria pathogen, like Salmonella, in their finished product, they test the samples coming off their production lines at a statistically relevant level. This practice (theory) is called the sampling plan and it can easily be adapted to the cannabis industry. The basic premise is that the more you test, the higher your likelihood of catching a contaminate. Envision a rectangular swimming pool, but instead of water, it’s filled with jello. In this gelatinous small pool, 100 pennies are suspended at varying levels. The pennies represent the contaminates.

Is the pool homogenized? Is jello evenly represented in the entire pool? Yes. 

Is your concentrate evenly distributed in the extraction vessel? Yes. The question is, where are the pennies in that extraction vessel? The heavy metals, the microbial impurities and the pesticides should be evenly distributed in the extraction vessel but they may not be evenly represented in each sample that is collected. Unfortunately, this is the bane of the manufacturing industry and it’s the unfortunate reality in the food industry. If you take one random cup of jello, will you find the penny? Probably not. But it you take numerous 1 cup samples from random areas within the batch, you increase your chances of finding the contaminate. This is the best approach for sampling any cannabis product.

The best way to approve a batch of cannabis product is to take several random samples and composite them. But you may need to run several samples from this composite to truly understand what is in the batch. In the swimming pool example, if you take one teaspoon scoop, will you find one of the pennies? The best way to find one of the pennies is to take numerous random samples, composite them and increase the number of tests you perform at the lab. This should be done on any new vendor/cultivator you work with, in order to help establish the safety of the product.

Heavy Metals Testing: Methods, Strategies & Sampling

By Charles Deibel
3 Comments

Editor’s Note: The following is based on research and studies performed in their Santa Cruz Lab, with contributions from Mikhail Gadomski, Lab Manager, Ryan Maus Technical Services Analyst, Laurie Post, Director of Food Safety & Compliance, and Charles Deibel, President Deibel Cannabis Labs.


Heavy metals are common environmental contaminants resulting from human industrial activities such as mining operations, industrial waste, automotive emissions, coal fired power plants and farm/house hold water run-off. They affect the water and soil, and become concentrated in plants, animals, pesticides and the sediments used to make fertilizers. They can also be present in low quality glass or plastic packaging materials that can leach into the final cannabis product upon contact. The inputs used by cultivators that can be contaminated with heavy metals include fertilizers, growing media, air, water and even the clone/plant itself.
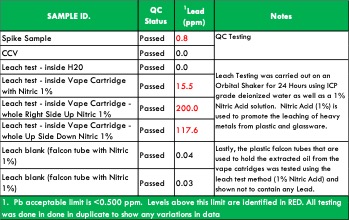
The four heavy metals tested in the cannabis industry are lead, arsenic, mercury and cadmium. The California Bureau of Cannabis Control (BCC) mandates heavy metals testing for all three categories of cannabis products (inhalable cannabis, inhalable cannabis products and other cannabis and cannabis products) starting December 31, 2018. On an ongoing basis, we recommend cultivators test for the regulated heavy metals in R&D samples any time there are changes in a growing process including changes to growing media, cannabis strains, a water system or source, packaging materials and fertilizers or pesticides. Cultivators should test the soil, nutrient medium, water and any new clones or plants for heavy metals. Pre-qualifying a new packaging material supplier or a water source prior to use is a proactive approach that could bypass issues with finished product.

Testing Strategies

The best approach to heavy metal detection is the use of an instrument called an Inductively Coupled Plasma Mass Spectrometry (ICP-MS). There are many other instruments that can test for heavy metals, but in order to achieve the very low detection limits imposed by most states including California, the detector must be the ICP-MS. Prior to detection using ICP-MS, cannabis and cannabis related products go through a sample preparation stage consisting of some form of digestion to completely break down the complex matrix and extract the heavy metals for analysis. This two-step process is relatively fast and can be done in a single day, however, the instruments used to perform the digestion are usually the limiting step as the digesters run in a batch of 8-16 samples over a 2-hour period.

Only trace amounts of heavy metals are allowed by California’s BCC in cannabis and cannabis products. A highly sensitive detection system finds these trace amounts and also allows troubleshooting when a product is found to be out of specification.

For example, during the course of testing, we have seen lead levels exceed the BCC’s allowable limit of 0.5 ppm in resin from plastic vape cartridges. An investigation determined that the plastic used to make the vape cartridge was the source of the excessive lead levels. Even if a concentrate passes the limits at the time of sampling, the concern is that over time, the lead leached from the plastic into the resin, increasing the concentration of heavy metals to unsafe levels.

Getting a Representative Sample

The ability to detect trace levels of heavy metals is based on the sample size and how well the sample represents the entire batch. The current California recommended amount of sample is 1 gram of product per batch.  Batch sizes can vary but cannot be larger than 50 pounds of flower. There is no upper limit to the batch sizes for other inhalable cannabis products (Category II).

It is entirely likely that two different 1 gram samples of flower can have two different results for heavy metals because of how small a sample is collected compared to an entire batch. In addition, has the entire plant evenly collected and concentrated the heavy metals into every square inch of it’s leaves? No, probably not. In fact, preliminary research in leafy greens shows that heavy metals are not evenly distributed in a plant. Results from soil testing can also be inconsistent due to clumping or granularity. Heavy metals are not equally distributed within a lot of soil and the one small sample that is taken may not represent the entire batch. That is why it is imperative to take a “random” sample by collecting several smaller samples from different areas of the entire batch, combining them, and taking a 1 g sample from this composite for analysis.


References

California Cannabis CPA. 12/18/2018.  “What to Know About California’s Cannabis Testing Requirements”. https://www.californiacannabiscpa.com/blog/what-to-know-about-californias-cannabis-testing-requirements. Accessed January 10, 2019.

Citterio, S., A. Santagostino, P. Fumagalli, N. Prato, P. Ranalli and S. Sgorbati. 2003.  Heavy metal tolerance and accumulation of Cd, Cr and Ni by Cannabis sativa L.. Plant and Soil 256: 243–252.

Handwerk, B. 2015.  “Modern Marijuana Is Often Laced With Heavy Metals and Fungus.” Smithsonian.com. https://www.smithsonianmag.com/science-nature/modern-marijuana-more-potent-often-laced-heavy-metals-and-fungus-180954696/

Linger, P.  J. Mussig, H. Fischer, J. Kobert. 2002.  Industrial hemp (Cannabis sativa L.) growing on heavy metal contaminated soil: fibre quality and phytoremediation potential. Ind. Crops Prod. 11, 73–84.

McPartland, J. and K. J McKernan. 2017.  “Contaminants of Concern in Cannabis: Microbes, Heavy Metals and Pesticides”.  In: S. Chandra et al. (Eds.) Cannabis sativa L. – Botany and Biotechnology.  Springer International Publishing AG. P. 466-467.  https://www.researchgate.net/publication/318020615_Contaminants_of_Concern_in_Cannabis_Microbes_Heavy_Metals_and_Pesticides.  Accessed January 10, 2019.

Sidhu, G.P.S.  2016.  Heavy metal toxicity in soils: sources, remediation technologies and challenges.   Adv Plants AgricRes. 5(1):445‒446.

Dr. Ed Askew
From The Lab

Quality Plans for Lab Services: Managing Risks as a Grower, Processor or Dispensary, Part 4

By Dr. Edward F. Askew
No Comments
Dr. Ed Askew

In the last three articles, I discussed the laboratory’s responses or defenses used to reply to your questions about laboratory results that place stress on the success of your business. The Quality Control (QC) results can cause this stress if they are not run correctly to answer the following questions:

  1. Are the laboratory results really true?
  2. Can the laboratory accurately analyze sample products like my sample?
  3. Can the laboratory reproduce the sample results for my type of sample?

Now let’s discuss the most important QC test that will protect your crop and business. That QC sample is the Matrix Sample. In the last article in this series, you were introduced to many QC samples. The Matrix Sample and Duplicate were some of them. Take a look back at Part 3 to familiarize yourself with the definitions.

The key factors of these QC sample types are:

  1. Your sample is used to determine if the analysis used by the laboratory can extract the analyte that is being reported back to you. This is performed by the following steps:
    1. Your sample is analyzed by the laboratory as received.
    2. Then a sub-sample of your sample is spiked with a known concentration of the analyte you are looking for (e.g. pesticides, bacteria, organic chemicals, etc.).
    3. The difference between the sample with and without a spike indicates whether the laboratory can even find the analyte of concern and whether the percent recovery is acceptable.
    4. Examples of failures are from my experiences:
      1. Laboratory 1 spiked a known amount of a pesticide into a wastewater matrix. (e.g. Silver into final treatment process water). The laboratory failed to recover any of the spiked silver. Therefore the laboratory results for these types of sample were not reporting any silver, but silver may be present. This is where laboratory results would be false negatives and the laboratory method may not work on the matrix (your sample) correctly. .
      2. Laboratory 2 ran an analysis for a toxic compound (e.g. Cyanide in final waste treatment discharge). A known amount of cyanide was spiked into a matrix sample and 4 times the actual concentration of that cyanide spike was recovered. This is where laboratory results would be called false positives and the laboratory method may not work on the matrix (your sample) correctly.
  2. Can the laboratory reproduce the results they reported to you?
    1. The laboratory needs to repeat the matrix spike analysis to provide duplicate results. Then a comparison of the results from the first matrix spike with its duplicate results will show if the laboratory can duplicate their test on your sample.
      1. If the original matrix spike result and the duplicate show good agreement (e.g. 20% relative percent difference or lower). Then you can be relatively sure that the result you obtained from the laboratory is true.
      2. But, if the original matrix spike result and the duplicate do not show good agreement (e.g. greater than 20% relative percent difference). Then you can be sure that the result you obtained from the laboratory is not true and you should question the laboratory’s competence.

Now, the question is why a laboratory would not perform these matrix spike and duplicate QC samples? Well, the following may apply:

  1. These matrix samples take too much time.
  2. These matrix samples add a cost that the laboratory cannot recover.
  3. These matrix samples are too difficult for the laboratory staff to perform.
  4. Most importantly: Matrix samples show the laboratory cannot perform the analyses correctly on the matrix.

So, what types of cannabis matrices are out there? Some examples include bud, leaf, oils, extracts and edibles. Those are some of the matrices and each one has their own testing requirements. So, what should you require from your laboratory?

  1. The laboratory must use your sample for both a matrix spike and a duplicate QC sample.
  2. The percent recovery of both the matrix spike and the duplicate will be between 80% and 120%. If either of the QC samples fail, then you should be notified immediately and the samples reanalyzed.
  3. If the relative percent difference between the matrix spike and the duplicate will be 20% or less. If the QC samples fail, then you should be notified immediately and the samples should be reanalyzed.

The impact of questionable laboratory results on your business with failing or absent matrix spike and the duplicate QC samples can be prevented. It is paramount that you hold the laboratory responsible to produce results that are representative of your sample matrix and that are true.

The next article will focus on how your business will develop a quality plan for your laboratory service provider with a specific focus on the California Code Of Regulations, Title 16, Division 42. Bureau Of Cannabis Control requirements.

Dr. Ed Askew
From The Lab

Quality Plans for Lab Services: Managing Risks as a Grower, Processor or Dispensary, Part 3

By Dr. Edward F. Askew
No Comments
Dr. Ed Askew

Editor’s Note: The views expressed in this article are the author’s opinions based on his experience working in the laboratory industry. This is an opinion piece in a series of articles designed to highlight the potential problems that clients may run into with labs. 


In the last two articles, I discussed the laboratory’s first line of defense (e.g. certification or accreditation) paperwork wall used if a grower, processor or dispensary (user/client) questioned a laboratory result and the conflicts of interest that exist in laboratory culture. Now I will discuss the second line of defense that a laboratory will present to the user in the paperwork wall: Quality Control (QC) results.

Do not be discouraged by the analytical jargon of the next few articles. I suggest that you go immediately to the conclusions to get the meat of this article and then read the rest of it to set you on the path to see the forest for the trees.

QC in a laboratory consists of a series of samples run by the laboratory to determine the accuracy and precision of a specific batch of samples. So, to start off, let’s look at the definitions of accuracy and precision.QC Charts can provide a detailed overview of laboratory performance in a well-run laboratory.

According to the Standard Methods for the Examination of Water and Wastewater:

Accuracy: estimate of how close a measured value is to the true value; includes expressions for bias and precision.

Precision: a measure of the degree of agreement among replicate analyses of a sample.

A reputable laboratory will measure the Accuracy and Precision of QC samples in a batch of user samples and record these values in both the analytical test report issued to the user and in control charts kept by the laboratory. These control charts can be reviewed by the user if they are requested by the user. These control charts record:

Accuracy (means) chart: The accuracy chart for QC samples (e.g., LRB, CCV, LFBs, LFMs, and surrogates) is constructed from the average and standard deviation of a specified number of measurements of the analyte of interest.

Precision (range) chart: The precision chart also is constructed from the average and standard deviation of a specified number of measurements (e.g., %RSD or RPD) for replicate of duplicate analyses of the analyte of interest.

Now, let’s look at what should be run in a sample batch for cannabis analyses. The typical cannabis sample would have analyses for cannabinoids, terpenes, microbiological, organic compounds, pesticides and heavy metals.

Each compound listed above would require a specific validated analytical method for the type of matrix being analyzed. Examples of specific matrixes are:

  • Cannabis buds, leaves, oil
  • Edibles, such as Chocolates, Baked Goods, Gummies, Candies and Lozenges, etc.
  • Vaping liquids
  • Tinctures
  • Topicals, such as lotions, creams, etc.

Running QC analyses does not guarantee that the user’s specific sample in the batch was analyzed correctly.

Also, both ISO 17025-2005 and ISO 17025-2017 require the use of a validated method.

ISO 17025-2005: When it is necessary to use methods not covered by standard methods, these shall be subject to agreement with the customer and shall include a clear specification of the customer’s requirements and the purpose of the test and/or calibration. The method developed shall have been validated appropriately before use.

ISO 17025-2017: The laboratory shall validate non-standard methods, laboratory-developed methods and standard methods used outside their intended scope or otherwise modified. The validation shall be as extensive as is necessary to meet the needs of the given application or field of application.

Validation procedures can be found in a diverse number of analytical chemistry associations (such as AOACand ASTM) but the State of California has directed users and laboratories to the FDA manual “Guidelines for the Validation of Chemical Methods for the FDA FVM Program, 2nd Edition, 2015

The laboratory must have on file for user review the following minimum results in an analytical statistical report validating their method:

  • accuracy,
  • limit of quantitation,
  • ruggedness,
  • precision,The user must look beyond the QC data provided in their analytical report or laboratory control charts.
  • linearity (or other calibration model),
  • confirmation of identity
  • selectivity,
  • range,
  • spike recovery.
  • limit of detection,
  • measurement uncertainty,

The interpretation of an analytical statistical report will be discussed in detail in the next article. Once the validated method has been selected for the specific matrix, then a sample batch is prepared for analysis.

Sample Batch: A sample batch is defined as a minimum of one (1) to a maximum of twenty (20) analytical samples run during a normal analyst’s daily shift. A LRB, LFB, LFM, LFMD, and CCV will be run with each sample batch. Failure of any QC sample in sample batch will require a corrective action and may require the sample batch to be reanalyzed. The definitions of the specific QC samples are described later.

The typical sample batch would be set as:

  • Instrument Start Up
  • Calibration zero
  • Calibration Standards, Quadratic
  • LRB
  • LFB
  • Sample used for LFM/LFMD
  • LFM
  • LFMD
  • Samples (First half of batch)
  • CCV
  • Samples (Second half of batch)
  • CCV

The QC samples are defined as:

Calibration Blank: A volume of reagent water acidified with the same acid matrix as in the calibration standards. The calibration blank is a zero standard and is used to calibrate the ammonia analyzer

Continuing Calibration Verification (CCV): A calibration standard, which is analyzed periodically to verify the accuracy of the existing calibration for those analytes.

Calibration Standard: A solution prepared from the dilution of stock standard solutions. These solutions are used to calibrate the instrument response with respect to analyte concentration

Laboratory Fortified Blank (LFB): An aliquot of reagent water or other blank matrix to which known quantities of the method analytes and all the preservation compounds are added. The LFB is processed and analyzed exactly like a sample, and its purpose is to determine whether the methodology is in control, and whether the laboratory is capable of making accurate and precise measurements.

Laboratory Fortified Sample Matrix/Duplicate (LFM/LFMD) also called Matrix Spike/Matrix Spike Duplicate (MS/MSD): An aliquot of an environmental sample to which known quantities of ammonia is added in the laboratory. The LFM is analyzed exactly like a sample, and its purpose is to determine whether the sample matrix contributes bias to the analytical results. The background concentrations of the analytes in the sample matrix must be determined in a separate aliquot and the measured values in the LFM corrected for background concentrations (Section 9.1.3).Laboratories must validate their methods.

Laboratory Reagent Blank (LRB): A volume of reagent water or other blank matrix that is processed exactly as a sample including exposure to all glassware, equipment, solvents and reagents, sample preservatives, surrogates and internal standards that are used in the extraction and analysis batches. The LRB is used to determine if the method analytes or other interferences are present in the laboratory environment, the reagents, or the apparatus.

Once a sample batch is completed, then some of the QC results are provided in the user’s analytical report and all of the QC results should be recorded in the control charts identified in the accuracy and precision section above.

But having created a batch and performing QC sample analyses, the validity of the user’s analytical results is still not guaranteed. Key conclusion points to consider are:

  1. Laboratories must validate their methods.
  2. Running QC analyses does not guarantee that the user’s specific sample in the batch was analyzed correctly.
  3. QC Charts can provide a detailed overview of laboratory performance in a well-run laboratory.

The user must look beyond the QC data provided in their analytical report or laboratory control charts. Areas to look at will be covered in the next few articles in this series.